MirPapa_Library_ICTLibrary "MirPapa_Library_ICT"
GetHTFoffsetToLTFoffset(_offset, _chartTf, _htfTf)
GetHTFoffsetToLTFoffset
@description Adjust an HTF offset to an LTF offset by calculating the ratio of timeframes.
Parameters:
_offset (int) : int The HTF bar offset (0 means current HTF bar).
_chartTf (string) : string The current chart’s timeframe (e.g., "5", "15", "1D").
_htfTf (string) : string The High Time Frame string (e.g., "60", "1D").
@return int The corresponding LTF bar index. Returns 0 if the result is negative.
IsConditionState(_type, _isBull, _level, _open, _close, _open1, _close1, _low1, _low2, _low3, _low4, _high1, _high2, _high3, _high4)
IsConditionState
@description Evaluate a condition state based on type for COB, FVG, or FOB.
Overloaded: first signature handles COB, second handles FVG/FOB.
Parameters:
_type (string) : string Condition type ("cob", "fvg", "fob").
_isBull (bool) : bool Direction flag: true for bullish, false for bearish.
_level (int) : int Swing level (only used for COB).
_open (float) : float Current bar open price (only for COB).
_close (float) : float Current bar close price (only for COB).
_open1 (float) : float Previous bar open price (only for COB).
_close1 (float) : float Previous bar close price (only for COB).
_low1 (float) : float Low 1 bar ago (only for COB).
_low2 (float) : float Low 2 bars ago (only for COB).
_low3 (float) : float Low 3 bars ago (only for COB).
_low4 (float) : float Low 4 bars ago (only for COB).
_high1 (float) : float High 1 bar ago (only for COB).
_high2 (float) : float High 2 bars ago (only for COB).
_high3 (float) : float High 3 bars ago (only for COB).
_high4 (float) : float High 4 bars ago (only for COB).
@return bool True if the specified condition is met, false otherwise.
IsConditionState(_type, _isBull, _pricePrev, _priceNow)
IsConditionState
@description Evaluate FVG or FOB condition based on price movement.
Parameters:
_type (string) : string Condition type ("fvg", "fob").
_isBull (bool) : bool Direction flag: true for bullish, false for bearish.
_pricePrev (float) : float Previous price (for FVG/FOB).
_priceNow (float) : float Current price (for FVG/FOB).
@return bool True if the specified condition is met, false otherwise.
IsSwingHighLow(_isBull, _level, _open, _close, _open1, _close1, _low1, _low2, _low3, _low4, _high1, _high2, _high3, _high4)
IsSwingHighLow
@description Public wrapper for isSwingHighLow.
Parameters:
_isBull (bool) : bool Direction flag: true for bullish, false for bearish.
_level (int) : int Swing level (1 or 2).
_open (float) : float Current bar open price.
_close (float) : float Current bar close price.
_open1 (float) : float Previous bar open price.
_close1 (float) : float Previous bar close price.
_low1 (float) : float Low 1 bar ago.
_low2 (float) : float Low 2 bars ago.
_low3 (float) : float Low 3 bars ago.
_low4 (float) : float Low 4 bars ago.
_high1 (float) : float High 1 bar ago.
_high2 (float) : float High 2 bars ago.
_high3 (float) : float High 3 bars ago.
_high4 (float) : float High 4 bars ago.
@return bool True if swing condition is met, false otherwise.
AddBox(_left, _right, _top, _bot, _xloc, _colorBG, _colorBD)
AddBox
@description Draw a rectangular box on the chart with specified coordinates and colors.
Parameters:
_left (int) : int Left bar index for the box.
_right (int) : int Right bar index for the box.
_top (float) : float Top price coordinate for the box.
_bot (float) : float Bottom price coordinate for the box.
_xloc (string) : string X-axis location type (e.g., xloc.bar_index).
_colorBG (color) : color Background color for the box.
_colorBD (color) : color Border color for the box.
@return box Returns the created box object.
Addline(_x, _y, _xloc, _color, _width)
Addline
@description Draw a vertical or horizontal line at specified coordinates.
Parameters:
_x (int) : int X-coordinate for start (bar index).
_y (int) : float Y-coordinate for start (price).
_xloc (string) : string X-axis location type (e.g., xloc.bar_index).
_color (color) : color Line color.
_width (int) : int Line width.
@return line Returns the created line object.
Addline(_x, _y, _xloc, _color, _width)
Parameters:
_x (int)
_y (float)
_xloc (string)
_color (color)
_width (int)
Addline(_x1, _y1, _x2, _y2, _xloc, _color, _width)
Parameters:
_x1 (int)
_y1 (int)
_x2 (int)
_y2 (int)
_xloc (string)
_color (color)
_width (int)
Addline(_x1, _y1, _x2, _y2, _xloc, _color, _width)
Parameters:
_x1 (int)
_y1 (int)
_x2 (int)
_y2 (float)
_xloc (string)
_color (color)
_width (int)
Addline(_x1, _y1, _x2, _y2, _xloc, _color, _width)
Parameters:
_x1 (int)
_y1 (float)
_x2 (int)
_y2 (int)
_xloc (string)
_color (color)
_width (int)
Addline(_x1, _y1, _x2, _y2, _xloc, _color, _width)
Parameters:
_x1 (int)
_y1 (float)
_x2 (int)
_y2 (float)
_xloc (string)
_color (color)
_width (int)
AddlineMid(_type, _left, _right, _top, _bot, _xloc, _color, _width)
AddlineMid
@description Draw a midline between top and bottom for FVG or FOB types.
Parameters:
_type (string) : string Type identifier: "fvg" or "fob".
_left (int) : int Left bar index for midline start.
_right (int) : int Right bar index for midline end.
_top (float) : float Top price of the region.
_bot (float) : float Bottom price of the region.
_xloc (string) : string X-axis location type (e.g., xloc.bar_index).
_color (color) : color Line color.
_width (int) : int Line width.
@return line or na Returns the created line or na if type is not recognized.
GetHtfFromLabel(_label)
GetHtfFromLabel
@description Convert a Korean HTF label into a Pine Script timeframe string via handler library.
Parameters:
_label (string) : string The Korean label (e.g., "5분", "1시간").
@return string Returns the corresponding Pine Script timeframe (e.g., "5", "60").
IsChartTFcomparisonHTF(_chartTf, _htfTf)
IsChartTFcomparisonHTF
@description Determine whether a given HTF is greater than or equal to the current chart timeframe.
Parameters:
_chartTf (string) : string Current chart timeframe (e.g., "5", "15", "1D").
_htfTf (string) : string HTF timeframe (e.g., "60", "1D").
@return bool True if HTF ≥ chartTF, false otherwise.
CreateBoxData(_type, _isBull, _useLine, _top, _bot, _xloc, _colorBG, _colorBD, _offset, _htfTf, htfBarIdx, _basePoint)
CreateBoxData
@description Create and draw a box and optional midline for given type and parameters. Returns success flag and BoxData.
Parameters:
_type (string) : string Type identifier: "fvg", "fob", "cob", or "sweep".
_isBull (bool) : bool Direction flag: true for bullish, false for bearish.
_useLine (bool) : bool Whether to draw a midline inside the box.
_top (float) : float Top price of the box region.
_bot (float) : float Bottom price of the box region.
_xloc (string) : string X-axis location type (e.g., xloc.bar_index).
_colorBG (color) : color Background color for the box.
_colorBD (color) : color Border color for the box.
_offset (int) : int HTF bar offset (0 means current HTF bar).
_htfTf (string) : string HTF timeframe string (e.g., "60", "1D").
htfBarIdx (int) : int HTF bar_index (passed from HTF request).
_basePoint (float) : float Base point for breakout checks.
@return tuple(bool, BoxData) Returns a boolean indicating success and the created BoxData struct.
ProcessBoxDatas(_datas, _useMidLine, _closeCount, _colorClose)
ProcessBoxDatas
@description Process an array of BoxData structs: extend, record volume, update stage, and finalize boxes.
Parameters:
_datas (array) : array Array of BoxData objects to process.
_useMidLine (bool) : bool Whether to update the midline endpoint.
_closeCount (int) : int Number of touches required to close the box.
_colorClose (color) : color Color to apply when a box closes.
@return void No return value; updates are in-place.
BoxData
Fields:
_isActive (series bool)
_isBull (series bool)
_box (series box)
_line (series line)
_basePoint (series float)
_boxTop (series float)
_boxBot (series float)
_stage (series int)
_isStay (series bool)
_volBuy (series float)
_volSell (series float)
_result (series string)
LineData
Fields:
_isActive (series bool)
_isBull (series bool)
_line (series line)
_basePoint (series float)
_stage (series int)
_isStay (series bool)
_result (series string)
Search in scripts for "sweep"

Apex Edge SMC Tactical Suite
🛰 Apex Edge SMC Tactical Suite
Apex Edge SMC Tactical Suite is a precision-engineered multi-signal tool designed for advanced traders who demand real-time edge detection, breakout identification, and smart volatility-based risk placement. Built to blend seamlessly into any price action, SMC, or momentum-based strategy.
🔧 Core Features:
📍 Entry Signals
Green & red arrows appear only when a candle meets strict "Power Candle" criteria:
High momentum breakout
Volume spike confirmation
OBV spike divergence
Trend & HTF filter optional
Volatility-adjusted stop placement
💥 Power Candles
Smart detection of explosive volume+range candles
Custom "fuel score" system ranks their momentum potential
Displays as either candle highlights or subtle labels
📊 Fuel Meter
RSI-based energy tracker with customizable threshold
Plots real-time bar strength on a mini histogram
🧠 Trap Detection + Reversals
Detects stop hunt wicks or "liquidity traps"
Shows reversal diamonds on potential reclaim setups
Built-in swing logic confirms trap reversals
🧮 HTF Filtering
Optional higher-timeframe trend filter via Hull MA
Keeps signals aligned with broader market direction
📦 TP/SL Zones
Risk is calculated using volatility clustering (recent swing zones)
TP auto-calculated using ATR-based expansion
🔔 Alerts Included:
✅ Power Candle Detection
✅ Long/Short Entry Alerts
✅ Exit Signal Alerts
✅ Trap Defense Alerts
✅ Trap Reversal Confirmations
🎯 Ideal For:
SMC / ICT traders
Breakout traders
Trend followers
Scalpers / intraday setups
Momentum + volume combo traders
⚠️ Tip: Best paired with clean chart layouts, market structure, or order block frameworks. Can be combined with internal/external liquidity sweep logic for extra confluence.
Feel free to play around with the code and if you're a professional coder (unlike me) then please tag me into any versions that you can make better. Enjoy!
Disclaimer - This script was created entirely with many hours using the assistance of ChatGPT

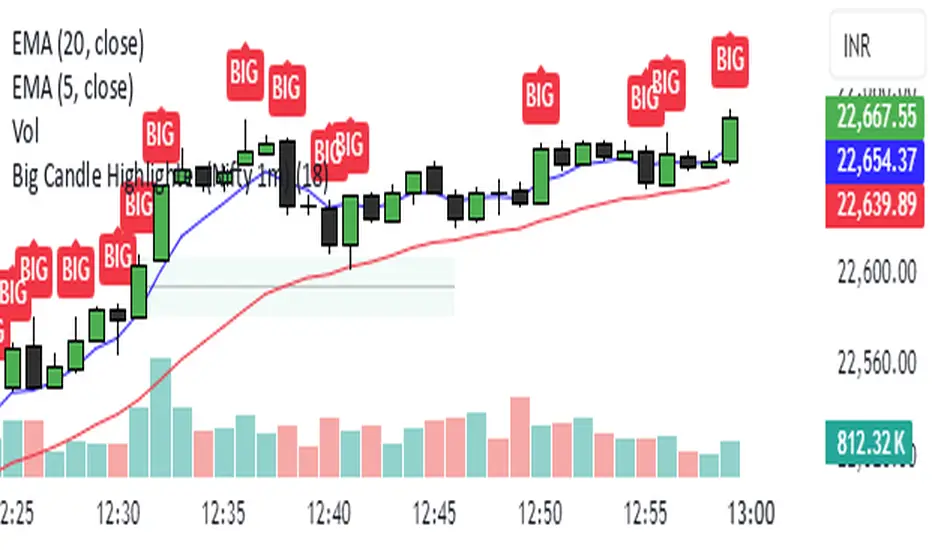
Big Candle Highlighter (Nifty 1m)This indicator will help option buyers to avoid taking trade in impulsive candles.
For Example :
Normal 1m candle: ~10–15 pts
Big candle (possible liquidity/impulse): >18 pts
Very large / avoid chasing: >25 pts
If you see a candle that breaks structure with a 25-30 point range and closes strong, it’s often:
A liquidity sweep
A news spike
Or the start of an impulsive leg — in which case entering at close can be risky without a retest
ICT Judas + Silver Bullet🔰 ICT Judas + Silver Bullet Indicator (SMC-based)
Built for Prop Firm and High Win Rate Intraday Traders
This indicator identifies key institutional setups from Inner Circle Trader (ICT) and Smart Money Concepts (SMC) strategies, optimized for XAUUSD, EURUSD, and other high-volume pairs on the 5-minute chart.
📌 Core Features:
✅ Asian Range Box (02:00–08:00 SGT) – used as manipulation anchor
✅ London Killzone (14:00–16:00 SGT) – Judas Swing detection
✅ New York Killzone (22:30–23:30 SGT) – Silver Bullet setups
✅ Automatic Fair Value Gap (FVG) detection
✅ Liquidity sweep detection based on 20-bar EQH/EQL
✅ Entry + Stop Loss + Take Profit visualization with adjustable RR
✅ Alerts for Judas and Silver setups
✅ Perfect for prop firm scalping and intraday swing logic
🛠️ How It Works:
- Judas Swing: triggers when liquidity above the Asian high is swept during London Killzone
- Silver Bullet: triggers when liquidity below recent lows is swept during NY Killzone
- Entry shown via circle, SL and TP lines based on user-defined RR and stop-loss pip distance
- Designed to be paired with SMC/ICT OB/FVG confirmation entries
⚙️ Settings:
- Adjustable session times
- Toggle FVG display
- Set RR and SL pips to match prop firm rules
- Compatible with alert webhooks for Telegram
🕰️ Note:
All times are fixed to **SGT (GMT+8)**. If you're in another timezone, adjust your TradingView timezone accordingly or update the session inputs manually during Daylight Saving Time changes.
🔔 Alert-Ready:
Use alerts for live signals and pair with webhooks for automation.
🔍 Recommended Pairings:
XAUUSD, EURUSD, GBPUSD, NAS100 on M5 chart
📈 Win Rate Potential:
Backtested with high-probability setups aligned with prop firm daily goals. Best used with strict discipline and 1-2 setups per day.
—
Built with ❤️ by a trader, for traders looking for precision-based executions using ICT logic.

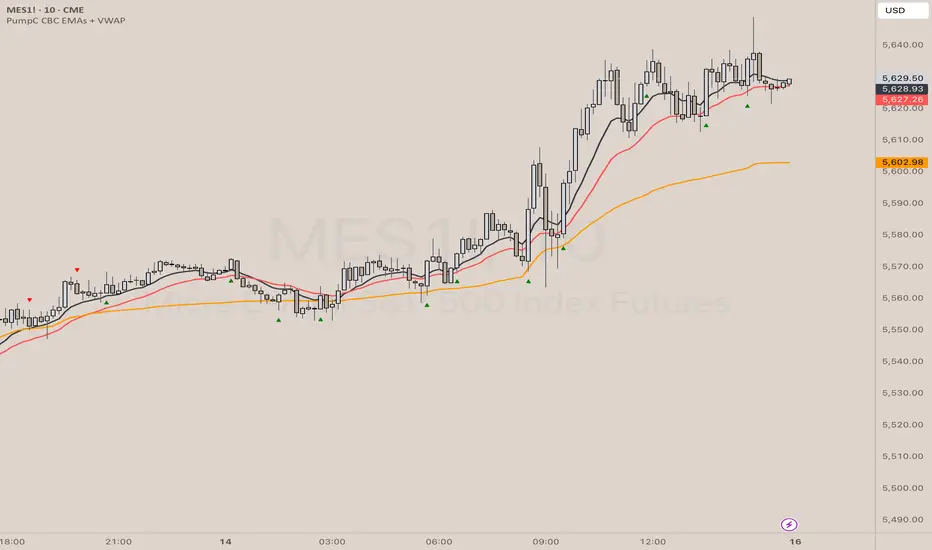
PumpC CBC EMAs + VWAPPumpC CBC EMAs + VWAP Indicator for Tradingview
Introduction
This is an indicator for the Candle By Candle (CBC) Flip strategy , based on the CBC Flip concept taught by MapleStax and inspired by the original CBC Flip indicator by AsiaRoo . The CBC Flip strategy is a simple yet effective approach to gauge if bulls or bears are in control for any given candle.
The logic behind the CBC Flip is as follows:
Bullish Flip : If the most recent candle’s close is above the previous candle’s high, bulls have taken control.
Bearish Flip : If the most recent candle’s close is below the previous candle’s low, bears are now in control.
No Flip : If neither condition is met, the previously dominant side (bulls or bears) remains in control until one of these conditions is satisfied, flipping the market sentiment—hence the name CBC Flip .
The PumpC CBC EMAs + VWAP Indicator enhances this simple strategy by adding trend confirmation filters using EMAs and VWAP , along with time-restricted signal generation and fully customizable alerts.
What Does This Indicator Do?
The PumpC CBC EMAs + VWAP Indicator helps traders identify CBC Flips to spot potential trend continuations or reversals. It combines candlestick logic , trend filters , and time-based restrictions to provide high-probability trade signals.
CBC Flip Detection
Bullish Flip : Current close is above the previous candle’s high.
Bearish Flip : Current close is below the previous candle’s low.
Strict Flips : Require a liquidity sweep for higher accuracy.
All Flips : Looser conditions that generate more frequent signals.
EMA and VWAP Trend Confirmation (Optional)
This filter ensures that long signals only trigger when the Slow EMA is above the VWAP , confirming an upward trend. For short signals, the Slow EMA must be below the VWAP.
Time-Based Filtering
The indicator allows you to set a specific trading window (e.g., 9:00 AM to 3:00 PM), helping you avoid low-volume or high-risk periods.
Visual Labels and Alerts
Labels : Arrows (▲ for long and ▼ for short) mark CBC Flip points on the chart.
Alerts : Fully customizable notifications for each signal type, based on your chosen filters.
Key Features
CBC Flip Detection : Identify potential reversals and trend continuations.
Strict vs. All Flips : Choose between higher-accuracy strict flips or more frequent all flips.
EMA-to-VWAP Filter : Optional trend confirmation filter to reduce false signals.
Customizable EMAs and VWAP : Configure lengths and colors for visual clarity.
Time-Restricted Signals : Focus on your preferred trading session.
Custom Alerts : Notifications for long and short signals based on filter settings.
Credits and Inspiration
The CBC Flip strategy was created by MapleStax .
This indicator is inspired by the original CBC Flip indicator by AsiaRoo .
Additional enhancements include EMA-to-VWAP filtering , custom alerts , and time-restricted signal generation for a more comprehensive trading experience.
Risks and Disclaimer
This indicator is for educational purposes only and does not constitute financial advice.
Trading involves significant risk, and past performance does not guarantee future results. Always test this indicator in a simulated environment before live trading.
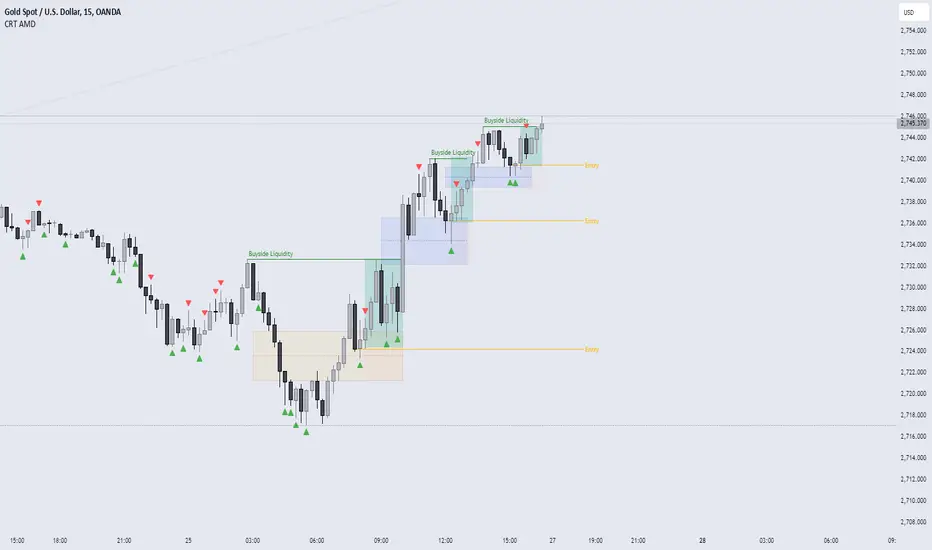
4H CRT (1AM and 5AM)This TradingView script is designed to assist traders in implementing the "4-Hour Candle Ranges Theory Strategy (CRT)" by identifying key levels and setups based on the 1am and 4am (5am) 4-hour candles. This strategy is particularly effective for trading high-volatility assets such as Gold, EUR/USD, NAS100, US30, and S&P500, with US30 showing a notably high win rate. Here's how the strategy works:
Key Features:
1. Marking 1am and 4am 4-Hour Candle Ranges
- The script highlights the high and low of the 1am 4-hour candle.
- It visually tracks whether the high or low of the 1am candle is taken out by the subsequent 4-hour candle (5am).
2. Entry Setup Rules
- Primary Setup: Wait for the high or low of the 1am candle to be taken out by the 5am candle. Once this sweep occurs, wait for a Market Structure Shift (MSS) on the lower time frame (15min) to confirm your entry.
- Secondary Setup: If the 5am candle fails to take out the high or low of the 1am candle, the setup focuses on the levels formed by the 5am candle.
3. Trade Execution on 15-Minute Timeframe
- The script supports a lower time frame (15min) view to identify MSS and fine-tune entries.
4. Rinse and Repeat
- This process can be applied daily for consistent opportunities across the specified assets.
Advantages:
- Provides clear visual markers for key levels based on the 4-hour candles.
- Automates level plotting, saving traders time and reducing manual errors.
- Integrates well with the 15-minute timeframe for precise entry triggers.
- Optimized for popular trading instruments, especially US30 for a higher probability of success.
This script simplifies the application of CRT by automating the process of identifying and marking critical levels, enabling traders to focus on executing high-probability setups effectively.
Created by Hamid (poraymanfx)

Previous Candle Sweep IndicatorThis script identifies candlesticks where the current candle's high is higher than the previous candle's high, and the current candle's low is lower than the previous candle's low. If both conditions are met, the candle's body is highlighted in blue on the chart, allowing traders to quickly spot these patterns.
Features:
Highlights candles with both higher highs and lower lows.
Uses clear visual cues (blue body) for easy identification.
Ideal for traders looking to identify specific volatility patterns or reversals.

SMC Order Block & Liquidity EntryThe SMC Order Block and Liquidity Trap Entry Strategy script uses Smart Money Concepts (SMC), which analyze institutional actions in the market, to assist traders in identifying high-probability trades. In order to help traders match their entry with institutional activity, this script highlights important regions of interest, including order blocks, liquidity zones, and indications for Break of Structure (BOS) or Change of Character (CHoCH).
The fundamental ideas of this approach, which focuses on regions where institutions frequently make sizable orders or sweep liquidity, are based on SMC principles. Order blocks, which are frequently important support or resistance zones when institutions are involved, are the final bullish or bearish candle before a significant price move in the other direction. There are liquidity zones that show where retail stop-loss orders build up (above recent highs or below recent lows), such as Buy-Side Liquidity (BSL) and Sell-Side Liquidity (SSL). Before changing the direction of the price, institutions could target these zones, giving traders possible chances.
The script depicts liquidity levels above or below recent highs and lows, automatically finds order blocks within a specified lookback time, and looks for BOS (a continuation signal) or CHoCH (a reversal signal). When liquidity retests inside an order block coincide with BOS or CHoCH circumstances, entry signals are produced. While short entries are triggered when the price breaks below the order block and SSL, long entry alerts are triggered when the price breaks above the order block and BSL.

CRT AMD indicatorThis indicator is based on the Power of three (Accumulation Manipulation Distribution) Cycle, by marking the candle that Sweep the low or high of the previous candle and then closed back inside the range of the previous candle, indicating a possibility of a Manipulation or Reversal.
Combining the indicator with HTF Array and LTF Setup Entry will significantly improve the accuracy.
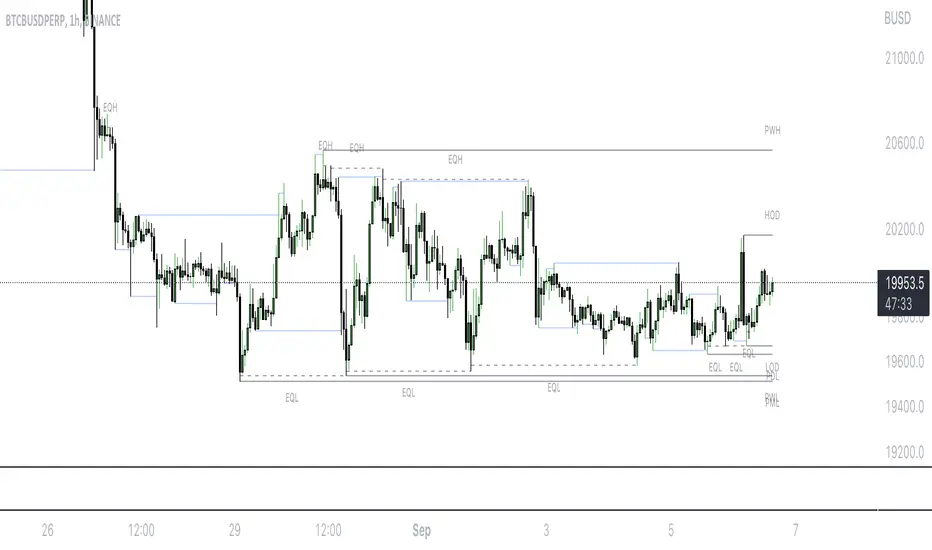
Smart Money Setup 07 [TradingFinder] Liquidity Hunts & Minor OB🔵 Introduction
The Smart Money Concept relies on analyzing market structure, tracking liquidity flows, and identifying order blocks. Research indicates that traders who apply these methods can improve their accuracy in predicting market movements by up to 30%.
These elements allow traders to understand the behavior of market makers, including banks and large financial institutions, which have the ability to influence price movements and shape major market trends. By recognizing how these entities operate, traders can align their strategies with Smart Money actions and better anticipate shifts in the market.
Smart Money typically enters the market at points of high liquidity where trading opportunities are more attractive. By following these liquidity flows, professional traders can position themselves at market reversal points, leading to profitable trades.
The Smart Money Setup 07 indicator has been specifically designed to detect these complex patterns. Using advanced algorithms, this indicator automatically identifies both bullish and bearish trading setups, assisting traders in discovering hidden market opportunities.
As a powerful technical analysis tool, the Smart Money Setup indicator helps predict the actions of major market participants and highlights optimal entry and exit points. Essentially, this tool enables traders to act like institutional investors and market makers, making the most of price fluctuations in their favor.
Ultimately, the Smart Money Setup 07 indicator transforms complex technical analysis into a simple and practical tool. By detecting order blocks and liquidity zones, this tool helps traders execute their strategies with greater precision, leading to more informed and successful trading decisions.
🟣 Bullish Setup
🟣 Bearish Setup
🔵 How to Use
One of the key strengths of the Smart Money Setup 07 indicator is its ability to accurately identify order blocks and analyze liquidity flows. Order blocks represent areas where large buy or sell orders are placed by Smart Money investors, which often indicate key reversal points in the market. Traders can use these order blocks to pinpoint potential entry and exit opportunities.
The Smart Money Setup indicator detects and visually displays these order blocks on the chart, helping traders identify the best zones to enter or exit trades. Since these zones are frequently used by large institutional investors, following these blocks allows traders to capitalize on price fluctuations and trade with confidence.
🟣 Bullish Smart Money Setup
A Bullish Smart Money Setup forms when the market creates Higher Lows and Higher Highs. In this situation, the indicator analyzes pivot points, liquidity flows, and order blocks to identify buy opportunities. Liquidity points in these setups indicate areas where Smart Money is likely to enter long positions.
In the bullish setup image, multiple Higher Lows and Higher Highs are formed. The green zone represents a Bullish Order Block, signaling traders to enter a long trade. The Smart Money Setup indicator displays a green arrow, indicating a high-probability upward price movement from this liquidity zone.
🟣 Bearish Smart Money Setup
A Bearish Smart Money Setup occurs when the market structure shows Lower Highs and Lower Lows, indicating weakness in price. The indicator identifies these patterns and highlights potential sell opportunities. Liquidity points in this setup mark areas where Smart Money enters sell positions.
In the bearish setup image, a Lower High is followed by a Lower Low, with the red liquidity zone acting as a Bearish Order Block. The Smart Money Setup indicator shows a red arrow, signaling a likely downward move, offering traders an opportunity to enter short positions.
🔵 Settings
Pivot Period : This setting determines how many candles are needed to form a pivot point. A default value of 2 is optimal for quickly identifying key pivot points in price action.
Order Block Validity Period : This parameter defines the lifespan of an order block. Traders can adjust how long each order block remains valid. For instance, setting it to 500 means that an order block will be valid for 500 bars after its formation.
Mitigation Level OB : This setting allows traders to select whether order blocks should be based on the "Proximal," "50% OB," or "Distal" levels, helping traders manage risk more effectively.
Order Block Refinement : Traders can refine the order blocks with precision. The indicator offers two refinement modes: Defensive and Aggressive. The Defensive mode identifies safer order blocks, while the Aggressive mode targets higher-risk blocks with the potential for larger reversals.
🔵 Conclusion
The Smart Money Setup 07 indicator is a powerful tool for identifying key Smart Money movements in the market. It provides traders with essential insights for making informed trading decisions, particularly when combined with technical analysis and liquidity flow analysis. This indicator allows traders to accurately pinpoint entry and exit points, helping them maximize profits and minimize risk.
By offering a range of customizable settings, the Smart Money Setup indicator adapts to different trading styles and strategies. Furthermore, its ability to detect order blocks and identify supply and demand zones makes it an indispensable tool for any trader looking to enhance their strategy.
In conclusion, the Smart Money Setup 07 is a crucial tool for traders aiming to optimize their trading performance. By utilizing the concepts of Smart Money in technical analysis, traders can make more precise decisions and take advantage of market fluctuations.

Swing Failure Pattern SFP [TradingFinder] SFP ICT Strategy🔵 Introduction
The Swing Failure Pattern (SFP), also referred to as a "Fake Breakout" or "False Breakout," is a vital concept in technical analysis. This pattern is derived from classic technical analysis, price action strategies, ICT concepts, and Smart Money Concepts.
It’s frequently utilized by traders to identify potential trend reversals in financial markets, especially in volatile markets like cryptocurrencies and forex. SFP helps traders recognize failed attempts to breach key support or resistance levels, providing strategic opportunities for trades.
The Swing Failure Pattern (SFP) is a popular strategy among traders used to identify false breakouts and potential trend reversals in the market. This strategy involves spotting moments where the price attempts to break above or below a previous high or low (breakout) but fails to sustain the move, leading to a sharp reversal.
Traders use this strategy to identify liquidity zones where stop orders (stop hunt) are typically placed and targeted by larger market participants or whales.
When the price penetrates these areas but fails to hold the levels, a liquidity sweep occurs, signaling exhaustion in the trend and a potential reversal. This strategy allows traders to enter the market at the right time and capitalize on opportunities created by false breakouts.
🟣 Types of SFP
When analyzing SFPs, two main variations are essential :
Real SFP : This occurs when the price breaks a critical level but fails to close above it, then quickly reverses. Due to its clarity and strong signal, this SFP type is highly reliable for traders.
Considerable SFP : In this scenario, the price closes slightly above a key level but quickly declines. Although significant, it is not as definitive or trustworthy as a Real SFP.
🟣 Understanding SFP
The Swing Failure Pattern, or False Breakout, is identified when the price momentarily breaks a crucial support or resistance level but cannot maintain the movement, leading to a rapid reversal.
The pattern can be categorized as follows :
Bullish SFP : This type occurs when the price dips below a support level but rebounds above it, signaling that sellers failed to push the price lower, indicating a potential upward trend.
Bearish SFP : This pattern forms when the price surpasses a resistance level but fails to hold, suggesting that buyers couldn’t maintain the higher price, leading to a potential decline.
🔵 How to Use
To effectively identify an SFP or Fake Breakout on a price chart, traders should follow these steps :
Identify Key Levels: Locate significant support or resistance levels on the chart.
Observe the Fake Breakout: The price should break the identified level but fail to close beyond it.
Monitor Price Reversal: After the breakout, the price should quickly reverse direction.
Execute the Trade: Traders typically enter the market after confirming the SFP.
🟣 Examples
Bullish Example : Bitcoin breaks below a $30,000 support level, drops to $29,000, but closes above $30,000 by the end of the day, signaling a Real Bullish SFP.
Bearish Example : Ethereum surpasses a $2,000 resistance level, rises to $2,100, but then falls back below $2,000, forming a Bearish SFP.
🟣 Pros and Cons of SFP
Pros :
Effective in identifying strong reversal points.
Offers a favorable risk-to-reward ratio.
Applicable across different timeframes.
Cons :
Requires experience and deep market understanding.
Risk of encountering false breakouts.
Should be combined with other technical tools for optimal effectiveness.
🔵 Settings
🟣 Logical settings
Swing period : You can set the swing detection period.
SFP Type : Choose between "All", "Real" and "Considerable" modes to identify the swing failure pattern.
Max Swing Back Method : It is in two modes "All" and "Custom". If it is in "All" mode, it will check all swings, and if it is in "Custom" mode, it will check the swings to the extent you determine.
Max Swing Back : You can set the number of swings that will go back for checking.
🟣 Display settings
Displaying or not displaying swings and setting the color of labels and lines.
🟣 Alert Settings
Alert SFP : Enables alerts for Swing Failure Pattern.
Message Frequency : Determines the frequency of alerts. Options include 'All' (every function call), 'Once Per Bar' (first call within the bar), and 'Once Per Bar Close' (final script execution of the real-time bar). Default is 'Once per Bar'.
Show Alert Time by Time Zone : Configures the time zone for alert messages. Default is 'UTC'.
🔵 Conclusion
The Swing Failure Pattern (SFP), or False Breakout, is an essential analytical tool that assists traders in identifying key market reversal points for successful trading.
By understanding the nuances between Real SFP and Considerable SFP, and integrating this pattern with other technical analysis tools, traders can make more informed decisions and better manage their trading risks.

ThePawnAlgoThe Pawn Algo is a simple indicator that is useful for scalping in sync with a higher timeframe should only be use in clear trending markets.
What it does and How it does it?
The script is based of a simple pattern close above previous candle high means higher prices we can see it in a green bar. Close below previous candle low means lower prices we can see it in a red bar. Close inside previous candle range means price is going to consolidate do some kind of retracement or reversal we mark it in a black or dark color bar.
It plot an arrow and a liquidity level when it detects a change in sentiment from bullish to bearish or bearish to bullish.
It plot the Higher timeframe previous completed candle range into the selected Lower timeframe to easily see the HTF levels into the lower timeframe.
The HTF range change colors depending of previous HTF candles closes following the same idea, close above previous candle high means green range, close below previous candle low means red range and close inside means a gray range. Finally it plots the 50% of the HTF range and the previous close high and low.
Finally it draws a yellow value zone that is the difference between the previous candle close and 50% of the previous range. This zone is ideal for taking continuation trades in favor of the HTF trend.
How to use it?
You must first select a higher timeframe in minutes in the settings default value is 1440minutes then select a lower timeframe is the maximum timeframe in where the HTF will be visible. Default lower timeframe is 15minutes.
Then just wait for the HTF candle to close and engage in the LTF when price is around the value yellow zone in a premium or discount.
Green arrows are automatically plot when HTF is bullish and Red arrows when is bearish by default. But you can enable or disable the arrow signals liquidity levels or configure as you want. Making all signals visible or just the buys or sells.
The script is useful to easily identify the HTF draw on liquidity and recent key levels and then use the LTF structure to enter.
The indicator can be used to identify liquidity, price will seek this liquidity point sometimes sweep and then continue the move. if the liquidity or stop level is broken with a body is a clear change of direction.

Gold & EUR/USD LTF liquidity Sweep + Market structure shift on a lower time frame for sniper entries

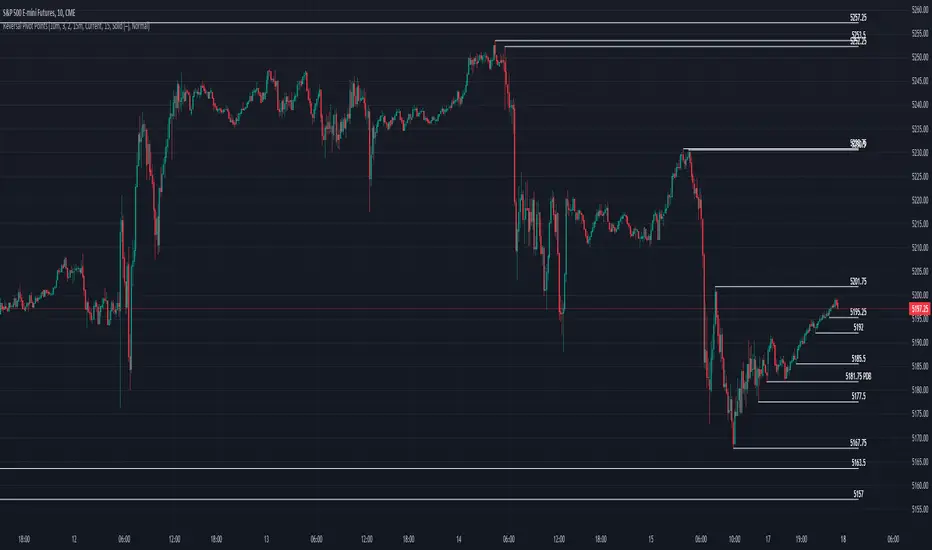
Reversal Pivot PointsThis indicator aims to identify price levels where price action has quickly reversed from. These "pivots" establish major levels where major liquidity is located. Unlike standard support and resistance levels, when price breaks below or above a pivot, these pivots disappear from the chart. Comes with various customization features built to fit all.
Features
Pivot Timeframe: Identify and plot pivots from one specific timeframe and see it from all lower timeframes
Pivot left/right bar limit: A feature aimed at preventing false pivots identification
Remove On Close (ROC): Feature to only remove pivots once price close under it
ROC Timeframe: The timeframe the script uses to determine if the candle closed under the level
Wait For Close: Will only remove the pivot after the current candle closes
Line Extension Type: The extension of the line. None - extends line to current time, left - only extends line to the left, right - only extends line to the right, both - extends line both directions
Line Offset: How much to offset (in bars) the line and label from the current candle
Line Type: The style of line when plotted. Solid (─), dotted (┈), dashed (╌), arrow left (←), arrow right (→), arrows both (↔)
Display Level: Whether to or not to display the price of the pivot
Display Perfect Level: Whether to or not to display levels where price perfectly rejected off of
Alerts: Creates an alert when a level has been crossed
How to trade
1. Pivots can be traded to or from. The stock market (market makers) will tend to "chase" liquidity in order to fill orders at better averages. This allows us retail traders to to participate alongside these moves to these pivots. Once price action hits a pivot, it can do two things: break the pivot and continue or bounce off it. We can participate alongside these bounces after confirmation of a reversal (doji, volume, etc). These bounce plays are high risk as it's generally 50-50, but the risk to reward is typically also very high, making them very valuable to take.
2. Typically, the market is a fluid environment and should be "natural," so perfect things (manmade and filled with liquidity) should not occur. With this knowledge, we can expect these perfect levels, "PDT/PDB," to break as they are not natural occurrence and have heavy liquidity on and above/below them. We can trade to these levels and expect them to break/sweep if price action comes near them again.
SMC Fake Zones + InsideBarThis indicator is useful for whom trade with "Smart Money Concept (SMC)" strategy.
It helps SMD traders to identify fake or weak zones in the chart, So they can avoid taking position in this zones.
This indicator marks "Asia session" as well as "London and New York's Lunch Time (one hour before London and NY session starts)" zones.
It also marks Inside Bar candles which SMC trades consider as order flow. You can mark every Inside Bar or only those with opposite color via setting options.
*** As we know in SMC rules
1- Supply and Demand zones in "Asia session and Lunch Times" are fake zones for SMC trading and price will engulf them in most of times.
2- "Asia session high and low" has huge liquidity and usually price sweep that in London session.
This indicator will helps traders to visually identify those Fake zones and Asia session liquidity.
* You can change session times based on your time zone in settings.
* You can set options to show all Inside Bars or only with Opposite color in settings.

Liquidity Concepts [BigBeluga]The Liquidity Concepts indicator is designed to represent the liquidity on the chart using pivot points as potential stop-losses / liquidity grabs.
The indicator is facilitated by a market structure detector and pivot points to identify resting liquidity / stop-loss levels.
A liquidity grab or a stop-loss hunt is when retail traders place their stop-loss orders at recent highs / most recent highs or lows. This is a spot where big players attempt to push the market to trigger all the stop-loss orders and gain a better entry in their favor.
🔶 CALCULATION
The indicator uses the Higher Lower script made by @LonesomeTheBlue to determine these pivot points. When a pivot point is formed, it is displayed on the chart with the corresponding symbol (HH - HL - LH - LL). When one of these points is broken, a line is drawn between the pivot point and the candle that broke it.
A liquidity grab is only recognized after it has occurred, and it is represented with a box showing all the candles that were involved in the sweep / stop-loss hunt.
A pivot point is established only after the selected lookback period and cannot be printed beforehand in any manner. This ensures that it captures the highest point within the lookback period following the candle formation.
An HL (Higher Low) point is established when it is lower than an HH (Higher High) point, whereas an LH (Lower High) point is established when it is higher than an LL (Lower Low) point.
Boxes are formed in two different types: Major and Minor.
- Major boxes occur when LH or HL points are breached, with their high or low point crossing above or below in the specific lookback period.
- Minor boxes occur when HH or LL points are breached, with their high or low point crossing above or below in the specific lookback period.
Minor points are less efficient since they represent key highs and lows, and before taking out those liquidity levels, the HL and LH points should be cleared.
Representation of Pivot Point Formation:
Liquidity wicks are a minor representation of a stop-loss hunt during the retracement of a pivot point. This means that a pivot point is broken only by the wick and not by the entire body.
Bigger wick = more liquidity
Lower wick = less liquidity
Liquidity wicks can be used as trade confirmation or targets for your entry to enhance accuracy.
Users have the option to display candle coloring based on the currently detected trend.
🔶 VERIFICATION
Users have the option to specify the verification length for when the liquidity should occur. This means that if the length is set to 7, the indicator will search for the liquidity formation within the last 7 candles; otherwise, it will be considered invalid.
🔶 CONCEPTS
The whole idea is to help find possible zone of stop loss hunting helping having a better entry in our trading, we can utilize a lot more tools, and this shoud be used as confluence only
🔶 OPTIONS
Users have complete control over the settings, allowing them to:
- Disable pivot points.
- Disable the display of boxes.
- Disable liquidity wicks.
- Customize colors to their preferences.
- Adjust lookback settings for historical data analysis.
- Modify candle coloring settings.
- Adjust the text size of labels for better readability and customization.
🔶 RECAP
Box => Represents liquidity formation / stop-loss hunt
- Minor Box HH / LL point
- Major Box LH / HL point
Liquidity Wicks => Formed when a pivot point is broken only by the wick
BOS / CHoCH => Calculated using the pivot points from the @LonesomeTheBlue script
🔶 RELATED SCRIPTS
Price Action Concepts =>

ICT HTF Liquidity Levels /w Alert [MsF]Japanese below / 日本語説明は英文の後にあります。
-------------------------
*This indicator is based on sbtnc's "HTF Liquidity Levels". It's a very cool indicator. thank you.
It has 3 functions: visualization of HTF liquidity (with alert), candle color change when displacement occurs, and MSB (market structure break) line display.
=== Function description ===
1. HTF liquidity (with alert)
Lines visualize the liquidity pools on the HTF bars. Alerts can be set for each TF's line.
Once the price reaches the line, the line is repaint.
To put it plainly, the old line disappears and a new line appears. The line that disappeared remains as a purged line. (It is also possible to hide the purged line with a parameter)
The alert will be triggered at the moment the line disappears. An alert will be issued when you touch the HTF's liquid pools where the loss is accumulated, so you can notice the stop hunting with the alert.
This alert is an original feature of this indicator.
The timeframe of the HTF can't modify. You can get Monthly, weekly, daily and H1 and H4.
Each timeframe displays the 3 most recent lines. By narrowing it down to 3, it is devised to make it easier to see visually. (This indicator original)
2. Displacement
Change the color display of the candlesticks when a bullish candle stick or bearish candle stick is attached. Furthermore, by enabling the "Require FVG" option, you can easily discover the FVG (Fair Value Gap). It is a very useful function for ICT trading.
3. MSB (market structure break)
Displays High/Low lines for the period specified by the parameter. It is useful for discovering BoS & CHoCH/MSS, which are important in ICT trading.
=== Parameter description ===
- HTF LIQUIDITY
- Daily … Daily line display settings (color, line width)
- Weekly … Weekly line display settings (color, line width)
- Monthly … Monthly line display settings (color, line width)
- INTRADAY LIQUIDITY
- 1H … 1H line display settings (color, line width)
- 4H … 4H line display settings (color, line width)
- PURGED LIQUIDITY … Display setting of the line once the candle reaches
- Show Purge Daily … Daily purged line display/non-display setting
- Show Purge Weekly … Weekly purged line display/non-display setting
- Show Purge Monthly … Monthly purged line display/non-display setting
- Show Purge 1H … 1H purged line display/non-display setting
- Show Purge 4H … 4H purged line display/non-display setting
- MARKET STRUCTURE BREAK - MBS
- Loopback … Period for searching High/Low
- DISPLACEMENT FOR FVG
- Require FVG … Draw only when FVG occurs
- Displacement Type … Displacement from open to close? or from high to low?
- Displacement Length … Period over which to calculate the standard deviation
- Displacement Strength … The larger the number, the stronger the displacement detected
-------------------------
このインジケータはsbtncさんの"HTF Liquidity Levels"をベースに作成しています。
上位足流動性の可視化(アラート付き)、変位発生時のローソク色変更、MSB(market structure break)ライン表示の3つの機能を有します。
<機能説明>
■上位足流動性の可視化
上位足の流動性の吹き溜まり(ストップが溜まっているところ)をラインで可視化します。ラインにはアラートを設定することが可能です。
一度価格がラインに到達するとそのラインは再描画されます。
平たく言うと、今までのラインが消えて新しいラインが出現する。という事です。
消えたラインはpurgeラインとして残ります。(パラメータでpurgeラインを非表示にすることも可能です)
アラートはラインが消える瞬間に発報します。上位足の損切り溜まってるところにタッチするとアラートを発報するので、アラートにてストップ狩りに気づくことができます。
このアラート発報については本インジケータオリジナルの機能となります。
表示可能な上位足のタイムフレームは固定です。月足、週足、日足およびH1とH4を表示することができます。
各タイムフレーム、直近から3つのラインを表示します。3つに絞ることで視覚的に見やすく工夫しています。(本インジケータオリジナル)
■変位発生時のローソク色変更
大きな陽線、陰線を付けた場合に、そのローソク足をカラー表示を変更します。
さらに"Require FVG"オプションを有効にすることで、FVG(Fair Value Gap)を容易に発見することができます。ICTトレードにを行うにあたり大変有用な機能となっています。
■MSB(market structure break)ライン表示
パラメータで指定した期間のHigh/Lowをライン表示します。ICTトレードで重要視しているBoS & CHoCH/MSSの発見に役立ちます。
<パラメータ説明>
- HTF LIQUIDITY
- Daily … 日足ライン表示設定(色、線幅)
- Weekly … 週足ライン表示設定(色、線幅)
- Monthly … 月足ライン表示設定(色、線幅)
- INTRADAY LIQUIDITY
- 1H … 1時間足ライン表示設定(色、線幅)
- 4H … 4時間足ライン表示設定(色、線幅)
- PURGED LIQUIDITY … 一度到達したラインの表示設定
- Show Purge Daily … 日足ライン表示/非表示設定
- Show Purge Weekly … 週足ライン表示/非表示設定
- Show Purge Monthly … 月足ライン表示/非表示設定
- Show Purge 1H … 1時間足ライン表示/非表示設定
- Show Purge 4H … 4時間足ライン表示/非表示設定
- MARKET STRUCTURE BREAK - MBS
- Loopback … High/Lowを探索する期間
- DISPLACEMENT FOR FVG
- Require FVG … FVG発生時のみ描画する
- Displacement Type … openからcloseまでの変位か?highからlowまでの変位か?
- Displacement Length … 標準偏差を計算する期間
- Displacement Strength … 変位の強さ(数字が大きいほど強い変位を検出)

Rounded Forex Levels: Big-Figure, Mid-Figure, 80-20 levels, BFRNSimple indicator to show Rounded levels in typical Forex pairs: Big figure, Mid-figure, 80-20 Insitutional Levels, 10pip levels, 5pip levels
Wrote this indicator because other ones out there seem to clutter the chart. This is simple, low-clutter and can be set by user to have arbitrary start and end points for the lines.
I wanted the ability for lines to plot discreetly to the right hand side of price as in the chart above, since in my opinion, these are only of secondary consideration to a trader, an extra confirmation/confluence to an existing idea.
//Purpose & Usage:
-Big-figure levels (100pips) & Mid-figure levels (50pips) will have a senstitivity to price, that can be an additional tool when looking for confluence for a target or an entry.
-As well as BF levels and MF levels; Institutional levels (20pips below and 20 pips above a Big Figure level) and standard 10pip or 5pip levels, can be useful in the right context (i.e added confirmation that of a minor sweep target; added conviction in an idea if the level aligns with another seperately derived level).
//User inputs:
-Toggle on/off each of the types of level.
-Line spacing: choose pip spacing of lines .
-Number of lines above/below (i.e. setting of 5 will be 11 lines. One central, 5 above, 5 below).
-Formatting: for each class of lines, code by color, style and width (as per the example chart below).
-Line start offset and line end offset: bars forward/back for each of start point and end point. So lines could be spread right across chart; or neatly pushed to the far right or left of the chart.
//Notes:
-Designed for typical Forex pairs with units close to 1.0 (like Eur/Usd, Usd/Cad, Aud/Usd, Gbp/Usd, Eur/Gbp, Nzd/Usd).
-Lines are based from the rounded close of the previous bar, Updating (if applicable) on each new bar.
Demo Plotting levels in the past; Dialog box example display:

Liquidity Candles with Prev Day High/Low and Midnight OpenAlright, let's talk about how to use this fancy indicator. But first, let me warn you, using indicators is like driving a car, you can't just press the gas pedal and hope for the best. You need to know what you're doing, or else you'll crash and burn faster than a soufflé in a microwave.
Now, let's get started. The first thing you need to do is understand what this indicator is telling you. Think of it like a signalman at a train station. He's waving flags and giving hand signals to tell you whether it's safe to proceed or if you need to stop and wait. This indicator works the same way.
It's going to give you signals based on price movements, telling you whether it's safe to buy or sell. But don't get too excited, my friend. You still need to use your brain and make smart decisions. Don't just blindly follow the signals, or else you'll end up like a sheep being led to the slaughter.
Now, let's talk about some of ICT's smart money trading concepts. First up, we have "liquidity grabs". This is when the big boys in the market create false breakouts to shake out the weak hands. They're like school bullies stealing lunch money from the little kids. But you can avoid being a victim by watching for signs of a liquidity grab, and using your brain to decide whether it's a real breakout or just a trap.
Next up, we have "stop runs". This is when the big players purposely trigger stop-loss orders to get a better entry or exit. It's like a game of chicken, but with your money on the line. To avoid being run over, keep an eye on your stop-loss orders, and don't be too predictable in your trading.
Finally, we have "market structure". This is like the blueprint of the market, showing you where the support and resistance levels are. It's like a treasure map to finding the best trades. But don't forget that market structure can change over time, so keep updating your map and stay ahead of the game.
So there you have it, my friend. A quick tutorial on using this indicator, with a side of ICT's smart money trading concepts. But remember, indicators are just tools, and you're the one driving the car. Use your brain, stay alert, and don't be a sheep. Happy trading!
Divergent Trades LLC:
Disclaimer: The information provided by the Divergent Trades LLC indicator is for educational and informational purposes only. It should not be considered financial advice or a recommendation to buy, sell, or trade any financial instrument. Divergent Trades LLC is not responsible for any losses incurred as a result of using this indicator. Trading in the financial markets carries a high level of risk and may not be suitable for all investors. Before making any investment decisions, please consult with a financial advisor and do your own due diligence. Past performance is not indicative of future results. By using the Divergent Trades LLC indicator, you acknowledge that you have read and understand this disclaimer and agree to its terms and conditions.

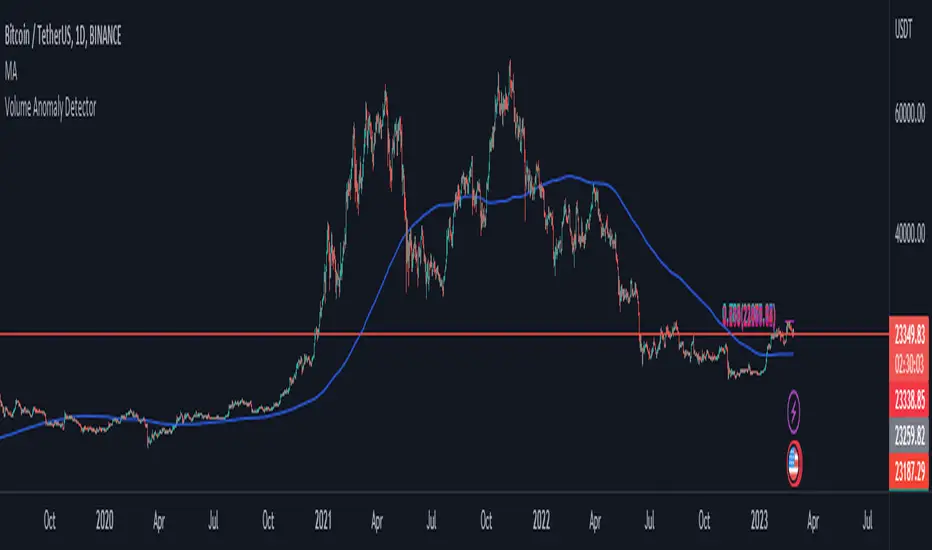
Volume Anomaly DetectorThis indicator is designed to detect volume anomalies such as block orders, large institutional orders, and sweep orders. It works by comparing the current volume to the moving average of volume and identifying deviations that exceed a specified threshold. By detecting anomalous volume, it can help traders identify potential market-moving events and anticipate changes in price direction.
One key difference between this indicator and others is its focus on volume anomalies rather than just overall volume or price movements. This can provide traders with additional insights into market conditions and help them identify trading opportunities that may not be visible using other indicators.
In terms of timeframe and market conditions, this indicator can be used on any timeframe and in any market where volume data is available. However, it may be particularly useful in markets with high liquidity and significant institutional participation, such as equities and futures markets. It may also be most effective during periods of heightened volatility or when significant news or events are expected to impact the market. As with any trading indicator, it's important to use it in conjunction with other tools and analysis to confirm signals and make informed trading decisions.
Mark LevelsMark Levels is marking liquidity pools by drawing lines on their pivots and labelling them so that you can instantly detect them on your realtime chart
It supports:
- marking previous and current day lows and highs
- marking previous and current week lows and highs
- marking previous and current month lows and highs
- marking equal lows and highs
technically it re-builds them on the last bar or as soon as new realtime bar is updated. it looks with 1k bars back to find higher timeframe ranges and find lows and highs there
Adjustments:
- changing the line style of the group
- changing the lines color and the labels on the groups
- currently pools are split on 2 groups Period Liquidity and Equal Pivots Liquidity.
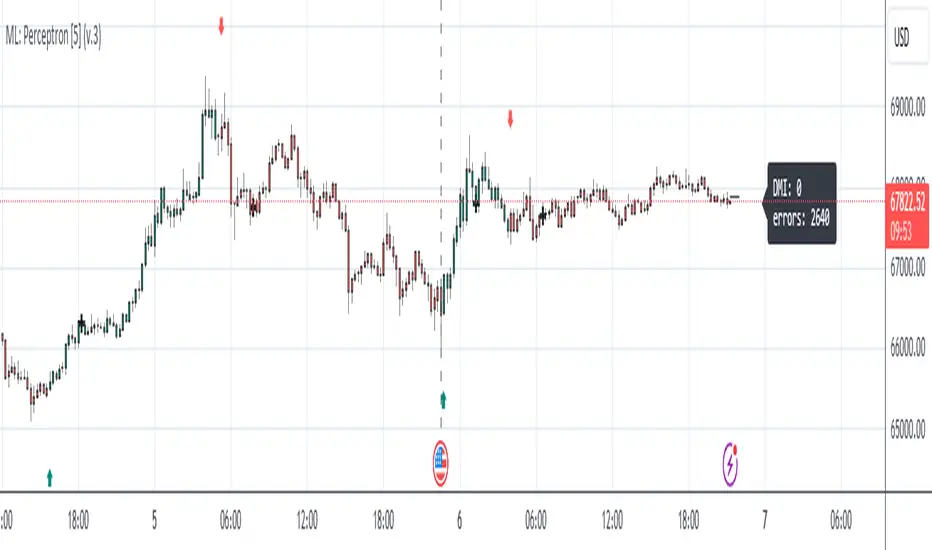
Machine Learning: Perceptron-based strategyPerceptron-based strategy
Description:
The Learning Perceptron is the simplest possible artificial neural network (ANN), consisting of just a single neuron and capable of learning a certain class of binary classification problems. The idea behind ANNs is that by selecting good values for the weight parameters (and the bias), the ANN can model the relationships between the inputs and some target.
Generally, ANN neurons receive a number of inputs, weight each of those inputs, sum the weights, and then transform that sum using a special function called an activation function. The output of that activation function is then either used as the prediction (in a single neuron model) or is combined with the outputs of other neurons for further use in more complex models.
The purpose of the activation function is to take the input signal (that’s the weighted sum of the inputs and the bias) and turn it into an output signal. Think of this activation function as firing (activating) the neuron when it returns 1, and doing nothing when it returns 0. This sort of computation is accomplished with a function called step function: f(z) = {1 if z > 0 else 0}. This function then transforms any weighted sum of the inputs and converts it into a binary output (either 1 or 0). The trick to making this useful is finding (learning) a set of weights that lead to good predictions using this activation function.
Training our perceptron is simply a matter of initializing the weights to zero (or random value) and then implementing the perceptron learning rule, which just updates the weights based on the error of each observation with the current weights. This has the effect of moving the classifier’s decision boundary in the direction that would have helped it classify the last observation correctly. This is achieved via a for loop which iterates over each observation, making a prediction of each observation, calculating the error of that prediction and then updating the weights accordingly. In this way, weights are gradually updated until they converge. Each sweep through the training data is called an epoch.
In this script the perceptron is retrained on each new bar trying to classify this bar by drawing the moving average curve above or below the bar.
This script was tested with BTCUSD, USDJPY, and EURUSD.
Note: TradingViews's playback feature helps to see this strategy in action.
Warning: Signals ARE repainting.
Style tags: Trend Following, Trend Analysis
Asset class: Equities, Futures, ETFs, Currencies and Commodities
Dataset: FX Minutes/Hours+/Days
888 BOT #alerts█ 888 BOT #alerts (open source)
This is an Expert Advisor 'EA' or Automated trading script for ‘longs’ and ‘shorts’, which uses only a Take Profit or, in the worst case, a Stop Loss to close the trade.
It's a much improved version of the previous ‘Repanocha’. It doesn`t use 'Trailing Stop' or 'security ()' functions (although using a security function doesn`t mean that the script repaints) and all signals are confirmed, therefore the script doesn`t repaint in alert mode and is accurate in backtest mode.
Apart from the previous indicators, some more and other functions have been added for Stop-Loss, re-entry and leverage.
It uses 8 indicators, (many of you already know what they are, but in case there is someone new), these are the following:
1. Jurik Moving Average
It's a moving average created by Mark Jurik for professionals which eliminates the 'lag' or delay of the signal. It's better than other moving averages like EMA , DEMA , AMA or T3.
There are two ways to decrease noise using JMA . Increasing the 'LENGTH' parameter will cause JMA to move more slowly and therefore reduce noise at the expense of adding 'lag'
The 'JMA LENGTH', 'PHASE' and 'POWER' parameters offer a way to select the optimal balance between 'lag' and over boost.
Green: Bullish , Red: Bearish .
2. Range filter
Created by Donovan Wall, its function is to filter or eliminate noise and to better determine the price trend in the short term.
First, a uniform average price range 'SAMPLING PERIOD' is calculated for the filter base and multiplied by a specific quantity 'RANGE MULTIPLIER'.
The filter is then calculated by adjusting price movements that do not exceed the specified range.
Finally, the target ranges are plotted to show the prices that will trigger the filter movement.
Green: Bullish , Red: Bearish .
3. Average Directional Index ( ADX Classic) and ( ADX Masanakamura)
It's an indicator designed by Welles Wilder to measure the strength and direction of the market trend. The price movement is strong when the ADX has a positive slope and is above a certain minimum level 'ADX THRESHOLD' and for a given period 'ADX LENGTH'.
The green color of the bars indicates that the trend is bullish and that the ADX is above the level established by the threshold.
The red color of the bars indicates that the trend is down and that the ADX is above the threshold level.
The orange color of the bars indicates that the price is not strong and will surely lateralize.
You can choose between the classic option and the one created by a certain 'Masanakamura'. The main difference between the two is that in the first it uses RMA () and in the second SMA () in its calculation.
4. Parabolic SAR
This indicator, also created by Welles Wilder, places points that help define a trend. The Parabolic SAR can follow the price above or below, the peculiarity that it offers is that when the price touches the indicator, it jumps to the other side of the price (if the Parabolic SAR was below the price it jumps up and vice versa) to a distance predetermined by the indicator. At this time the indicator continues to follow the price, reducing the distance with each candle until it is finally touched again by the price and the process starts again. This procedure explains the name of the indicator: the Parabolic SAR follows the price generating a characteristic parabolic shape, when the price touches it, stops and turns ( SAR is the acronym for 'stop and reverse'), giving rise to a new cycle. When the points are below the price, the trend is up, while the points above the price indicate a downward trend.
5. RSI with Volume
This indicator was created by LazyBear from the popular RSI .
The RSI is an oscillator-type indicator used in technical analysis and also created by Welles Wilder that shows the strength of the price by comparing individual movements up or down in successive closing prices.
LazyBear added a volume parameter that makes it more accurate to the market movement.
A good way to use RSI is by considering the 50 'RSI CENTER LINE' centerline. When the oscillator is above, the trend is bullish and when it is below, the trend is bearish .
6. Moving Average Convergence Divergence ( MACD ) and ( MAC-Z )
It was created by Gerald Appel. Subsequently, the histogram was added to anticipate the crossing of MA. Broadly speaking, we can say that the MACD is an oscillator consisting of two moving averages that rotate around the zero line. The MACD line is the difference between a short moving average 'MACD FAST MA LENGTH' and a long moving average 'MACD SLOW MA LENGTH'. It's an indicator that allows us to have a reference on the trend of the asset on which it is operating, thus generating market entry and exit signals.
We can talk about a bull market when the MACD histogram is above the zero line, along with the signal line, while we are talking about a bear market when the MACD histogram is below the zero line.
There is the option of using the MAC-Z indicator created by LazyBear, which according to its author is more effective, by using the parameter VWAP ( volume weighted average price ) 'Z-VWAP LENGTH' together with a standard deviation 'STDEV LENGTH' in its calculation.
7. Volume Condition
Volume indicates the number of participants in this war between bulls and bears, the more volume the more likely the price will move in favor of the trend. A low trading volume indicates a lower number of participants and interest in the instrument in question. Low volumes may reveal weakness behind a price movement.
With this condition, those signals whose volume is less than the volume SMA for a period 'SMA VOLUME LENGTH' multiplied by a factor 'VOLUME FACTOR' are filtered. In addition, it determines the leverage used, the more volume , the more participants, the more probability that the price will move in our favor, that is, we can use more leverage. The leverage in this script is determined by how many times the volume is above the SMA line.
The maximum leverage is 8.
8. Bollinger Bands
This indicator was created by John Bollinger and consists of three bands that are drawn superimposed on the price evolution graph.
The central band is a moving average, normally a simple moving average calculated with 20 periods is used. ('BB LENGTH' Number of periods of the moving average)
The upper band is calculated by adding the value of the simple moving average X times the standard deviation of the moving average. ('BB MULTIPLIER' Number of times the standard deviation of the moving average)
The lower band is calculated by subtracting the simple moving average X times the standard deviation of the moving average.
the band between the upper and lower bands contains, statistically, almost 90% of the possible price variations, which means that any movement of the price outside the bands has special relevance.
In practical terms, Bollinger bands behave as if they were an elastic band so that, if the price touches them, it has a high probability of bouncing.
Sometimes, after the entry order is filled, the price is returned to the opposite side. If price touch the Bollinger band in the same previous conditions, another order is filled in the same direction of the position to improve the average entry price, (% MINIMUM BETTER PRICE ': Minimum price for the re-entry to be executed and that is better than the price of the previous position in a given %) in this way we give the trade a chance that the Take Profit is executed before. The downside is that the position is doubled in size. 'ACTIVATE DIVIDE TP': Divide the size of the TP in half. More probability of the trade closing but less profit.
█ STOP LOSS and RISK MANAGEMENT.
A good risk management is what can make your equity go up or be liquidated.
The % risk is the percentage of our capital that we are willing to lose by operation. This is recommended to be between 1-5%.
% Risk: (% Stop Loss x % Equity per trade x Leverage) / 100
First the strategy is calculated with Stop Loss, then the risk per operation is determined and from there, the amount per operation is calculated and not vice versa.
In this script you can use a normal Stop Loss or one according to the ATR. Also activate the option to trigger it earlier if the risk percentage is reached. '% RISK ALLOWED' wich is calculated according with: '%EQUITY ON EACH ENTRY'. Only works with Stop Loss on 'NORMAL' or 'BOTH' mode.
'STOP LOSS CONFIRMED': The Stop Loss is only activated if the closing of the previous bar is in the loss limit condition. It's useful to prevent the SL from triggering when they do a ‘pump’ to sweep Stops and then return the price to the previous state.
█ ALERTS
There is an alert for each leverage, therefore a maximum of 8 alerts can be set for 'long' and 8 for 'short', plus an alert to close the trade with Take Profit or Stop Loss in market mode. You can also place Take Profit limit and Stop Loss limit orders a few seconds after filling the position entry order.
- 'MAXIMUM LEVERAGE': It is the maximum allowed multiplier of the % quantity entered on each entry for 1X according to the volume condition.
- 'ADVANCE ALERTS': There is always a time delay from when the alert is triggered until it reaches the exchange and can be between 1-15 seconds. With this parameter, you can advance the alert by the necessary seconds to activate it earlier. In this way it can be synchronized with the exchange so that the execution time of the entry order to the position coincides with the opening of the bar.
The settings are for Bitcoin at Binance Futures (BTC: USDTPERP) in 15 minutes.
For other pairs and other timeframes, the settings have to be adjusted again. And within a month, the settings will be different because we all know the market and the trend are changing.
