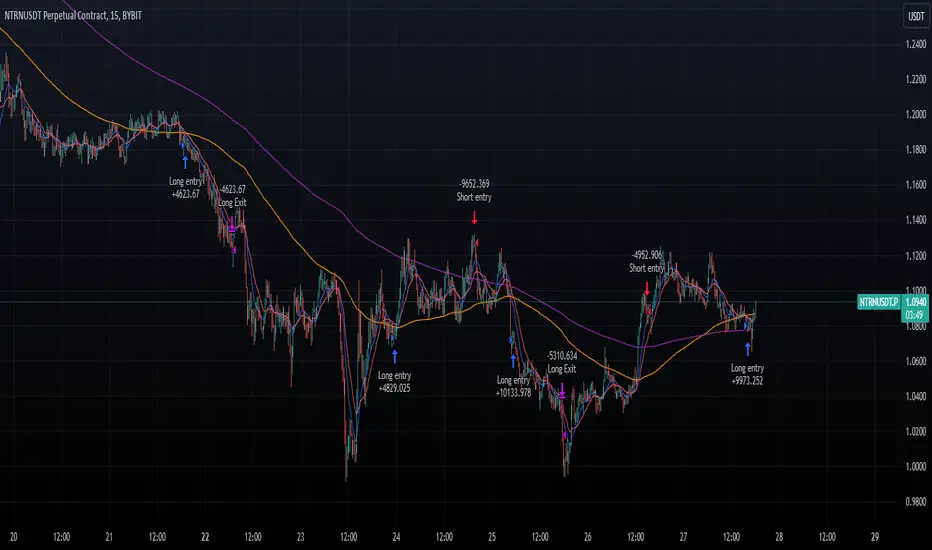
Four WMA Strategy with TP and SLBasically I read a research paper on how they used different moving averages for long entries and short entries, and it kind of dawned on me that I always used the same one for long entry or exit, or even swing trading. So I smashed this together to see what would happen.
The strategy combines the use of four different WMAs for identifying trade entry points, along with a predefined take profit (TP) and stop loss (SL) for risk management. Here's a detailed description of its features and how it operates:
Main Features
1. **WMAs as the Core Indicator**:
- The strategy uses four WMAs with different lengths. Two WMAs (`longM1` and `longM2`) are used for long entry signals, and the other two (`shortM1` and `shortM2`) for short entry signals.
- The lengths of these WMAs are adjustable through input parameters.
2. **Trade Entry Conditions**:
- A long entry is signaled when the shorter WMA crosses under the longer WMA .
- Conversely, a short entry is signaled when the shorter WMA crosses under the longer WMA.
3. **Take Profit and Stop Loss**:
- The strategy includes a take profit and stop loss mechanism.
- The TP and SL levels are set as a percentage of the entry price, with the percentage values being adjustable through input parameters.
4. **Visual Representation**:
- The WMAs are plotted on the chart for visual aid, each with a distinct color for easy identification.
How It Works
- The strategy continuously monitors the crossing of WMAs to detect potential entry points for long and short positions.
- Upon detecting a long or short condition, it automatically enters a trade and sets the corresponding TP and SL levels based on the current price and the specified percentages.
- The strategy then actively manages the trade, exiting the position when either the TP or SL level is reached.
Drawbacks
- **Overreliance on WMAs**: The strategy heavily relies on WMAs for trade signals. While WMAs are useful for identifying trends, they might not always provide timely entry and exit signals.
- **Market Conditions**: It may not perform well in highly volatile or sideways markets where WMA crossovers could lead to false signals.
- **Risk Management**: The fixed percentage for TP and SL might not be suitable for all market conditions. Traders might need to adjust these values frequently based on market volatility and their risk tolerance.
Apparently I need to emphasize to use brains when using indicators and setting them up to achieve the results you can or want. Also risk of 12% is considered very high so I lowered the numbers to 5%, which tanked the profits, try adjusting them on your own. Check the properties settings for more info on comission and slippage.
Conclusion
The "Four WMA Strategy with TP and SL" is suitable for traders who prefer a moving average-based approach to trading, combined with a straightforward mechanism for risk management through take profit and stop loss. However, like all strategies, it should be used with an understanding of its limitations and ideally tested thoroughly in various market conditions before applying it to live trading.
Search in scripts for "swing trading"
RMB - High and LowDescription:
Introducing the "RMB - High and Low" indicator, a versatile and powerful tool designed for traders who seek a comprehensive view of the market across multiple time frames. This indicator is tailored to identify and display key support and resistance levels, adapting to your chosen time frame - from as short as 15 minutes to as long as a week.
Key Features:
Multi-Time Frame Flexibility : Easily switch between 15 minutes, 30 minutes, 1 hour, 2 hours, 4 hours, daily, and weekly time frames to align with your trading strategy and market analysis.
Dynamic Support and Resistance Levels : The indicator plots the highest high (resistance) and the lowest low (support) for the selected time frame, providing real-time insights into market behavior and potential pivot points.
Time Frame-Specific Labels : Each resistance and support line is labeled with the corresponding time frame, offering a clear and immediate reference, enhancing your chart analysis and decision-making process.
User-Friendly Interface : A simple and intuitive input interface allows for quick adjustments, making it easy to toggle between different time frames based on your trading needs.
Visual Clarity : Designed with distinct color coding - green for resistance and red for support - ensuring that key levels are easily identifiable at a glance.
Ideal Use Cases:
Day Trading: Utilize shorter time frames to capture quick market movements and identify intraday pivot points.
Swing Trading: Leverage longer time frames to understand broader market trends and establish entry and exit points.
Diverse Strategies: Whether you're scalping, trend following, or employing mean reversion tactics, adapt the indicator to fit your unique approach.
Conclusion:
The "RMB - High and Low" indicator is a must-have tool for traders who demand flexibility and precision in their technical analysis. By offering insights across various time frames, this indicator empowers you to make well-informed decisions, adapt to market changes swiftly, and enhance your trading performance.

Hedge Coin M - Statistical Support and ResistanceHedge Coin M - Statistical Support and Resistance
Introduction
"Hedge Coin M - Statistical Support and Resistance" is a sophisticated, statistically-driven indicator designed specifically for traders in the COIN-M market on Binance. It offers a nuanced approach to identifying key market levels, focusing on the dynamics of support and resistance through advanced volatility analysis.
Foundation and Credits:
This script is an advanced adaptation of TradingView's standard code for the Bollinger Bands indicator. It extends the foundational concept of Bollinger Bands by integrating additional volatility metrics.
Calculation Method
This indicator employs Volume Weighted Moving Averages (VWMA) to create two distinct sets of Bollinger Bands, named BB-a and BB-b.
BB-a is derived from the VWMA of high prices, targeting potential resistance levels.
BB-b is based on the VWMA of low prices, aimed at identifying critical support levels.
Users can independently adjust the standard deviation (SD) multipliers for the upper and lower bands of both BB-a and BB-b, accommodating different market conditions.
Enhanced Volatility Analysis
The indicator calculates additional standard deviation lines for the upper band of BB-a and the lower band of BB-b. These lines provide deeper insights into market volatility.
Plotted Graphs
The primary plots include the upper and lower bands of BB-a and BB-b, marked in distinct colors for clarity.
Additional SD lines are plotted to indicate potential extended levels of support and resistance, offering traders a broader view of possible market movements.
Purpose and Usage
"Hedge Coin M - Statistical Support and Resistance" is designed to provide traders with a consistent, statistical method for identifying significant price levels.
It aids in scaling entry into positions, helping traders to navigate the COIN-M market with more informed decision-making.
This tool is especially useful for traders who combine long-term holding with swing trading strategies, offering a balanced approach to market engagement.
Integration and Adaptation
Easily integrate this indicator into your TradingView chart for the COIN-M market.
Use the insights provided to complement your overall trading strategy, particularly in identifying and reacting to significant market movements.
Disclaimer
Important Note: This indicator is provided for informational purposes only. It does not constitute financial advice, investment advice, trading advice, or any other sort of advice. Trading decisions should be made based on your own analysis, prudence, and judgment. Please be aware of the risks involved in trading and consult a financial advisor if necessary.

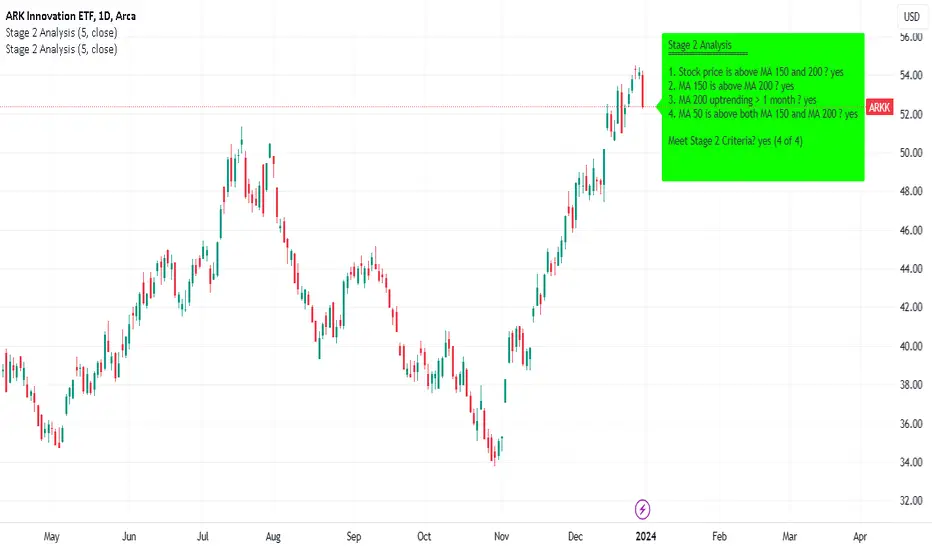
Minervini Stage 2 AnalysisHandbook for Minervini Stage 2 Analysis Indicator
Introduction
This handbook provides detailed instructions and guidelines for using the Minervini Stage 2 Analysis Indicator based on Mark Minervini's swing trading methodology. This indicator is designed for traders focusing on US stocks, aiming to capture gains in medium to short-term uptrends (swing trading).
Understanding Stage 2
Stage 2 represents a bullish uptrend in a stock's price. Mark Minervini emphasizes entering long positions during this phase. The stage is identified using four key criteria related to moving averages (MAs).
Indicator Criteria
Stock Price Above MA 150 and 200: Indicates an overall uptrend.
MA 150 Above MA 200: Signals a stronger medium-term trend compared to the long-term trend.
MA 200 Trending Up for At Least 1 Month (22 Days): Confirms a stable uptrend.
MA 50 Above Both MA 150 and 200: Shows short-term strength and momentum.
Using the Indicator
Entering Trades: Consider long positions when all four criteria are met. This signifies that the stock is in a Stage 2 uptrend.
Monitoring Trades: Regularly check if the stock continues to meet these criteria. The indicator provides a clear visual and textual representation for ease of monitoring.
Alarm Signals and Exit Strategy
One Criterion Not Met: This serves as an alarm signal. Increased vigilance is required, and traders should prepare for a potential exit.
Two Criteria Not Met: Strong indication to close the trade. This suggests the stock may be transitioning out of Stage 2, increasing the risk of holding the position.
Risk Management
Stop-Loss Orders: Consider setting a trailing stop-loss to protect profits and minimize losses.
Position Sizing: Adjust position sizes according to your risk tolerance and portfolio strategy.
Volume and Relative Strength Analysis
Volume Analysis: Look for increased trading volume as confirmation when the stock price moves above key MAs.
Relative Strength (RS) Rating: Compare the stock's performance to the broader market to gauge its strength.
Limitations and Considerations
Market Conditions: The indicator's effectiveness may vary with market conditions. It is more reliable in a bullish market environment.
Supplementary Analysis: Combine this indicator with other analysis methods (fundamental, technical) for a holistic approach.
Continuous Learning: Stay updated with market trends and adjust your strategy accordingly.
Conclusion
The Minervini Stage 2 Analysis Indicator is a powerful tool for identifying potential long positions in uptrending stocks. Its reliance on specific criteria aligns with Mark Minervini's proven swing trading strategy. However, always exercise due diligence and risk management in your trading decisions.
Mean Reversion with Incremental Entry by HedgerLabsThe "Mean Reversion with Incremental Entry" strategy, designed by HedgerLabs, is an advanced TradingView strategy script focusing on the mean reversion technique in financial markets. This strategy is engineered for traders who prefer a systematic approach with an emphasis on incremental entries based on price movements relative to a moving average.
Key Features:
Moving Average Based Strategy: Central to this strategy is the simple moving average (SMA), around which all trade entries and exits revolve. Traders can customize the MA length, making it flexible for various trading styles and timeframes.
Incremental Entry Mechanism: Unique to this strategy is the incremental entry system. The strategy initiates an initial trade when the price deviates from the MA by a specified percentage. Subsequent entries are made at incremental steps, defined by the trader, as the price moves further away from the MA. This method can potentially capitalize on increasing market volatility.
Dynamic Position Management: The strategy intelligently manages positions by entering long when the price is below the MA and short when above, allowing for adaptive positioning in different market conditions.
Automated Exit Logic: Exit points are determined when the price touches the MA, aiming to close positions at potential reversal points for optimized trade outcomes.
Continuous Market Analysis: With 'calc_on_every_tick' enabled, the strategy constantly evaluates market conditions, ensuring prompt reaction to price movements.
Usage Scenario:
This strategy is particularly beneficial in markets exhibiting mean-reverting behavior. It is suitable for traders focusing on swing trading or those who prefer to scale into positions during periods of high volatility.
Disclaimer:
Please remember that this strategy is for informational and educational purposes only and is not intended as financial or investment advice. Trading in financial markets carries risks, including the potential loss of capital. We advise doing your own research and consulting with a financial expert before making any investment decisions.

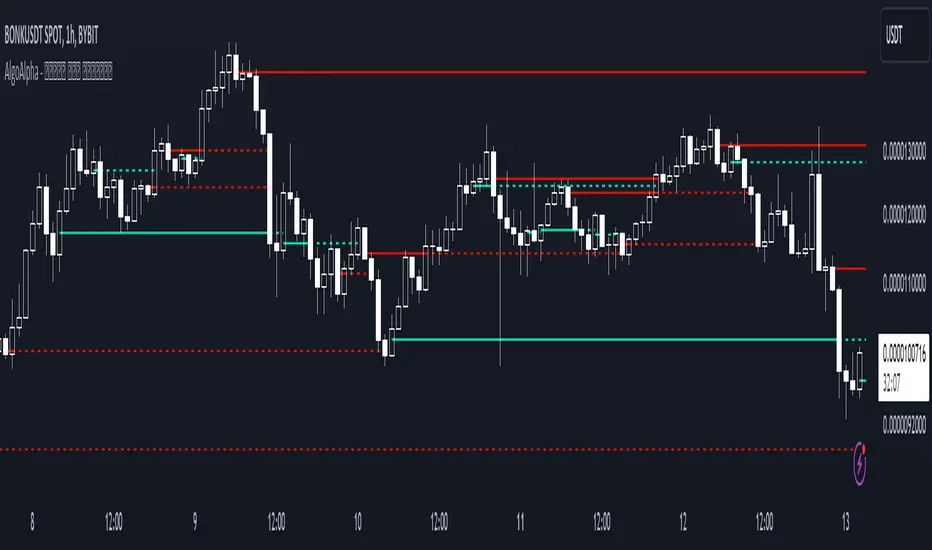
Peak & Valley Levels [AlgoAlpha]The Peak & Valley Levels indicator is a sophisticated script designed to pinpoint key support and resistance levels in the market. By utilizing candle length and direction, it accurately identifies potential reversal points, offering traders valuable insights for their strategies.
Core Components:
Peak and Valley Detection: The script recognizes peaks and valleys in price action. Peaks (potential resistance levels) are identified when a candle is longer than the previous one, changes direction, and closes lower, especially on lower volume. Valleys (potential support levels) are detected under similar conditions but with the candle closing higher.
Color-Coded Visualization:
Red lines mark resistance levels, signifying peaks in the price action.
Green lines indicate support levels, representing valleys.
Dynamic Level Adjustment: The script adapts these levels based on ongoing market movements, enhancing their relevance and accuracy.
Rejection Functions:
Bullish Rejection: Determines if a candlestick pattern rejects a level as potential support.
Bearish Rejection: Identifies if a pattern rejects a level as possible resistance.
Usage and Strategy Integration:
Visual Aid for Support and Resistance: The indicator is invaluable for visualizing key market levels where price reversals may occur.
Entry and Exit Points: Traders can use the identified support and resistance levels to fine-tune entry and exit points in their trading strategies.
Trend Reversal Signals: The detection of peaks and valleys serves as an early indicator of potential trend reversals.
Application in Trading:
Versatile for Various Trading Styles: This indicator can be applied across different trading styles, including swing trading, scalping, or trend-following approaches.
Complementary Tool: For best results, it should be used alongside other technical analysis tools to confirm trading signals and strategies.
Customization and Adaptability: Traders are encouraged to experiment with different settings and timeframes to tailor the indicator to their specific trading needs and market conditions.
In summary, the Peak & Valley Levels by AlgoAlpha is a dynamic and adaptable tool that enhances a trader’s ability to identify crucial market levels. Its integration of candlestick analysis with dynamic level adjustment offers a robust method for spotting potential reversal points, making it a valuable addition to any trader's toolkit.
Dynamic Trend Fusion (DTF)The "Dynamic Trend Fusion" (DTF) indicator is a powerful technical analysis tool for traders. It stands out from other indicators due to its adaptability and ability to provide insights into different trading styles. Users can choose from various trading options such as "Short-term Trading," "Long-term Trading," "Aggressive Short-term," "Conservative Long-term," "Balanced Approach," "High Sensitivity," "Low Sensitivity," "Day Trading," and "Swing Trading." These options allow traders to customize the indicator to suit their specific trading strategies.
DTF combines the Moving Average Convergence Divergence (MACD) and Relative Strength Index (RSI) indicators, normalizing them to a similar scale for a comprehensive view of market conditions. It then calculates a combined value and smoothes it using a moving average.
One of its standout features is the ability to identify bullish and bearish states, which is represented visually on the chart. When the indicator detects a transition from a bullish to a bearish state or vice versa, the color of the line changes.
Additionally, DTF offers alert conditions, notifying users when the market shifts into a bullish or bearish state, allowing for timely decision-making.
In summary, the DTF indicator sets itself apart by providing traders with a versatile tool that can be tailored to various trading styles and offers clear visual signals for trend changes, enhancing trading precision and efficiency.

Nitin Swing TradingThis is a CPR which indicates pivot points based on monthly price action.
The Orange line acts as a resistance area, blue lines act as pivot point/CPR and green one is support.
One can study retrospective chart to analyse how market has respected these Support and Resistance levels.
A guide on how to trade using this indicator?
1. If you see the resistance is broken after multiple attempt - We can Go Long
2.If you see price going down below CPR, We can Go Short
3.If you see price taking support at support level - We can Go Long.
Risk reward should always be 1:1 then gradually increase it to 1:2 & 1:3
It is advised to consult with your financial advisor before taking any trade just based on any indicator. You have to manage risk before entering any trade.

Trend Correlation HeatmapHello everyone!
I am excited to release my trend correlation heatmap, or trend heatmap for short.
Per usual, I think its important to explain the theory before we get into the use of the indicator, so let's get into the theory!
The theory:
So what is a correlation?
Correlation is the relationship one variable has to another. Correlations are the basis of everything I do as a quantitative trader. From the correlation between the same variables (i.e. autocorrelation), the correlation between other variables (i.e. VIX and SPY, SPY High and SPY Low, DXY and ES1! close, etc.) and, as well, the correlation between price and time (time series correlation).
This may sound very familiar to you, especially if you are a user, observer or follower of my ideas and/or indicators. Ninety-five percent of my indicators are a function of one of those three things. Whether it be a time series based indicator (i.e.my time series indicator), whether it be autocorrelation (my autoregressive cloud indicator or my autocorrelation oscillator) or whether it be regressive in nature (i.e. my SPY Volume weighted close, or even my expected move which uses averages in lieu of regressive approaches but is foundational in regression principles. Or even my VIX oscillator which relies on the premise of correlations between tickers.) So correlation is extremely important to me and while its true I am more of a regression trader than anything, I would argue that I am more of a correlation trader, because correlations are the backbone of how I develop math models of stocks.
What I am trying to stress here is the importance of correlations. They really truly are foundational to any type of quantitative analysis for stocks. And as such, understanding the current relationship a stock has to time is pivotal for any meaningful analysis to be conducted.
So what is correlation to time and what does it tell us?
Correlation to time, otherwise known and commonly referred to as "Time Series", is the relationship a ticker's price has to the passing of time. It is displayed in the traditional Pearson Correlation Coefficient or R value and can be any value from -1 (strong negative relationship, i.e. a strong downtrend) to + 1 (i.e. a strong positive relationship, i.e. a strong uptrend). The higher or lower the value the stronger the up or downtrend is.
As such, correlation to time tells us two very important things. These are:
a) The direction of the stock; and
b) The strength of the trend.
Let's take a look at an example:
Above we have a chart of QQQ. We can see a trendline that seems to fit well. The questions we ask as traders are:
1. What is the likelihood QQQ breaks down from this trendline?
2. What is the likelihood QQQ continues up?
3. What is the likelihood QQQ does a false breakdown?
There are numerous mathematical approaches we can take to answer these questions. For example, 1 and 2 can be answered by use of a Cumulative Distribution Density analysis (CDDA) or even a linear or loglinear regression analysis and 3 can be answered, more or less, with a linear regression analysis and standard error ascertainment, or even just a general comparison using a data science approach (such as cosine similarity or Manhattan distance).
But, the reality is, all 3 of these questions can be visualized, at least in some way, by simply looking at the correlation to time. Let's look at this chart again, this time with the correlation heatmap applied:
If we look at the indicator we can see some pivotal things. These are:
1. We have 4, very strong uptrends that span both higher AND lower timeframes. We have a strong uptrend of 0.96 on the 5 minute, 50 candle period. We have a strong uptrend at the 300 candle lookback period on the 1 minute, we have a strong uptrend on the 100 day lookback on the daily timeframe period and we have a strong uptrend on the 5 minute on the 500 candle lookback period.
2. By comparison, we have 3 downtrends, all of which have correlations less than the 4 uptrends. All of the downtrends have a correlation above -0.8 (which we would want lower than -0.8 to be very strong), and all of the uptrends are greater than + 0.80.
3. We can also see that the uptrends are not confined to the smaller timeframes. We have multiple uptrends on multiple timeframes and both short term (50 to 100 candles) and long term (up to 500 candles).
4. The overall trend is strengthening to the upside manifested by a positive Max Change and a Positive Min change (to be discussed later more in-depth).
With this, we can see that QQQ is actually very strong and likely will continue at least some upside. If we let this play out:
We continued up, had one test and then bounced.
Now, I want to specify, this indicator is not a panacea for all trading. And in relation to the 3 questions posed, they are best answered, at least quantitatively, not only by correlation but also by the aforementioned methods (CDDA, etc.) but correlation will help you get a feel for the strength or weakness present with a stock.
What are some tangible applications of the indicator?
For me, this indicator is used in many ways. Let me outline some ways I generally apply this indicator in my day and swing trading:
1. Gauging the strength of the stock: The indictor tells you the most prevalent behavior of the stock. Are there more downtrends than uptrends present? Are the downtrends present on the larger timeframes vs uptrends on the shorter indicating a possible bullish reversal? or vice versa? Are the trends strengthening or weakening? All of these things can be visualized with the indicator.
2. Setting parameters for other indicators: If you trade EMAs or SMAs, you may have a "one size fits all" approach. However, its actually better to adjust your EMA or SMA length to the actual trend itself. Take a look at this:
This is QQQ on the 1 hour with the 200 EMA with 200 standard deviation bands added. If we look at the heatmap, we can see, yes indeed 200 has a fairly strong uptrend correlation of 0.70. But the strongest hourly uptrend is actually at 400 candles, with a correlation of 0.91. So what happens if we change the EMA length and standard deviation to 400? This:
The exact areas are circled and colour coded. You can see, the 400 offers more of a better reference point of supports and resistances as well as a better overall trend fit. And this is why I never advocate for getting married to a specific EMA. If you are an EMA 200 lover or 21 or 51, know that these are not always the best depending on the trend and situation.
Components of the indicator:
Ah okay, now for the boring stuff. Let's go over the functionality of the indicator. I tried to keep it simple, so it is pretty straight forward. If we open the menu here are our options:
We have the ability to toggle whichever timeframes we want. We also have the ability to toggle on or off the legend that displays the colour codes and the Max and Min highest change.
Max and Min highest change: The max and min highest change simply display the change in correlation over the previous 14 candles. An increasing Max change means that the Max trend is strengthening. If we see an increasing Max change and an increasing Min change (the Min correlation is moving up), this means the stock is bullish. Why? Because the min (i.e. ideally a big negative number) is going up closer to the positives. Therefore, the downtrend is weakening.
If we see both the Max and Min declining (red), that means the uptrend is weakening and downtrend is strengthening. Here are some examples:
Final Thoughts:
And that is the indicator and the theory behind the indicator.
In a nutshell, to summarize, the indicator simply tracks the correlation of a ticker to time on multiple timeframes. This will allow you to make judgements about strength, sentiment and also help you adjust which tools and timeframes you are using to perform your analyses.
As well, to make the indicator more user friendly, I tried to make the colours distinctively different. I was going to do different shades but it was a little difficult to visualize. As such, I have included a toggle-able legend with a breakdown of the colour codes!
That's it my friends, I hope you find it useful!
Safe trades and leave your questions, comments and feedback below!

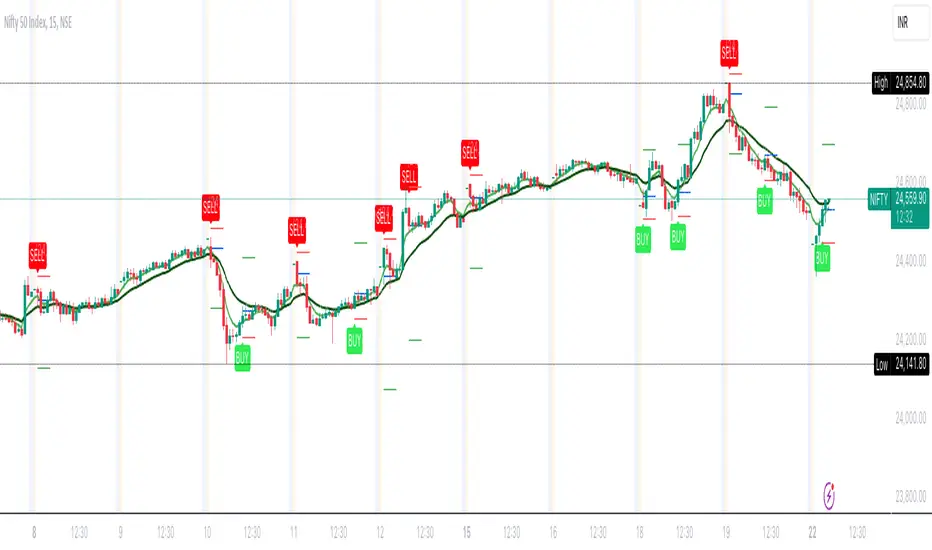
FalconRed 5 EMA Indicator (Powerofstocks)Improved version:
This indicator is based on Subhashish Pani's "Power of Stocks" 5 EMA Strategy, which aims to identify potential buying and selling opportunities in the market. The indicator plots the 5 EMA (Exponential Moving Average) and generates Buy/Sell signals with corresponding Target and Stoploss levels.
Subhashish Pani's 5 EMA Strategy is a straightforward approach. For intraday trading, a 5-minute timeframe is recommended for selling. In this strategy, you can choose to sell futures, sell calls, or buy puts as part of your selling strategy. The goal is to capture market tops by selling at the peak, anticipating a reversal for profitable trades. Although this strategy may result in frequent stop losses, they are typically small, while the minimum target should be at least three times the risk taken. By staying aligned with the trend, significant profits can be achieved. Subhashish Pani claims that this strategy has a 60% success rate.
Strategy for Selling (Short Future/Call/Stock or Buy Put):
1. When a candle completely closes above the 5 EMA (with no part of the candle touching the 5 EMA), it is considered an Alert Candle.
2. If the next candle is also entirely above the 5 EMA and does not break the low of the previous Alert Candle, ignore the previous Alert Candle and consider the new candle as the new Alert Candle.
3. Continue shifting the Alert Candle in this manner. However, when the next candle breaks the low of the Alert Candle, take a short trade (e.g., short futures, calls, stocks, or buy puts).
4. Set the stop loss above the high of the Alert Candle, and the minimum target should be 1:3 (at least three times the stop loss).
Strategy for Buying (Buy Future/Call/Stock or Sell Put):
1. When a candle completely closes below the 5 EMA (with no part of the candle touching the 5 EMA), it is considered an Alert Candle.
2. If the next candle is also entirely below the 5 EMA and does not break the high of the previous Alert Candle, ignore the previous Alert Candle and consider the new candle as the new Alert Candle.
3. Continue shifting the Alert Candle in this manner. However, when the next candle breaks the high of the Alert Candle, take a long trade (e.g., buy futures, calls, stocks, or sell puts).
4. Set the stop loss below the low of the Alert Candle, and the minimum target should be 1:3 (at least three times the stop loss).
Buy/Sell with Additional Conditions:
An additional condition is added to the buying/selling strategy:
1. Check if the closing price of the current candle is lower than the closing price of the Alert Candle for selling, or higher than the closing price of the Alert Candle for buying.
- This condition aims to filter out false moves, potentially preventing entering trades based on temporary fluctuations. However, it may cause you to miss out on significant moves, as you will enter trades after the candle closes, rather than at the breakout point.
Note: According to Subhashish Pani, the recommended timeframe for intraday buying is 15 minutes. However, this strategy can also be applied to positional/swing trading. If used on a monthly timeframe, it can be beneficial for long-term investing as well. The rules remain the same for all types of trades and timeframes.
If you need a deeper understanding of this strategy, you can search for "Subhashish Pani's (Power of Stocks) 5 EMA Strategy" on YouTube for further explanations.
Note: This strategy is not limited to intraday trading and can be applied to positional/swing
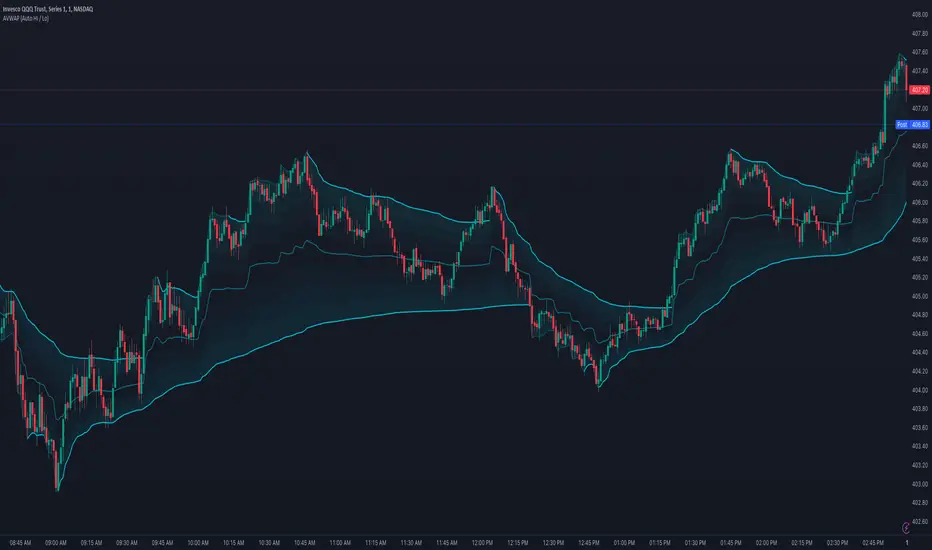
Anchored VWAP (Auto High & Low)OVERVIEW
This script plots, and auto-updates, 3 separate VWAPs: a traditional VWAP, a VWAP anchored to a trends high, and another anchored to a trends low.
VWAP and Anchored VWAPs are commonly used by institutions responsible for the majority of market volume on a given day. Citadel Trading, for example, accounts for approximately 35% of all U.S. listed retail volume , largely executed through program trades over the course of a day, week, or month.
Because VWAP is a prominent market maker tool for executing large trades, day traders can use it to better anticipate trends, mean reversion, and breakouts.
This is most useful on charts with intraday time frames (1 minute, 5 minute etc.) commonly used for day trading. This is not ideal for larger time frames (1 hour or greater) commonly used for swing trading or identifying larger trends.
INPUTS
You can configure:
The size, color, and visibility of 6 different plots (VWAP, High Anchor, Low Anchor, Average of Anchors, Quarter Values, Interim Bands)
How smooth the average displays
INSPIRATION
1. "How To Measure Anything" by Douglas W. Hubbard
2. "Maximum Trading Gains With Anchored VWAP" by Brian Shannon
Better understanding probability and how to analyze risk (first book), as well as the tools market makers use (second book), has completely reframed how I approach day trading.
Key Levels (Open, Premarket, & Yesterday)OVERVIEW
This indicator automatically identifies and draws recent high-probability support and resistance levels (recent key levels). Specifically, yesterdays highs / lows, premarket highs / lows, as well as yesterdays end of day Volume Weighted Average Price and trader specified Moving Average.
This is most useful on charts with intraday time frames (1 minute, 5 minute etc.) commonly used for day trading. This is not ideal for larger time frames (greater than 1 hour) commonly used for swing trading or identifying larger trends.
INPUTS
You can configure:
Line size, style, and colors
Label colors
Which key levels you want to see
Moving Average Parameters
Market Hours and Time Zone
DEV NOTES
This script illustrates:
A method for iterative management of more complex data objects (not just discrete values) with loops and arrays.

VIX HeatmapVIX HeatMap
Instructions:
- To be used with the S&P500 index (ES, SPX, SPY, any S&P ETF) as that's the input from where the CBOE calculates and measures the VIX. Can also be used with the Dow Jones, Nasdaq, & Nasdaq100.
Description:
- Expected Implied Volatility regime simplified & visualized. Know if we are in a high, medium, or low volatility regime, instantly.
- Ranges from Hot to Cold: The hotter the heat-map, the higher the implied volatility and fear & vice versa.
- The VIX HeatMap, color-maps important VIX levels (7 in this case) in measuring volatility for day trading & swing trading.
Using the VIX HeatMap:
- A LOW level volatility environment: Represented by "cooler" colors (Blue & White) depicts that the level of volatility and fear is low. Percentage moves on the index level are going to be tame and less volatile more often than not. Low fear = low perceived risk.
- A MEDIUM level volatility environment: Represented by "warmer" colors (Green & Yellow) depicts that the markets are transitioning from a calmer period or from a more fearful period. Market volatility here will be higher and provide more volatile swings in price.
- A HIGH level volatility environment: Represented by "hotter" colors (Orange, Red, & Purple) depicts that the markets are very fearful at the moment and will have big swings in both directions. Historically, extreme VIX levels tend to coincide with bottoms but are in no way predictive of the exact timing as the volatile moves can continue for an extended period of time.
- Transitioning between the 7 VIX Zones: Each and every one of these specific VIX zone levels is important.
1. Extreme low: <16
2. Low: 16 to 20
3. Normal: 20 to 24
4. Medium: 24 to 28
5. Med-High: 28 to 32
6. High: 32 to 36
7. Extreme high: >36
- These VIX levels in particular measure volatility changes that have a major impact on switching between smaller time frames and measuring depths of a sell move and vice versa. Each level also behaves as its own support & resistance level in terms of taking a bit of effort to switch regimes, and aids in identifying and measuring the potential depth of pullbacks in bull markets and bounces in bear markets to reveal reversal points.
- Examples of VIX level supports depicted on the chart marked with arrows. From left to right:
1. March 10th: Markets jumped 2 volatility levels in 2 days. The fluctuations from blue to yellow to green where a sign that price action would reverse from the selloff.
2. March 28th: As soon as we move from green to the blue VIX level (<20), markets began to rally and only ended when the volatility level moved sub VIX 16 (white).
3. May 4th & 24th: Next we see the 2 dips where volatility levels went from blue to green (VIX > 20), marked bottoms and reversed higher.
4. June 1st: We see a change in VIX regime yet again into lower VIX level and markets rocket higher.
Knowing the current VIX regime is a very important tool and aid in trading, now easily visualized.

Slight Swing Momentum Strategy.Introduction:
The Swing Momentum Strategy is a quantitative trading strategy designed to capture mid-term opportunities in the financial markets by combining swing trading principles with momentum indicators. It utilizes a combination of technical indicators, including moving averages, crossover signals, and volume analysis, to generate buy and sell signals. The strategy aims to identify market trends and capitalize on price momentum for profit generation.
Highlights:
The strategy offers several key highlights that make it unique and potentially attractive to traders:
Swing Trading with Momentum: The strategy combines the principles of swing trading, which aim to capture short-to-medium-term price swings, with momentum indicators that help identify strong price trends and potential breakout opportunities.
Technical Indicator Optimization: The strategy utilizes a selection of optimized technical indicators, including moving averages and crossover signals, to filter out the noise and focus on high-probability trading setups. This optimization enhances the strategy's ability to identify favourable entry and exit points.
Risk Management: The strategy incorporates risk management techniques, such as position sizing based on equity and dynamic stop loss levels, to manage risk exposure and protect capital. This helps to minimize drawdowns and preserve profits.
Buy Condition:
The buy condition in the strategy is determined by a combination of factors, including A1, A2, A3, XG, and weeklySlope. Let's break it down:
A1 Condition: The A1 condition checks for specific price relationships. It verifies that the ratio of the highest price to the closing price is less than 1.03, the ratio of the opening price to the lowest price is less than 1.03, and the ratio of the highest price to the previous day's closing price is greater than 1.06. This condition looks for a specific pattern indicating potential bullish momentum.
A2 Condition: The A2 condition checks for price relationships related to the closing price. It verifies that the ratio of the closing price to the opening price is greater than 1.05 or that the ratio of the closing price to the previous day's closing price is greater than 1.05. This condition looks for signs of upward price movement and momentum.
A3 Condition: The A3 condition focuses on volume. It checks if the current volume crosses above the highest volume over the last 60 periods. This condition aims to identify increased buying interest and potentially confirms the strength of the potential upward price movement.
XG Condition: The XG condition combines the A1 and A2 conditions and checks if they are true for both the current and previous bars. It also verifies that the ratio of the closing price to the 5-period EMA crosses above the 9-period SMA of the same ratio. This condition helps identify potential buy signals when multiple factors align, indicating a strong bullish momentum and potential entry point.
Weekly Trend Factor: The weekly slope condition calculates the slope of the 50-period SMA over a weekly timeframe. It checks if the slope is positive, indicating an overall upward trend on a weekly basis. This condition provides additional confirmation that the stock is in an upward trend.
When all of these conditions align, the buy condition is triggered, indicating a favourable time to enter a long position.
Sell Condition:
The sell condition is relatively straightforward in the strategy:
Sell Signal: The sell condition simply checks if the closing price crosses below the 10-period EMA. When this condition is met, it indicates a potential reversal or weakening of the upward price momentum, and a sell signal is generated.
Backtest Outcome:
The strategy was backtested over the period from January 22nd, 1999 to May 3rd, 2023, using daily candlestick charts for the NASDAQ: NVDA. The strategy used an initial capital of 1,000,000 USD, The order quantity is defined as 10% of the equity. The strategy allows for pyramiding with 1 order, and the transaction fee is set at 0.03% per trade. Here are the key outcomes of the backtest:
Net Profit: 539,595.84 USD, representing a return of 53.96%.
Percent Profitable: 48.82%
Total Closed Trades: 127
Profit Factor: 2.331
Max Drawdown: 68,422.70 USD
Average Trade: 4,248.79 USD
Average Number of Bars in Trades: 11, indicating the average duration of the trades.
Conclusion:
In conclusion, the Swing Momentum Strategy is a quantitative trading approach that combines swing trading principles with momentum indicators to identify and capture mid term trading opportunities. The strategy has demonstrated promising results during backtesting, including a significant net profit and a favourable profit factor.

SPY 4 Hour Swing TraderThe purpose of this script is to spot 4 hour pivots that indicate ~30 trading day swings. As VIX starts to drop options trading will get more boring and as we get back on the bull and can benefit from swing trading strategy. Swing trading doesn't make a whole lot of sense when VIX is above 28. Seems to get best results on 4 hour chart for this one. This indicator spots a go long opportunity when the 5 ema crosses the 13 ema on the 4 hour along with the RSI > 50 and the ADX > 20 and Stoichastic values (smoothed line < 80 or line < 90) and close > last candle close and the True Range < 6. It also spots uses a couple different means to determine when to exit the trade. Sell condition is primarily when the 13 ema crosses the 5 ema and the MACD line crosses below the signal line and the smoothed Stoichastic appears oversold (greater than 60) and slop of RSI < -.2. Stop Losses and Take Profits are configurable in Inputs along with ability to include short trades plus other MACD and Stoichastic settings. If a stop loss is encountered the trade will close. Also once twice the expected move is encountered partial profits will taken and stop losses and take profits will be re-established based on most recent close. Also a VIX above 28 will trigger any open positions to close. If trying to use this for something other than SPXL it is best to update stop losses and take profit percentages and check backtest results to ensure proper levels have been selected and the script gives satisfactory results.

Wave TrendThe Wave Trend indicator is based on the Mason’s Line Indicator.
This indicator is a sentiment analysis tool designed to help traders understand and analyze market trends. It works by calculating the average investor satisfaction of a group of investors. The results are displayed as colored squares at the bottom of the chart. For more information, read the description of the Mason's Line Indicator.
This indicator is not developed for use on short timeframes. It is an indicator that is best suited for longer timeframes, ideal for swing trading or long-term trading.
There are two main display parameters:
Display the coloured squares according to the distance to the sma (default value).
Display the squares according to the position of satisfaction in relation to the scale of the indicator.
there are two secondary settings for each of these options:
Display the squares by normalizing the values of the dataset between 0 and 1.
Display the squares without normalizing the value of the dataset between 0 and 1 (default value).
Please note that the Wave Trend Indicator is not a guarantee of future market performance and should be used in conjunction with proper risk management. Always ensure that you have a thorough understanding of the indicator’s methodology and its limitations before making any investment decisions. Additionally, past performance is not indicative of future results.

Swing BoxesHey, folks!
Sorry for not posting anything for such a long time. Don't have enough ideas and resources to get inspiration, so trying to brainstorm good stuff in my free time from university studies.
But despite my absence more I now have 300+ people subscribed to me! Thanks, guys, for keeping interest for my work, as I still do value each boost on my script, for real :)
So here is new script , enjoy!
Swing Boxes is pretty simple indicator, which plots signals with "boxes", that help you determine price targets.
What is the idea behind?
I wanted to make indicator, that could help me make swing trades with nice accuracy (as all we want, lol), and for signal criteria I decided to use highs and lows of the price . Then I started coding some ideas to see which of them could be worthy. And, actually, Swing Boxes appeared to be good. But the thing is, that I didn't intend to build them, they appeared as an anomaly from my code :)
I started to explore this anomaly (it looked super cool, but was repainting hard) to fix it and I succeeded, now Swng Boxes don't repaint.
The main idea is that when price goes above it's highest value of p-bars back or below it's lowest value p-bars back, then there is a some god probability, that price will continue to follow current direction.
And the things about Swing Boxes is that when there is a good trend movement, the boxes become super small to track price movement and when price breaks out in the counter-trend direction, then you will be able to almost perfectly catch a top or a bottom! But most of the signals won't be so high-quality, so don't think that is this some holy grail to trade swing-trading, because it is not.
Signal logic
Quick hint:
- epsilon(variable e ) = ATR * ATR_Factor . It is used to determine box's sensitivity to price changes.
If previous close is higher than variable, which contains previous HIGHEST value (variable h in the code), then update the this variable by taking up-to-date highest value and add epsilon( e ) to it;
If previous close is lower than variable, which contains previous LOWEST value (variable l in the code), then update the this variable by taking up-to-date lowest value and substract epsilon( e ) from it.
Variables decribed above ( h and l ) are box's top and bottom respectively, so if price cross them, it is logical to update it is value.
Settings and what is what
Swing Box Period - numbers fo bars in the past to find highest and lowest price from. The bigger the input, the bigger the boxes will be;
ATR Period;
ATR Factor - multiplier for ATR, determines sensitivity for price changes. The bigger this input, the more accurate signals will be, but less the probability that the signal will be on the top or a bottom.
Show Boxes? - when chosen, plots box's top and bottom. Used to determine price targets.
Show Baseline? - when chosen, plot's baseline, which midline between box's top and bottom.
How to use?
This indicator plots green and red triangles by default.
- Green triangle --> Buy ;
- Red triangle --> Sell ;
As I've said before, many signals from indicator will probably be garbage, so you need to tune settings for youself, so it could satisfy you .
You can enable showing boxes to see box's top and bottom. Box's bottom --> your entry, top --> your profit target.
If you find a way to sort bad signals, you will be able to trade with super cool RR, because the signal from Swing Boxes appear to be a good one, there is almost 95% probability, that price will not even come close to your stop loss, so you can trade with super small stop-losses! Smaller stop-loss --> smaller risk --> smaller loss --> bigger profit, it is that easy.
Also you can enable baseline to use at as your 1st TP, and box's top/bottom as 2nd TP, closing 25% on TP1 and the rest on TP2 (but that is just mine recommendation, you can use different RM (risk-management), if you want).
Also you can use baseline as your S/R (Support/Resistance) line, test it out on your charts.
And please, hear me out: as all other indicators out here on the TradingView, Swing Boxes ARE NOT meant to be traded in solo! Many bad signal can go in a row, so PLEASE find your way to filter out bad signals with other indicators.
You can see here the example of a garabge-class signal in a row, so be don't be deluded!
I do hope that somebody will suggest and idea to improve this thing, as I personally don't have enough time to think about it because of my university studies, but I will probably try it make this thing better throughout the time.
And that's it for now, folks! If you have any ideas for scripts, strategies or anything else, feel free to DM me or leave a comment, I will check it.
Hope you will find this script useful.
Take your profits!
- Tarasenko Fyodor

The Flash-Strategy (Momentum-RSI, EMA-crossover, ATR)The Flash-Strategy (Momentum-RSI, EMA-crossover, ATR)
Are you tired of manually analyzing charts and trying to find profitable trading opportunities? Look no further! Our algorithmic trading strategy, "Flash," is here to simplify your trading process and maximize your profits.
Flash is an advanced trading algorithm that combines three powerful indicators to generate highly selective and accurate trading signals. The Momentum-RSI, Super-Trend Analysis and EMA-Strategy indicators are used to identify the strength and direction of the underlying trend.
The Momentum-RSI signals the strength of the trend and only generates trading signals in confirmed upward or downward trends. The Super-Trend Analysis confirms the trend direction and generates signals when the price breaks through the super-trend line. The EMA-Strategy is used as a qualifier for the generation of trading signals, where buy signals are generated when the EMA crosses relevant trend lines.
Flash is highly selective, as it only generates trading signals when all three indicators align. This ensures that only the highest probability trades are taken, resulting in maximum profits.
Our trading strategy also comes with two profit management options. Option 1 uses the so-called supertrend-indicator which uses the dynamic ATR as a key input, while option 2 applies pre-defined, fixed SL and TP levels.
The settings for each indicator can be customized, allowing you to adjust the length, limit value, factor, and source value to suit your preferences. You can also set the time period in which you want to run the backtest and how many dollar trades you want to open in each position for fully automated trading.
Choose your preferred trade direction and stop-loss/take-profit settings, and let Flash do the rest. Say goodbye to manual chart analysis and hello to consistent profits with Flash. Try it now!
General Comments
This Flash Strategy has been developed in cooperation between Baby_whale_to_moon and JS-TechTrading. Cudos to Baby_whale_to_moon for doing a great job in transforming sophisticated trading ideas into pine scripts.
Detailed Description
The “Flash” script considers the following indicators for the generation of trading signals:
1. Momentum-RSI
2. ‘Super-Trend’-Analysis
3. EMA-Strategy
1. Momentum-RSI
• This indicator signals the strength of the underlying upward- or downward-trend.
• The signal range of this indicator is from 0 to 100. Values > 60 indicate a confirmed upward- or downward-trend.
• The strategy will only generate trading signals in case the stock (or any other financial security) is in a confirmed upward- (long entry signals) or downward-trend (short entry signals).
• This indicator provides information with regards to the strength of the underlying trend and it does not give any insight with regard to the direction of the trend. Therefore, this strategy also considers other indicators which provide technical confirmation with regards to the direction of the underlying trend.
Graph 1 shows this concept:
• The Momentum-RSI indicator gives lower readings during consolidation phases and no trading signals are generated during these periods.
Example (graph 2):
2. Super-Trend Analysis
• The red line in the graph below represents the so-called super-trend-line. Trading signals are only generated in case the price action breaks through this super-trend-line indicating a new confirmed upward-trend (or downward-trend, respectively).
• If that happens, the super trend-line changes its color from red to green, giving confirmation that the trend changed from bearish to bullish and long-entries can be considered.
• The vice-versa approach can be considered for short entries.
Graph 3 explains this concept:
3. Exponential Moving Average / EMA-Strategy
The functionality of this EMA-element of the strategy has been programmed as follows:
• The exponential moving average and two other trend lines are being used as qualifiers for the generation of trading-signals.
• Buy-signals for long-entries are only considered in case the EMA (yellow line in the graph below) crosses the red line.
• Sell-signals for short-entries are only considered in case the EMA (yellow line in the graph below) crosses the green line.
An example is shown in graph 4 below:
We use this indicator to determine the new trend direction that may occur by using the data of the price's past movement.
4. Bringing it all together
This section describes in detail, how this strategy combines the Momentum-RSI, the super-trend analysis and the EMA-strategy.
The strategy only generates trading-signals in case all of the following conditions and qualifiers are being met:
1. Momentum-RSI is higher than the set value of this strategy. The standard and recommended value is 60 (graph 5):
2. The super-trend analysis needs to indicate a confirmed upward-trend (for long-entry signals) or a confirmed downward-trend (for short-entry signals), respectively.
3. The EMA-strategy needs to indicate that the stock or financial security is in a confirmed upward-trend (long-entries) or downward-trend (short-entries), respectively.
The strategy will only generate trading signals if all three qualifiers are being met. This makes this strategy highly selective and is the key secret for its success.
Example for Long-Entry (graph 6):
When these conditions are met, our Long position is opened.
Example for Short-Entry (graph 7):
Trade Management Options (graph 8)
Option 1
In this dynamic version, the so-called supertrend-indicator is being used for the trade exit management. This supertrend-indicator is a sophisticated and optimized methodology which uses the dynamic ATR as one of its key input parameters.
The following settings of the supertrend-indicator can be changed and optimized (graph 9):
The dynamic SL/TP-lines of the supertrend-indicator are shown in the charts. The ATR-length and the supertrend-factor result in a multiplier value which can be used to fine-tune and optimize this strategy based on the financial security, timeframe and overall market environment.
Option 2 (graph 10):
Option 2 applies pre-defined, fixed SL and TP levels which will appear as straight horizontal lines in the chart.
Settings options (graph 11):
The following settings can be changed for the three elements of this strategy:
1. (Length Mom-Rsi): Length of our Mom-RSI indicator.
2. Mom-RSI Limit Val: the higher this number, the more momentum of the underlying trend is required before the strategy will start creating trading signals.
3. The length and factor values of the super trend indicator can be adjusted:ATR Length SuperTrend and Factor Super Trend
4. You can set the source value used by the ema trend indicator to determine the ema line: Source Ema Ind
5. You can set the EMA length and the percentage value to follow the price: Length Ema Ind and Percent Ema Ind
6. The backtesting period can be adjusted: Start and End time of BackTest
7. Dollar cost per position: this is relevant for 100% fully automated trading.
8. Trade direction can be adjusted: LONG, SHORT or BOTH
9. As we explained above, we can determine our stop-loss and take-profit levels dynamically or statically. (Version 1 or Version 2 )
Display options on the charts graph 12):
1. Show horizontal lines for the Stop-Loss and Take-profit levels on the charts.
2. Display relevant Trend Lines, including color setting options for the supertrend functionality. In the example below, green lines indicate a confirmed uptrend, red lines indicate a confirmed downtrend.
Other comments
• This indicator has been optimized to be applied for 1 hour-charts. However, the underlying principles of this strategy are supply and demand in the financial markets and the strategy can be applied to all timeframes. Daytraders can use the 1min- or 5min charts, swing-traders can use the daily charts.
• This strategy has been designed to identify the most promising, highest probability entries and trades for each stock or other financial security.
• The combination of the qualifiers results in a highly selective strategy which only considers the most promising swing-trading entries. As a result, you will normally only find a low number of trades for each stock or other financial security per year in case you apply this strategy for the daily charts. Shorter timeframes will result in a higher number of trades / year.
• Consequently, traders need to apply this strategy for a full watchlist rather than just one financial security.

Advanced VWAP_Pullback Strategy_Trend-Template QualifierGeneral Description and Unique Features of this Script
Introducing the Advanced VWAP Momentum-Pullback Strategy (long-only) that offers several unique features:
1. Our script/strategy utilizes Mark Minervini's Trend-Template as a qualifier for identifying stocks and other financial securities in confirmed uptrends. Mark Minervini, a 2x US Investment Champion, developed the Trend-Template, which covers eight different and independent characteristics that can be adjusted and optimized in this trend-following strategy to ensure the best results. The strategy will only trigger buy-signals in case the optimized qualifiers are being met.
2. Our strategy is based on the supply/demand balance in the market, making it timeless and effective across all timeframes. Whether you are day trading using 1- or 5-min charts or swing-trading using daily charts, this strategy can be applied and works very well.
3. We have also integrated technical indicators such as the RSI and the MA / VWAP crossover into this strategy to identify low-risk pullback entries in the context of confirmed uptrends. By doing so, the risk profile of this strategy and drawdowns are being reduced to an absolute minimum.
Minervini’s Trend-Template and the ‘Stage-Analysis’ of the Markets
This strategy is a so-called 'long-only' strategy. This means that we only take long positions, short positions are not considered.
The best market environment for such strategies are periods of stable upward trends in the so-called stage 2 - uptrend.
In stable upward trends, we increase our market exposure and risk.
In sideways markets and downward trends or bear markets, we reduce our exposure very quickly or go 100% to cash and wait for the markets to recover and improve. This allows us to avoid major losses and drawdowns.
This simple rule gives us a significant advantage over most undisciplined traders and amateurs!
'The Trend is your Friend'. This is a very old but true quote.
What's behind it???
• 98% of stocks made their biggest gains in a Phase 2 upward trend.
• If a stock is in a stable uptrend, this is evidence that larger institutions are buying the stock sustainably.
• By focusing on stocks that are in a stable uptrend, the chances of profit are significantly increased.
• In a stable uptrend, investors know exactly what to expect from further price developments. This makes it possible to locate low-risk entry points.
The goal is not to buy at the lowest price – the goal is to buy at the right price!
Each stock goes through the same maturity cycle – it starts at stage 1 and ends at stage 4
Stage 1 – Neglect Phase – Consolidation
Stage 2 – Progressive Phase – Accumulation
Stage 3 – Topping Phase – Distribution
Stage 4 – Downtrend – Capitulation
This strategy focuses on identifying stocks in confirmed stage 2 uptrends. This in itself gives us an advantage over long-term investors and less professional traders.
By focusing on stocks in a stage 2 uptrend, we avoid losses in downtrends (stage 4) or less profitable consolidation phases (stages 1 and 3). We are fully invested and put our money to work for us, and we are fully invested when stocks are in their stage 2 uptrends.
But how can we use technical chart analysis to find stocks that are in a stable stage 2 uptrend?
Mark Minervini has developed the so-called 'trend template' for this purpose. This is an essential part of our JS-TechTrading pullback strategy. For our watchlists, only those individual values that meet the tough requirements of Minervini's trend template are eligible.
The Trend Template
• 200d MA increasing over a period of at least 1 month, better 4-5 months or longer
• 150d MA above 200d MA
• 50d MA above 150d MA and 200d MA
• Course above 50d MA, 150d MA and 200d MA
• Ideally, the 50d MA is increasing over at least 1 month
• Price at least 25% above the 52w low
• Price within 25% of 52w high
• High relative strength according to IBD.
NOTE: In this basic version of the script, the Trend-Template has to be used as a separate indicator on TradingView (Public Trend-Template indicators are available in TradingView – community scripts). It is recommended to only execute buy signals in case the stock or financial security is in a stage 2 uptrend, which means that the criteria of the trend-template are fulfilled.
This strategy can be applied to all timeframes from 5 min to daily.
The VWAP Momentum-Pullback Strategy
For the JS-TechTrading VWAP Momentum-Pullback Strategy, only stocks and other financial instruments that meet the selected criteria of Mark Minervini's trend template are recommended for algorithmic trading with this startegy.
A further prerequisite for generating a buy signals is that the individual value is in a short-term oversold state (RSI).
When the selling pressure is over and the continuation of the uptrend can be confirmed by the MA / VWAP crossover after reaching a price low, a buy signal is issued by this strategy.
Stop-loss limits and profit targets can be set variably. You also have the option to make use of the trailing stop exit strategy.
Relative Strength Index (RSI)
The Relative Strength Index (RSI) is a technical indicator developed by Welles Wilder in 1978. The RSI is used to perform a market value analysis and identify the strength of a trend as well as overbought and oversold conditions. The indicator is calculated on a scale from 0 to 100 and shows how much an asset has risen or fallen relative to its own price in recent periods.
The RSI is calculated as the ratio of average profits to average losses over a certain period of time. A high value of the RSI indicates an overbought situation, while a low value indicates an oversold situation. Typically, a value > 70 is considered an overbought threshold and a value < 30 is considered an oversold threshold. A value above 70 signals that a single value may be overvalued and a decrease in price is likely , while a value below 30 signals that a single value may be undervalued and an increase in price is likely.
For example, let's say you're watching a stock XYZ. After a prolonged falling movement, the RSI value of this stock has fallen to 26. This means that the stock is oversold and that it is time for a potential recovery. Therefore, a trader might decide to buy this stock in the hope that it will rise again soon.
The MA / VWAP Crossover Trading Strategy
This strategy combines two popular technical indicators: the Moving Average (MA) and the Volume Weighted Average Price (VWAP). The MA VWAP crossover strategy is used to identify potential trend reversals and entry/exit points in the market.
The VWAP is calculated by taking the average price of an asset for a given period, weighted by the volume traded at each price level. The MA, on the other hand, is calculated by taking the average price of an asset over a specified number of periods. When the MA crosses above the VWAP, it suggests that buying pressure is increasing, and it may be a good time to enter a long position. When the MA crosses below the VWAP, it suggests that selling pressure is increasing, and it may be a good time to exit a long position or enter a short position.
Traders typically use the MA VWAP crossover strategy in conjunction with other technical indicators and fundamental analysis to make more informed trading decisions. As with any trading strategy, it is important to carefully consider the risks and potential rewards before making any trades.
This strategy is applicable to all timeframes and the relevant parameters for the underlying indicators (RSI and MA/VWAP) can be adjusted and optimized as needed.
Backtesting
Backtesting gives outstanding results on all timeframes and drawdowns can be reduced to a minimum level. In this example, the hourly chart for MCFT has been used.
Settings for backtesting are:
- Period from Jan 2020 until March 2023
- Starting capital 100k USD
- Position size = 25% of equity
- 0.01% commission = USD 2.50.- per Trade
- Slippage = 2 ticks
Other comments
- This strategy has been designed to identify the most promising, highest probability entries and trades for each stock or other financial security.
- The combination of the Trend-Template and the RSI qualifiers results in a highly selective strategy which only considers the most promising swing-trading entries. As a result, you will normally only find a low number of trades for each stock or other financial security per year in case you apply this strategy for the daily charts. Shorter timeframes will result in a higher number of trades / year.
- Consequently, traders need to apply this strategy for a full watchlist rather than just one financial security.

JS-TechTrading: VWAP Momentum_Pullback StrategyGeneral Description and Unique Features of this Script
Introducing the VWAP Momentum-Pullback Strategy (long-only) that offers several unique features:
1. Our script/strategy utilizes Mark Minervini's Trend-Template as a qualifier for identifying stocks and other financial securities in confirmed uptrends.
NOTE: In this basic version of the script, the Trend-Template has to be used as a separate indicator on TradingView (Public Trend-Template indicators are available on TradingView – community scripts). It is recommended to only execute buy signals in case the stock or financial security is in a stage 2 uptrend, which means that the criteria of the trend-template are fulfilled.
2. Our strategy is based on the supply/demand balance in the market, making it timeless and effective across all timeframes. Whether you are day trading using 1- or 5-min charts or swing-trading using daily charts, this strategy can be applied and works very well.
3. We have also integrated technical indicators such as the RSI and the MA / VWAP crossover into this strategy to identify low-risk pullback entries in the context of confirmed uptrends. By doing so, the risk profile of this strategy and drawdowns are being reduced to an absolute minimum.
Minervini’s Trend-Template and the ‘Stage-Analysis’ of the Markets
This strategy is a so-called 'long-only' strategy. This means that we only take long positions, short positions are not considered.
The best market environment for such strategies are periods of stable upward trends in the so-called stage 2 - uptrend.
In stable upward trends, we increase our market exposure and risk.
In sideways markets and downward trends or bear markets, we reduce our exposure very quickly or go 100% to cash and wait for the markets to recover and improve. This allows us to avoid major losses and drawdowns.
This simple rule gives us a significant advantage over most undisciplined traders and amateurs!
'The Trend is your Friend'. This is a very old but true quote.
What's behind it???
• 98% of stocks made their biggest gains in a Phase 2 upward trend.
• If a stock is in a stable uptrend, this is evidence that larger institutions are buying the stock sustainably.
• By focusing on stocks that are in a stable uptrend, the chances of profit are significantly increased.
• In a stable uptrend, investors know exactly what to expect from further price developments. This makes it possible to locate low-risk entry points.
The goal is not to buy at the lowest price – the goal is to buy at the right price!
Each stock goes through the same maturity cycle – it starts at stage 1 and ends at stage 4
Stage 1 – Neglect Phase – Consolidation
Stage 2 – Progressive Phase – Accumulation
Stage 3 – Topping Phase – Distribution
Stage 4 – Downtrend – Capitulation
This strategy focuses on identifying stocks in confirmed stage 2 uptrends. This in itself gives us an advantage over long-term investors and less professional traders.
By focusing on stocks in a stage 2 uptrend, we avoid losses in downtrends (stage 4) or less profitable consolidation phases (stages 1 and 3). We are fully invested and put our money to work for us, and we are fully invested when stocks are in their stage 2 uptrends.
But how can we use technical chart analysis to find stocks that are in a stable stage 2 uptrend?
Mark Minervini has developed the so-called 'trend template' for this purpose. This is an essential part of our JS-TechTrading pullback strategy. For our watchlists, only those individual values that meet the tough requirements of Minervini's trend template are eligible.
The Trend Template
• 200d MA increasing over a period of at least 1 month, better 4-5 months or longer
• 150d MA above 200d MA
• 50d MA above 150d MA and 200d MA
• Course above 50d MA, 150d MA and 200d MA
• Ideally, the 50d MA is increasing over at least 1 month
• Price at least 25% above the 52w low
• Price within 25% of 52w high
• High relative strength according to IBD.
NOTE: In this basic version of the script, the Trend-Template has to be used as a separate indicator on TradingView (Public Trend-Template indicators are available in TradingView – community scripts). It is recommended to only execute buy signals in case the stock or financial security is in a stage 2 uptrend, which means that the criteria of the trend-template are fulfilled.
This strategy can be applied to all timeframes from 5 min to daily.
The VWAP Momentum-Pullback Strateg y
For the JS-TechTrading VWAP Momentum-Pullback Strategy, only stocks and other financial instruments that meet the selected criteria of Mark Minervini's trend template are recommended for algorithmic trading with this startegy.
A further prerequisite for generating a buy signals is that the individual value is in a short-term oversold state (RSI).
When the selling pressure is over and the continuation of the uptrend can be confirmed by the MA / VWAP crossover after reaching a price low, a buy signal is issued by this strategy.
Stop-loss limits and profit targets can be set variably.
Relative Strength Index (RSI)
The Relative Strength Index (RSI) is a technical indicator developed by Welles Wilder in 1978. The RSI is used to perform a market value analysis and identify the strength of a trend as well as overbought and oversold conditions. The indicator is calculated on a scale from 0 to 100 and shows how much an asset has risen or fallen relative to its own price in recent periods.
The RSI is calculated as the ratio of average profits to average losses over a certain period of time. A high value of the RSI indicates an overbought situation, while a low value indicates an oversold situation. Typically, a value > 70 is considered an overbought threshold and a value < 30 is considered an oversold threshold. A value above 70 signals that a single value may be overvalued and a decrease in price is likely , while a value below 30 signals that a single value may be undervalued and an increase in price is likely.
For example, let's say you're watching a stock XYZ. After a prolonged falling movement, the RSI value of this stock has fallen to 26. This means that the stock is oversold and that it is time for a potential recovery. Therefore, a trader might decide to buy this stock in the hope that it will rise again soon.
The MA / VWAP Crossover Trading Strategy
This strategy combines two popular technical indicators: the Moving Average (MA) and the Volume Weighted Average Price (VWAP). The MA VWAP crossover strategy is used to identify potential trend reversals and entry/exit points in the market.
The VWAP is calculated by taking the average price of an asset for a given period, weighted by the volume traded at each price level. The MA, on the other hand, is calculated by taking the average price of an asset over a specified number of periods. When the MA crosses above the VWAP, it suggests that buying pressure is increasing, and it may be a good time to enter a long position. When the MA crosses below the VWAP, it suggests that selling pressure is increasing, and it may be a good time to exit a long position or enter a short position.
Traders typically use the MA VWAP crossover strategy in conjunction with other technical indicators and fundamental analysis to make more informed trading decisions. As with any trading strategy, it is important to carefully consider the risks and potential rewards before making any trades.
This strategy is applicable to all timeframes and the relevant parameters for the underlying indicators (RSI and MA/VWAP) can be adjusted and optimized as needed.
Backtesting
Backtesting gives outstanding results on all timeframes and drawdowns can be reduced to a minimum level. In this example, the hourly chart for MCFT has been used.
Settings for backtesting are:
- Period from April 2020 until April 2021 (1 yr)
- Starting capital 100k USD
- Position size = 25% of equity
- 0.01% commission = USD 2.50.- per Trade
- Slippage = 2 ticks
Other comments
• This strategy has been designed to identify the most promising, highest probability entries and trades for each stock or other financial security.
• The RSI qualifier is highly selective and filters out the most promising swing-trading entries. As a result, you will normally only find a low number of trades for each stock or other financial security per year in case you apply this strategy for the daily charts. Shorter timeframes will result in a higher number of trades / year.
• As a result, traders need to apply this strategy for a full watchlist rather than just one financial security.

Paradigm Trades_VPA Swing IndicatorThe indicator is designed to identify specific patterns in price and volume movements that can signal potential trading opportunities. It does this by calculating several conditions based on the current bar's price and volume movements.
The code defines five conditions: Narrow Spread Up Bar, Wide Spread Down Bar, No Demand Bar, No Selling Bar, and Churning. These conditions are then plotted on the chart using specific shapes and colors. The code also includes alert conditions for each of the signals, which can be used to generate alerts for traders when a particular pattern is identified.
The VPA Swing Indicator can be used as part of a swing trading strategy to identify potential buy or sell signals. For example, a Narrow Spread Up Bar may indicate bullish momentum, while a Wide Spread Down Bar may indicate bearish momentum. Traders can use these signals to make informed trading decisions and manage their risk accordingly.
Legend:
Spread Up Bar: This is a bullish bar with a small spread, indicating a lack of selling pressure and strong buying activity.
Wide Spread Down Bar: This is a bearish bar with a large spread, indicating strong selling pressure and weak buying activity.
No Demand Bar: This is a bearish bar with a small spread and low volume, indicating a lack of buying interest and the smart money selling off their positions.
No Selling Bar: This is a bullish bar with a small spread and low volume, indicating a lack of selling interest and the smart money buying up positions.
Churning: This is a sideways market with narrow spread bars and low volume, indicating the smart money is distributing shares to the retail traders.

Altered OBV On MACDHere is another strategy along with an indicator that is already published for everyone to use wisely in the tradingview platform. The strategy is not very planned to highlight where to enter and when to exit as it is just a system. So, it is always good practice to follow the signal of simple moving averages and that is the reason you could find those color lines in this strategy as well.
As the indicator signals the entry point, it is wise to decide what the SMA (21, 50, 90, 200) signals us. When the price oscillated around the higher timeframe of moving averages, then it is wise to wait before entering.
OBV:
The OBV is perfect indicator to understand the strength of the particular stock. As the strength increase, the trend of the stock goes high along with price. But, the OBV is considered only with close of previous close which is to make sure the double confirmation on the price to accumulate the volume .
Altered OBV:
So, here is the altered OBV, which basically consider the close of previous close and also buying interested of the day when close is higher than open.
MACD:
I always admire the magic of MACD with pre-defined timeframe. Now, this MACD applied on top of altered OBV to signal us the moving of the ticker strength.
Long:
The long entry occurs when the MACD on Altered OBV signal bullish and the same time the MACD on close already bullish.
Short
The short denotes when the MACD on Altered OBV signal bearish and at the same time the MACD on close already bearish.
I hope this would help on your swing trading strategy.
Happy Investing.

MFI StrategyThis indicator is based on MFI25 and EMA55 and optimized for 1 day graph and slow swing trading to show large moves and tops and bottoms.
You can change the MFI and EMA settings according to your style of trading.
The change from green to red and visa versa are the buying and selling moments.
The yellow line indicates that a change is possibly comming or not really sollid, so with yellow it's your own feeling that is leading.
Always combine this graph with others. F.i. a RSI14 to look for divergenses.
Ps. I'm not a professional or very experienced trader, but this indicator works perfect for me.
Succes.
