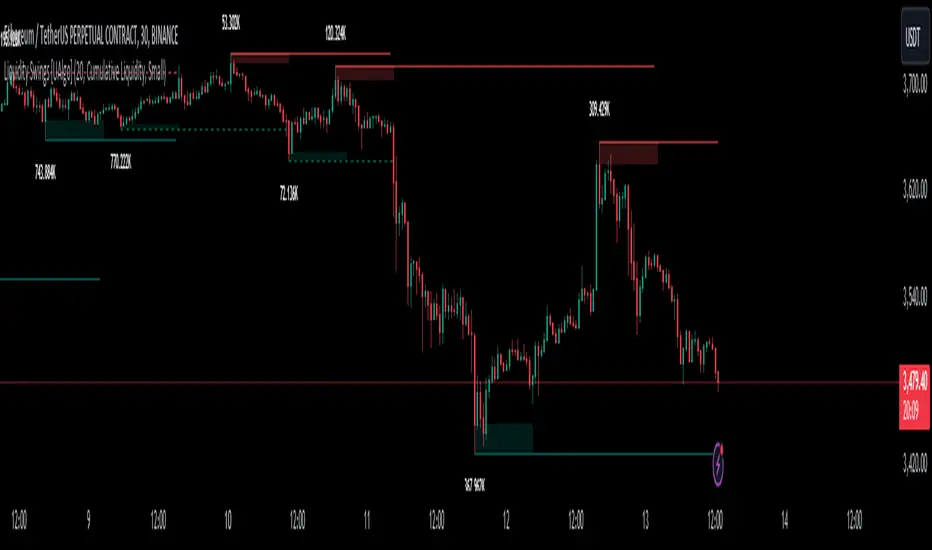
Liquidity Swings [UAlgo]The "Liquidity Swings " indicator is designed to help traders identify liquidity swings within the market. This tool is particularly useful for visualizing areas where liquidity is accumulating and where it is being swept, providing valuable insights for making informed trading decisions. By tracking the pivots in price and associating them with volume, the indicator highlights zones of potential support and resistance, helping traders understand market dynamics more clearly.
🔶 Key Features
Liquidity Swing Sensitivity: Adjustable sensitivity settings to fine-tune the detection of liquidity swings according to market conditions and trader preferences.
Two modes of liquidity calculation:
Cumulative Liquidity: Aggregates unswept liquidity over multiple swings until it is swept, providing a broader view of liquidity accumulation.
Individual Liquidity: Displays the accumulated liquidity for each swing independently, offering a more granular perspective.
Visual Customization: Options to customize the colors and sizes of liquidity lines, areas, and informational text for better visual clarity.
Dynamic Updates: The indicator dynamically updates liquidity zones and labels, adjusting to new market data to keep traders informed in real-time.
🔶 Disclaimer
The "Liquidity Swings " indicator is provided for educational and informational purposes only.
It should not be considered as financial advice or a recommendation to buy or sell any financial instrument.
The use of this indicator involves inherent risks, and users should employ their own judgment and conduct their own research before making any trading decisions. Past performance is not indicative of future results.
🔷 Related Scripts
Liquidity Sweeps
Williams %R Liquidity Sweeps
Search in scripts for "swing"
The Swinging Momentum IndicatorThe Swinging Momentum indicator is a custom trading indicator that looks at price momentum to identify potential buy and sell signals. It uses the rate of change in closing price over the last few bars to determine if momentum is increasing or decreasing. It also looks at the relationship of the close price to recent highs and lows, volume, and short term moving averages to confirm the strength of the momentum signal.
The indicator has two main components - identifying initial buy and sell signals, and then rating the strength of those signals. For buys, it looks for an increase in closing price momentum along with a close above recent highs and highest volume. For sells, it looks for a decrease in momentum and close below recent lows and highest volume. This identifies the initial signal without too many false signals.
It then looks at multiple factors to grade the strength of the signal, on a scale of 0 to 3. For buys it looks at how the close compares to the open, high and low of the last 4 bars, if the current low is above the recent low, and if there are more gaining days than losing days recently. For sells it looks at the close versus the open/high/low, if the current high is below the recent high, and if there are more losing than gaining days.
Each condition met adds 1 point to the strength rating. A rating above 2 is considered a strong momentum signal. This filters out weaker signals and reduces whipsaws.
The end result is plotted on the chart. Buy signals are triangles pointing up below the bars, sells are triangles pointing down above the bars. The colors help visualize the strength - strong signals are green for buys and red for sells, while weaker signals are yellow.
Trading with the Swinging Momentum indicator is straightforward. Strong buy signals identify upside momentum, so traders would look to enter long positions on a retest of the buy signal bar high. Strong sell signals identify downside momentum, so short positions can be entered on a retest of the bar low. Stops are placed beyond recent swing points in the opposite direction of the trade.
Since momentum can quickly change, risk management is key. Traders should look for other confirming indicators to strengthen the probability of a momentum trade working out. Good additional indicators to use with momentum include volume, trends, support/resistance and volatility measures.
The advantage of the Swinging Momentum indicator is that isolating the strongest momentum moves helps traders focus on higher probability trade setups. Monitoring both the initial signal and the strength rating gives an added level of confidence compared to standard momentum indicators. This custom indicator combines multiple momentum strategies into one, allowing traders to quickly identify and evaluate momentum opportunities on the chart.
Used appropriately with sound risk management, the Swinging Momentum indicator can be a valuable addition to a trading system. It visualizes both the direction and strength of momentum, key factors when trading trends and breakouts. While no indicator is perfect, understanding and utilizing momentum is a key concept for traders to master. This indicator provides a graphical representation to improve the way momentum is incorporated into trading decisions.

SPY 1 Hour Swing TraderThe purpose of this script is to spot 1 hour pivots that indicate ~5 to 6 trading day swings. Results indicate that swings are held approximately 5 to 6 trading days on average, over the last 6 years. This indicator spots a go long opportunity when the 5 ema crosses the 13 ema on the 1 hour along with the RSI > 50. It also spots uses a couple different means to determine when to exit the trade. Sell condition is primarily when the 13 ema crosses the 5 ema and the MACD line crosses below the signal line and the smoothed Stoichastic appears oversold (greater than 60). Stop Losses and Take Profits are configurable in Inputs along with ability to include short trades plus other MACD and Stoichastic settings. If a stop loss is encountered the trade will close. Also once twice the expected move is encountered partial profits will taken and stop losses and take profits will be re-established based on most recent close. Once long trades are exited, short trades will be initiated if recent conditions appeared oversold and input option for short trading is enabled. If trying to use this for something other than SPXL it is best to update stop losses and take profit percentages and check backtest results to ensure proper levels have been selected and the script gives satisfactory results.

Mark Structure ShdwMark Structure Show is building the market swing structure, minor and sub structure and marks all possible insignificant pivots
This indicator is the alternative version of Mark Structure indicator, I had to create another indicator in order to avoid programming limitation of TreadingView.
This version uses confirmation approach as confirming by body, it means every swing low/high is confirmed when the body (of newly creating swing low/high correspondingly) takes place and intercepts it. the same behaviour is with breaking structure its confirmed only by body.
From trading prospective with this kind of approach we can easily detect manipulations (caused by sweeps) and disregard those manipulation as elements which are breaking the structure. so its extremely useful for those who are trading smart money price actions and basing on swing structure POI
it supports:
- Marking all pivots with labels or join them continuously with trend lines.
- Marking minor and sub structured swings with labels or join them continuously with trend lines. Marking last actual CHoCH and BOS. Minor and substructure are structures inside swing structure and it can differ from the structure of lower timeframe
- Marking swings of swing structure with labels or join them continuously with trend lines.
- Changing bullish and bearish colors of each kind of structures
- Changing pivot labelings
- Changing colors
Remarks:
- Don't expect to have minor and sub structure in each swing waves, its totally fine when you don't have them at all
- Swing structure is the most significant structure and shows real price direction.
- The last swing is not able to be confirmed it tries to build 2 swings that most likely would be either substructure or SMS BOS

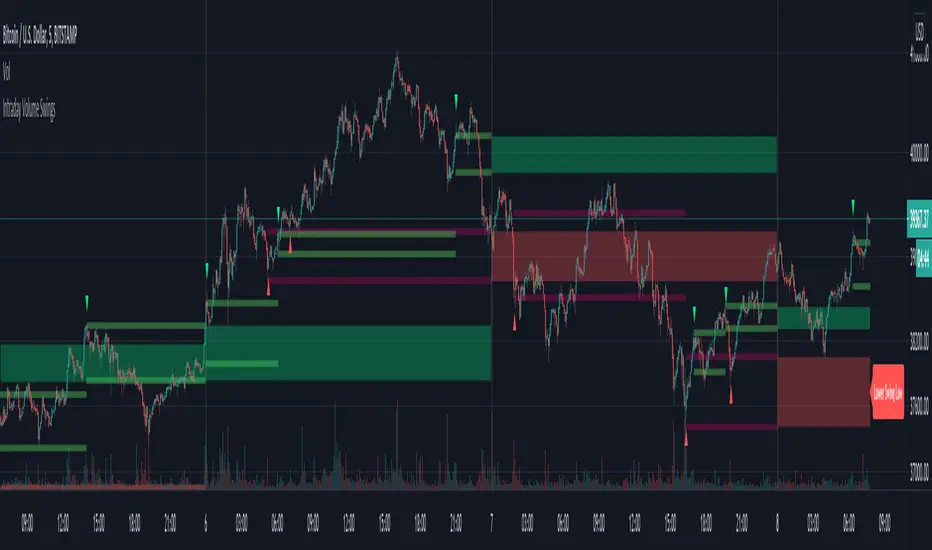
Intraday Volume SwingsVolume swings are defined as increasing volume and higher highs/lower lows over a minimum of three bars.
This script tracks volume swings over an intraday chart and stores the final lowest low swing / highest high swing over the course of the day. The final high swing and low swing are then plotted over the following day as possible retracement / support & resistance levels.
Intraday levels for the current day can also be displayed, which may or may not be the final swings for the day, but are also possible areas of interest.
See code for additional notes.
Investing - Weekly EMA's mapped to Daily ChartWhen there isn't enough time in your day to day-trade, yet you want to utilise all the technical analysis skills you have... why not make a long term investing or swing trading indicator set to help you along the way!
So I did....
When it comes to long term investing and swing trading, I often find the weekly 12/26/52 EMA's do a great job in capturing the main market swings from bull to bear.
However, I like to use the Daily chart to see the candle patterns and shapes with more detail and divergences often show up better on the daily chart.
So I have decided to combine the two!
I have basically taken the EMA 12/26/52 from the weekly and transferred them over to the daily (mathematically they are not exact, but for me they are close enough).
I have also developed a simple scale in / scale out strategy for using these exponential moving averages. It isn't as simple as buying in on each signal, however I use my own special strategy to take advantage of the alerts.
Enjoy!

JPY GBP ROCsRate of change of most volatile JPY and GBP pairs. All pairs ending in JPY are red except GBPJPY (colored yellow --currently most volatile 7/2016). GBPNZD is blue, the other GBP pairs are green, lime and teal. GBPJPY and GBPNZD are my favorite day trading / swing trading pairs. This script allows me to see the action of the most volatile and liquid pairs on one screen. JPY pairs (ex-GBPJPY) are all red so that I see the flow of JPY not so much each pair and its name. Global movement of JPY is what I am after. Same for the coloring of GBP pairs as green expect GBPNZD as blue. ***** EURGBP is plotted as an opposite (with a negative in front of its sma. EURGBP is extremely correlated to GBPNZD, I decided to plot it also.

Chainbey Ai - Swing High/Low Range📈 Chainbey Ai – Swing High / Swing Low Range
Chainbey Ai – Swing High / Swing Low Range is a clean and powerful market-structure indicator designed to automatically identify key swing levels and visualize the active price range on any chart.
This tool helps traders clearly see where price is reacting, consolidating, or preparing for a breakout.
🔹 What This Indicator Does
✔ Automatically detects the latest confirmed Swing High
✔ Automatically detects the latest confirmed Swing Low
✔ Draws horizontal levels for both swings
✔ Labels levels clearly as “Swing High” and “Swing Low”
✔ Highlights the range between swings using a background fill
✔ Updates dynamically as new market structure forms
🔹 Why It’s Useful
Identify support & resistance without manual drawing
Visualize consolidation zones instantly
Spot breakout and fake-out areas faster
Ideal for range trading, breakout trading, and trend confirmation
Works perfectly with price action, volume, and order-flow concepts
🔹 Best Use Cases
Crypto (Spot & Futures)
Forex
Indices
Commodities (Gold, Silver, Oil)
Timeframes: Works on all timeframes (especially strong on 15M, 30M, 1H)
🔹 How to Trade With It
Buy bias when price holds above Swing Low inside the range
Sell bias when price rejects from Swing High
Breakout confirmation when price closes strongly outside the range
Combine with volume, momentum, or liquidity concepts for higher accuracy
🔹 Customization
Adjust Swing Length to control sensitivity
Enable/disable range background fill
Customize colors and transparency
Extend swing levels to the right for forward guidance
⚠️ Disclaimer
This indicator is a technical analysis tool, not financial advice.
Always manage risk and confirm signals with your own strategy.
🔗 Built by Chainbey Ai
Smart Structure • Clean Levels • Clear Ranges 🚀

LETHINH-Swing pa,smc🟦 📌 Title (English)
Swing High / Swing Low – 3-Candle Fractal (5-Bar Pivot) | Auto Alerts
⸻
🟩 📌 Short Description
A clean and reliable swing high / swing low detector based on the classic 3-candle (5-bar) fractal pivot. Automatically marks SH/SL and triggers alerts when a swing is confirmed. No repainting after confirmation.
⸻
🟧 📌 Full Description (for TradingView Publishing)
🔶 Swing High / Swing Low – 3-Candle Fractal (5-Bar Pivot)
This indicator identifies Swing Highs (SH) and Swing Lows (SL) using the classic 3-candle fractal pattern, also known as the 5-bar pivot.
It marks swing points only after full confirmation, making it highly reliable and suitable for structure-based trading.
⸻
🔶 📍 How It Works
A swing is confirmed when the center candle is higher (or lower) than the two candles on each side:
Swing High (SH)
high > high , high , high
Swing Low (SL)
low < low , low , low
The confirmation occurs after 2 right candles close, so the indicator does not repaint once a swing is identified.
⸻
🔶 📍 Key Features
• Detects clean and accurate swings
• Uses pure price action — no indicators, no lag
• Marks swing high (SH) and swing low (SL) directly on the chart
• Non-repainting after confirmation
• Works on all timeframes and all markets
• Extremely lightweight and fast
• Includes alert conditions for both SH and SL
Perfect for traders using:
• Market Structure (BOS / CHoCH)
• Order Blocks (OB)
• Smart Money Concepts (SMC)
• Liquidity hunts
• Wyckoff
• Support/Resistance
• Price Action entries
⸻
🔶 📍 Why This Indicator Is Useful
Swing points are the foundation of market structure.
Accurately detecting them helps traders:
• Identify trend shifts
• Spot BOS / CHoCH correctly
• Find key zones (OB, liquidity levels, supply/demand)
• Time entries more precisely
• Avoid fake structure breaks
This indicator ensures swings are plotted only when fully confirmed, reducing noise and confusion.
⸻
🔶 📍 Alerts
You can create alerts for both conditions:
• Swing High Confirmed
• Swing Low Confirmed
Recommended settings:
• Once per bar close
• Open-ended alert
With alerts enabled, TradingView will automatically notify you every time a new swing forms.
⸻
🔶 📍 No Repainting
Once a swing is confirmed and plotted, it will not change or disappear.
This makes the indicator reliable for real-time alerts and backtesting.
⸻
🔶 📍 Pine Script (v5)
Paste your indicator code here if you want it visible.
Or leave the code hidden if you are publishing as protected.
⸻
🔶 📍 Final Notes
• This indicator focuses on confirmation, not prediction
• It is designed for clean structure reading
• All markets supported: Forex, Crypto, Stocks, Indexes, Commodities
• Suitable for scalping, intraday, swing, and even higher-timeframe trading
If you find this tool helpful, feel free to give it a like and add it to your favorites ❤️
Your support helps me share more tools with the community!

CNagda-MomentumX - Institutional FlowMomentumX is designed to empower traders with a deeper understanding of market movements by focusing on Institutional Flow and advanced market structure analytics. The core goal is to identify and visualize where major market participants are operating, and to translate these complex footprints into clear, actionable trading signals — all in real time.
Real-time institutional activity mapping
Actionable entry and exit signals based on live market structure
Intuitive dashboard and dynamic chart visuals
Fully customizable modules for trend, liquidity, and order blocks
Core Logic Design
At the heart of MomentumX lies a robust algorithmic engine built to capture and surface institutional trading behavior. By leveraging advanced mathematical models, the indicator calculates institutional volume ratios and price momentum to pinpoint aggressive moves from large participants.
Institutional Volume & Price Momentum:
Utilizes custom volume indicators and price change analysis to detect strong buying or selling pressure, filtering out retail noise.
Liquidity Grab Detection & Activity Zones:
The script identifies liquidity grabs by monitoring abrupt price sweeps at major support/resistance levels—often where institutions trigger stop hunts or reversals. All critical activity zones are automatically color-coded on the chart for instant recognition.
Dashboard Visualization:
A fully dynamic dashboard table overlays live scores for accumulation, distribution, strength, and weakness—giving traders a real-time scan of market health.
Trendline & Order Block Architecture:
The logic auto-detects pivot highs/lows to draw smart trendlines, while the order block system highlights key reversal areas and breaker zones—making market structure clear and actionable.
MomentumX is packed with high-performance modules, each engineered to simplify complex market behavior and enhance decision-making for traders:
Institutional Flow Signals:
Instantly identifies spots where institutional players drive momentum, using unique volume and price activity analytics.
Bullish/Bearish Liquidity Grab Detection:
Marks abrupt price moves that signal stop hunts or reversals, letting traders anticipate snap-backs or trend shifts.
Trendline Auto-Detection:
Smartly draws trendlines based on significant swing highs and lows, automatically adjusting as price evolves.
Order Block System (Rejection/Breaker):
Spots and highlights key reversal zones with order block rectangles, confirming rejections or breakouts at strategic levels.
Dashboard and Bar Coloring:
A clean dashboard overlay presents live market scores, while dynamic bar coloring makes trend, strength, and high-activity periods instantly visible.
User Input Toggles for Each Module:
Every major feature is fully customizable—enable or disable modules to match individual trading setups or preferences.
Scripting/Development
MomentumX’s scripting process is modular, enabling clarity, scalability, and fast optimization throughout development:
Initialization & Inputs:
Start by defining all user input options, module toggles, color settings, and calculation parameters—ensuring maximum flexibility early on.
Core Calculation Functions:
Script advanced institutional volume and price momentum algorithms. Build out swing length logic, market state filters, and activity scoring methods.
Detection Engines:
Develop and integrate engines for liquidity grabs, automated trendline detection, and order block identification—each with dedicated functions for speed and precision.
Visual Overlays & Plotting:
Implement powerful plotting logic for colored bars, score dashboards, trendlines, reversal zones, and liquidity markers—making every data point clear and actionable on the chart.
Testing Handlers:
Add diagnostic panels and debug outputs to refine calculations and assure accuracy in every market environment.
Sample Trade Setups (Usage)
Cnagda MomentumX delivers clarity for multiple trading styles by providing timely, actionable setups grounded in institutional behavior and market structure. Here’s how traders can leverage the indicator for confident decision-making:
Liquidity Grab Reversal
Enter trades around detected liquidity grabs when price sweeps major support/resistance and the dashboard signals a momentum shift.
Example: Wait for a bullish/Bearish grab near market lows/high, with institutional flow turning positive/negative—enter long/short for potential mean reversion.
Order Block Breakout
Trade breakouts when price cleanly rejects or flips key order block zones highlighted on the chart.
Example: Short at a marked breaker block after a rejection signal, confirmed by a downward institutional activity spike.
Trendline Continuation
Ride established market moves by entering on trendline confirmations plotted by the auto-detect system.
Example: Go long after a trendline retest, confirmed by a green bar color and dashboard strength score.
Dashboard Confirmation
Combine dashboard metrics (strength, accumulation, distribution) with bar color overlays for multi-factor entries.
Example: Enter trades only when all market signals align in real time for maximum probability.
For Short Entry check -- Weakness : For Long Entry Check - Strength With Other Indications
MomentumX is not just another indicator – it’s your edge for reading the market like an insider. By transparently mapping institutional flow, uncovering hidden liquidity zones, and color-coding every major structure shift, MomentumX transforms complexity into actionable clarity. Whether you’re scalping, swing trading, or investing, you’ll gain a decisive, real-time advantage on every chart.
Embrace smarter decisions, adapt to changing market conditions instantly, and join a new generation of technically empowered traders.
Customize, observe, and let the market reveal opportunities in a way you’ve never experienced before.
Happy Trading

FlowSpike ES — BB • RSI • VWAP + AVWAP + News MuteThis indicator is purpose-built for E-mini S&P 500 (ES) futures traders, combining volatility bands, momentum filters, and session-anchored levels into a streamlined tool for intraday execution.
Key Features:
• ES-Tuned Presets
Automatically optimized settings for scalping (1–2m), daytrading (5m), and swing trading (15–60m) timeframes.
• Bollinger Band & RSI Signals
Entry signals trigger only at statistically significant extremes, with RSI filters to reduce false moves.
• VWAP & Anchored VWAPs
Session VWAP plus anchored VWAPs (RTH open, weekly, monthly, and custom) provide high-confidence reference levels used by professional order-flow traders.
• Volatility Filter (ATR in ticks)
Ensures signals are only shown when the ES is moving enough to offer tradable edges.
• News-Time Mute
Suppresses signals around scheduled economic releases (customizable windows in ET), helping traders avoid whipsaw conditions.
• Clean Alerts
Long/short alerts are generated only when all conditions align, with optional bar-close confirmation.
Why It’s Tailored for ES Futures:
• Designed around ES tick size (0.25) and volatility structure.
• Session settings respect RTH hours (09:30–16:00 ET), the period where most liquidity and institutional flows concentrate.
• ATR thresholds and RSI bands are pre-tuned for ES market behavior, reducing the need for manual optimization.
⸻
This is not a generic indicator—it’s a futures-focused tool created to align with the way ES trades day after day. Whether you scalp the open, manage intraday swings, or align to weekly/monthly anchored flows, FlowSpike ES gives you a clear, rules-based signal framework.

Fibo Swing MFI by julzALGOOVERVIEW
Fibo Swing MFI by julzALGO blends MFI → RSI → Least-Squares smoothing to flag overbought/oversold swings and continuously plot Fibonacci retracements from the rolling high/low of the last 200 bars. It’s built to spot momentum shifts while giving you a clean, always-current fib map of the recent market range.
CORE PRINCIPLES
Hybrid Momentum Signal
- Uses MFI to integrate price and volume.
- Applies RSI to MFI for momentum clarity.
- Smooths the result with Least Squares regression to reduce noise.
Swing Identification
- Marks potential swing highs when momentum is overbought.
- Marks potential swing lows when momentum is oversold.
Fixed-Window Fibonacci Mapping
- Always calculates fib levels from the highest high and lowest low of the last 200 bars.
- This keeps fib zones consistent, independent of swing point detection.
Visual Clarity & Non-Repainting Logic
- Clean labels for OB/OS zones.
- Lines and levels update only as new bars confirm changes.
Adaptability
- Works on any market and timeframe.
- Adjustable momentum length, OB/OS thresholds, and smoothing.
HOW IT WORKS
- Computes Money Flow Index (MFI) from price & volume.
- Applies RSI to the MFI for clearer OB/OS momentum.
- Smooths the hybrid with a Least Squares (linear regression) filter.
- Swing labels appear when OB/OS conditions are met (green = swing low, red = swing high).
- Fibonacci retracements are always drawn from the highest high and lowest low of the last 200 bars (rolling window), independent of swing labels.
HOW TO USE
- Watch for OB/OS flips to mark potential swing highs/lows.
- Use the 200-bar fib grid as your active map of pullback levels and reaction zones.
- Combine fib reactions with your price action/volume cues for confirmation.
- Works across markets and timeframes.
SETTINGS
- Length – Period for both MFI and RSI.
- OB/OS Levels – Overbought/oversold thresholds (default 70/30).
- Smooth – Least-Squares smoothing length.
- Fibonacci Window – Fixed at 200 bars in this version (changeable in code via fibLen).
NOTES
- Logic is non-repainting aside from standard bar/label confirmation.
- Increase Length on very low timeframes to reduce noise.
- Swing labels help context; fibs are always based on the most recent 200-bar high/low range.
SUMMARY
Fibo Swing MFI by julzALGO is a momentum-plus-price action tool that merges MFI → RSI → smoothing to identify overbought/oversold swings and automatically plot Fibonacci retracements based on the rolling high/low of the last 200 bars. It’s designed to help traders quickly see potential reversal points and pullback zones, offering visual confluence between momentum shifts and fixed-window price structure.
DISCLAIMER
For educational purposes only. Not financial advice. Trade responsibly with proper risk management.

Dynamic Swing Anchored VWAP (Zeiierman)█ Overview
Dynamic Swing Anchored VWAP (Zeiierman) is a price–volume tool that anchors VWAP at fresh swing highs/lows and then adapts its responsiveness as conditions change. Instead of one static VWAP that drifts away over time, this indicator re-anchors at meaningful structure points (swings). It computes a decayed, volume-weighted average that can speed up in volatile markets and slow down during quiet periods.
Blending swing structure with an adaptive VWAP engine creates a fair-value path that stays aligned with current price behavior, making retests, pullbacks, and mean reversion opportunities easier to spot and trade.
█ How It Works
⚪ Swing Anchor Engine
The script scans for swing highs/lows using your Swing Period.
When market direction flips (new pivot confirmed), the indicator anchors a new VWAP at that pivot and starts tracking from there.
⚪ Adaptive VWAP Core
From each anchor , VWAP is computed using a decay model (recent price×volume matters more; older data matters less).
Adaptive Price Tracking lets you set the base responsiveness in “bars.” Lower = more reactive, higher = smoother.
Volatility Adjustment (ATR vs Avg ATR) can automatically speed up the VWAP during spikes and slow it during compression, so the line stays relevant to live conditions.
█ Why This Adaptive Approach Beats a Simple VWAP
Standard VWAP is cumulative from the anchor point. As time passes and volume accumulates, it often drifts far from current price, especially in prolonged trends or multi-session moves. That drift makes retests rare and unreliable.
Dynamic Swing Anchored VWAP solves this in two ways:
⚪ Event-Driven Anchoring (Swings):
By restarting at fresh swing highs/lows, the VWAP reference reflects today’s structure. You get frequent, meaningful retests because the anchor stays near the action.
⚪ Adaptive Responsiveness (Volatility-Aware):
Markets don’t move at one speed. When volatility expands, a fixed VWAP lags; when volatility contracts, it can overreact to noise. Here, the “tracking speed” can auto-adjust using ATR vs its average.
High Volatility → faster tracking: VWAP hugs price more tightly, preserving retest relevance.
Low Volatility → smoother tracking: VWAP filters chop and stays stable.
Result: A VWAP that follows price more accurately, creating plenty of credible retest opportunities and more trustworthy mean-reversion/continuation reads than a simple, ever-growing VWAP.
█ How to Use
⚪ S wing-Aware Fair Value
Use the VWAP as a dynamic fair-value guide that restarts at key structural pivots. Pullbacks to the VWAP after impulsive moves often provide retest entries.
⚪ Trend Trading
In trends, the adaptive VWAP will ride closer to price, offering continuation pullbacks.
█ Settings
Swing Period: Number of bars to confirm swing highs/lows. Larger = bigger, cleaner pivots (slower); smaller = more frequent pivots (noisier).
Adaptive Price Tracking: Sets the base reaction speed (in bars). Lower = faster, tighter to price; higher = smoother, slower.
Adapt APT by ATR ratio: When ON, the tracking speed auto-adjusts with market volatility (ATR vs its own average). High vol → faster; low vol → calmer.
Volatility Bias: Controls how strongly volatility affects the speed. >1 = stronger effect; <1 = lighter touch.
-----------------
Disclaimer
The content provided in my scripts, indicators, ideas, algorithms, and systems is for educational and informational purposes only. It does not constitute financial advice, investment recommendations, or a solicitation to buy or sell any financial instruments. I will not accept liability for any loss or damage, including without limitation any loss of profit, which may arise directly or indirectly from the use of or reliance on such information.
All investments involve risk, and the past performance of a security, industry, sector, market, financial product, trading strategy, backtest, or individual's trading does not guarantee future results or returns. Investors are fully responsible for any investment decisions they make. Such decisions should be based solely on an evaluation of their financial circumstances, investment objectives, risk tolerance, and liquidity needs.

Expansion Triangle [TradingFinder] MegaPhone Broadening🔵 Introduction
The Expanding Triangle, also known as the Broadening Formation, is one of the key technical analysis patterns that clearly reflects growing market volatility, increasing indecision among participants, and the potential for sharp price explosions.
This pattern is typically defined by a sequence of higher highs and lower lows, forming within two diverging trendlines. Unlike traditional triangles that converge to a breakout point, the expanding triangle pattern becomes wider over time, leaving no precise apex for a breakout to occur.
From a price action perspective, the pattern represents a prolonged tug-of-war between buyers and sellers, where neither side has taken control yet. Each aggressive swing opens the door to new opportunities whether it's a trend reversal, range trading, or a momentum breakout. This dual nature makes the pattern highly versatile across market conditions, from exhausted trend ends to volatile consolidation zones.
The custom-built indicator for this pattern uses a combination of smart algorithms and detailed analysis of swing dynamics to automatically detect expanding triangles and highlight low-risk entry points.
Traders can use this tool to capitalize on high-probability setups from shorting near the upper edge of the structure with confirmation, to trading bearish breakouts during trend continuations, or entering long positions near the lower boundary during bullish reversals. The chart examples included in this article demonstrate these three highly practical trading scenarios in live market conditions.
A major advantage of this indicator lies in its structural filtering engine, which analyzes the behavior of each price leg in the triangle. With four adjustable filter levels from Very Aggressive, which highlights all potential patterns, to Very Defensive, which only triggers when price actually touches the triangle's trendlines the indicator ensures that only structurally sound and verified setups appear on the chart, reducing noise and false signals significantly.
Long Setup :
Short Setup :
🔵 How to Use
The pattern typically forms in conditions of heightened uncertainty and volatility, where price swings generate a series of higher highs and lower lows. The expanding triangle consists of three key legs bounded by diverging trendlines. The indicator intelligently analyzes each leg's direction and angle to determine whether a valid pattern is forming.
At the core of the indicator’s logic is its leg filtering system, which controls the quality of the pattern and filters out weak or noisy setups. Four structural filter modes are available to suit different trading styles and risk preferences. In Very Aggressive mode, filters are disabled, and the indicator detects any pattern purely based on the sequence of swing points.
This mode is ideal for traders who want to see everything and apply their own discretion.
In Aggressive mode, the indicator checks whether each new leg extends no more than twice the length of the previous one. If a leg overshoots excessively, the structure is invalidated.
In Defensive mode, the filter enforces a minimum movement requirement each leg must move at least 2% of the previous one. This prevents the formation of shallow, weak patterns that visually resemble triangles but lack substance.
The strictest setting, Very Defensive, combines all previous filters and additionally requires the price to physically touch the triangle’s trendlines before issuing a signal. This ensures that setups only appear when real market interaction with key structural levels has occurred, not based on assumptions or geometry alone. This mode is ideal for traders seeking maximum precision and minimal risk.
🟣 Bullish Setup
A bullish setup within the Expanding Triangle pattern occurs when price revisits the lower support boundary after a series of broad swings typically near the third leg of the formation. This area often represents a shift in momentum, where sellers begin to lose strength and buyers prepare to take control.
Ideally, the setup is accompanied by a bullish reversal candle (e.g. doji, pin bar, or engulfing) near the lower trendline. If the Very Defensive filter is active, the indicator will only issue a signal if price makes a confirmed touch on the trendline and reacts from that level. This significantly improves signal accuracy and filters out premature entries.
After confirmation, traders may choose to enter a long position on the bullish candle or shortly afterward. A logical stop-loss is placed just below the recent swing low within the pattern. The target can be set at or near the upper trendline, or projected using the full height of the triangle added to the breakout point. On higher timeframes, this reversal often marks the beginning of a strong uptrend.
🟣 Bearish Setup
A bearish setup forms when price climbs toward the upper resistance trendline, usually as the third leg completes. This is where buyers often begin to show exhaustion, and sellers step in with strength providing an ideal low-risk entry point for short positions.
As with the bullish setup, if the Candle Confirmation filter is enabled, the indicator will only show a signal when a bearish reversal candle forms at the point of contact. If Defensive or Very Defensive filters are also active, the setup must meet strict criteria of proportionate leg movement and an actual trendline touch to qualify.
Once confirmed, traders can enter on the reversal candle, placing a stop-loss slightly above the recent high. The target can be set at the lower trendline or calculated based on the triangle's full height, projected downward. This setup is particularly useful at the end of weak bullish trends or in volatile market tops.
🔵 Settings
🟣 Logic Settings
Pivot Period : Defines how many bars are analyzed to identify swing highs and lows. Higher values detect larger, slower structures, while lower values respond to faster patterns. The default value of 13 offers a balanced sensitivity.
Pattern Filter :
Very Aggressive : Detects all patterns based on point sequence with no structural checks.
Aggressive : Ensures each leg is no more than 2x the size of the previous one.
Defensive : Requires each leg to be at least 2% the size of the previous leg.
Very Defensive : The strictest level; only confirms patterns when price touches trendlines.
Candle Confirmation : When enabled, the indicator requires a valid confirmation candle (doji, pin bar, engulfing) at the interaction point with the trendline before issuing a signal. This reduces false entries and improves entry precision.
🟣 Alert Settings
Alert : Enables alerts for SSS.
Message Frequency : Determines the frequency of alerts. Options include 'All' (every function call), 'Once Per Bar' (first call within the bar), and 'Once Per Bar Close' (final script execution of the real-time bar). Default is 'Once per Bar'.
Show Alert Time by Time Zone : Configures the time zone for alert messages. Default is 'UTC'.
🔵 Conclusion
The Expanding Triangle pattern, with its wide structure and volatility-driven nature, represents chaos but also opportunity. For traders who can read its behavior, it provides some of the most powerful setups for reversals, breakouts, and range-based trades. While the pattern may seem messy at first glance, it is built on clear logic and when properly detected, it offers high-probability opportunities.
This indicator doesn’t just draw expanding triangles it intelligently evaluates their structural quality, validates price interaction through candle confirmation, and allows the trader to fine-tune the detection logic through adjustable filter levels. Whether you’re a reversal trader looking for a turning point, or a breakout trader hunting momentum, this tool adapts to your strategy.
In volatile or uncertain markets, where fakeouts and sudden shifts are common, this indicator can become a cornerstone of your trading system helping you turn volatility into structured, high-quality opportunities.

Liquidity Swings [Nix]Liquidity Swings Indicator!
It marks recent swing highs and lows on the chart using lines and labels.
Another great feature is that it tracks whether those swing levels are SWEPT (price crosses them again) and either:
Removes swept levels, or
Fades them to indicate they’ve been taken.
You can customize:
Number of swings shown.
Colors, styles, and visibility of lines/labels.
Whether to show highs, lows, or both.
Useful for liquidity analysis.
Usually when these special swings are swept, you can consider moving stops to BE. This is because there should be enough stop losses at the swing points to liquidate others and give more fuel to your trade direction!

Price Ranged FVG📌 Price Ranged FVG
Is a clean and efficient tool designed to detect Fair Value Gaps (FVGs) with adjustable filters and structural context. It’s especially useful for traders looking to filter out insignificant gaps and focus on high-probability areas, particularly around swing breaks or structural shifts.
🧠 What is a Fair Value Gap (FVG)?
A Fair Value Gap appears when there’s a price imbalance between candles — typically after a strong move — where the market skips over certain price levels without trading there. These zones can act as potential areas for price to return to (mean reversion), or serve as support/resistance depending on market structure.
🔍 FVG Detection Types
You can choose between three different detection modes under the "FVG Detection" input:
Same Type: Only detects FVGs where the last 3 candles are in the same direction (all bullish or all bearish).
All: Detects any FVG, regardless of candle direction.
Twin Close: Detects FVGs only when the last two candles are in the same direction and close accordingly — offering a stricter confirmation.
🎯 FVG % Filters
To filter out noise or insignificant gaps, this indicator includes:
Minimum FVG % Filter: Ignores FVGs smaller than your specified percentage of the current close.
Maximum FVG % Filter: Ignores overly large gaps that may be unreliable or caused by anomalies.
These filters help focus on relevant FVGs that are more likely to act as reaction zones.
🏛 Structural Context (Swing Highs and Lows)
The indicator plots swing highs and swing lows with dots to provide structure-based context:
Set Swing Strength to 3 for detecting internal structure (shorter-term moves).
Use a higher setting like 5 to focus on external structure (more significant highs/lows).
These levels can help you determine whether an FVG is forming within a consolidation, breakout, or key structural transition.
✅ Use Case (My Personal Workflow)
I personally use this indicator to:
Filter out weak or irrelevant FVGs using the % filters.
Watch for price interaction at swing breaks — especially when an FVG aligns with a break in internal or external structure.
Refine entry and exit planning in confluence with other tools or strategies.
⚠️ Disclaimer
This indicator is not financial advice. It is a technical analysis tool intended to support your own decision-making process. Always do your own research and risk management.

Pivot Swings w Table Pivot Swings w Table — Intraday Structure & Range Analyzer
This indicator identifies key pivot highs and lows on the chart and highlights market structure shifts using a real-time table display. It helps traders visually confirm potential trade setups by tracking unbroken swing points and measuring the range between the most recent pivots.
🔍 Features:
🔹 Automatic Pivot Detection using configurable left/right bar logic.
🔹 Unbroken Pivot Filtering — only pivots that haven't been invalidated by price are displayed.
🔹 Dynamic Range Table with:
Latest valid Pivot High and Pivot Low
Total Range Width
Upper & Lower 25% range thresholds (useful for value/imbalance analysis)
🔹 Trend-Based Color Coding — the table background changes based on which pivot (high or low) occurred more recently:
🟥 Red: Downward bias (last pivot was a lower high)
🟩 Green: Upward bias (last pivot was a higher low)
🔹 Optional extension of pivot levels to the right of the chart for support/resistance confluence.
⚙️ How to Use:
Adjust the Left Bars and Right Bars inputs to fine-tune how swings are defined.
Look for price reacting near the Upper or Lower 25% zones to anticipate mean reversion or breakout setups.
Use the trend color of the table to confirm directional bias, especially useful during consolidation or retracement periods.
💡 Best For:
Intraday or short-term swing traders
Traders who use market structure, support/resistance, or trend-based strategies
Those looking to avoid low-quality trades in tight ranges
✅ Built for overlay use on price charts
📈 Works on all symbols and timeframes
🧠 No repainting — pivots are confirmed with completed bars

Next level scolilay swing timerThe "Next Level Scolilay Swing Timer" is an advanced TradingView indicator designed to help traders navigate trends, reversals, and swing opportunities with ease. It's built around several key concepts like ATR filtering, ZigZag analysis, and momentum-based trend detection, making it a powerful tool for identifying market direction and key trading opportunities.
One of the standout features is its ability to filter candles using the Average True Range (ATR). This ensures that the indicator focuses on meaningful price movements rather than noise. You can tweak the ATR settings to suit your trading style, deciding how much historical data to consider or even turning the filter off completely if you prefer.
The script also integrates a ZigZag algorithm to detect pivot points, which it uses to evaluate swings in price action. This feature comes with customizable settings for depth and sensitivity, allowing you to adjust how the script reacts to price fluctuations. By analyzing these swings, the indicator identifies key highs and lows, which play a big role in determining whether the market is trending up or down.
When it comes to trends, the script is smart and flexible. It doesn't just look for higher highs or lower lows; it also considers momentum and retracement levels to decide if a trend is gaining strength or reversing. For example, it uses one-third retracement logic to spot sudden shifts in market direction, which can be critical for catching reversals early. You can also enable features like fast trend switching, which reacts to single-candle events that might signal a trend break.
Visualization is another area where this script shines. It marks uptrends and downtrends directly on the chart with clear labels, so you can instantly see when a new trend starts. Pink arrows appear above candles to signal potential downtrends, while yellow arrows below candles indicate possible uptrends. These signals combine multiple layers of analysis, like swing validation, ATR filtering, and trend confirmation, to give you reliable insights.
What makes the Swing Timer especially useful is its flexibility. Whether you’re a trend trader looking to ride major market moves, a swing trader focused on pivot points, or someone hunting for reversals, you can customize the settings to fit your needs. You can adjust everything from ZigZag and ATR parameters to how trends are labeled and filtered. The result is a tool that adapts to your trading style while still providing clear and actionable signals.
In short, this script brings together a range of advanced trading concepts into one user-friendly package. It’s perfect for traders who want to see market trends clearly, identify opportunities with confidence, and stay ahead of sudden reversals—all without getting bogged down in unnecessary complexity.

measure last swing [keypoems]MEASURE LAST SWING
Version: v0.0.7
An indicator for measuring market swings and calculating position sizing based on pivot points and risk parameters. Helps traders visualize price swings and automatically compute position sizes based on their desired risk amount.
FEATURES:
• Identifies and tracks last pivot point in price action
• Displays visual measurements of price swing
• Calculates position sizes based on risk parameters
• Supports major futures contracts with automatic multiplier detection
HOW IT WORKS:
The indicator detects pivot highs and lows using your specified pivot strength, then draws measurement lines and calculates position sizes based on your risk parameters. It automatically cleans up old drawings when new pivot points are identified.
INPUT PARAMETERS:
General Settings:
• Risk Amount - Amount you want to risk per trade
• Pivot Strength - Bars required on either side to confirm a pivot
• Offset - Number of bars to offset the vertical line
Visual Settings:
• Horizontal and Vertical Lines - Customizable colors, widths (1-4), and styles
• Labels - Adjustable text color and size
CONTRACT MULTIPLIERS:
Automatically detects and applies the correct multiplier:
• ES (E-mini S&P 500): 50.0
• MES (Micro E-mini S&P 500): 5.0
• NQ (E-mini Nasdaq): 20.0
• MNQ (Micro E-mini Nasdaq): 2.0
• YM (E-mini Dow): 5.0
• MYM (Micro E-mini Dow): 0.5
• Other symbols: 1.0 (default)
DISPLAY ELEMENTS:
1. Horizontal line showing the level of the last pivot point
2. Vertical line measuring the distance to current price
3. Distance label showing point distance
4. Risk/Position label showing risk amount and calculated position size
POSITION SIZING:
Position Size = Floor(Risk Amount / (Distance in Points × Contract Multiplier))
IDEAL FOR:
• Measuring price swings for technical analysis
• Position sizing based on risk management rules
• Identifying potential entry and exit points
• Visual analysis of market structure
• Risk management automation

Top-Down Trend and Key Levels with Swing Points//by antaryaami0
Overview
The “Top-Down Trend and Key Levels with Swing Points” indicator is a comprehensive tool designed to enhance your technical analysis by integrating multiple trading concepts into a single, easy-to-use script. It combines higher timeframe trend analysis, key price levels, swing point detection, and ranging market identification to provide a holistic view of market conditions. This indicator is particularly useful for traders who employ multi-timeframe analysis, support and resistance levels, and price action strategies.
Key Features
1. Higher Timeframe Trend Background Shading:
• Purpose: Identifies the prevailing trend on a higher timeframe to align lower timeframe trading decisions with the broader market direction.
• How it Works: The indicator compares the current higher timeframe close with the previous one to determine if the trend is up, down, or ranging.
• Customization:
• Trend Timeframe: Set your preferred higher timeframe (e.g., Daily, Weekly).
• Up Trend Color & Down Trend Color: Customize the background colors for uptrends and downtrends.
• Ranging Market Color: A separate color to indicate when the market is moving sideways.
2. Key Price Levels:
• Previous Day High (PDH) and Low (PDL):
• Purpose: Identifies key support and resistance levels from the previous trading day.
• Visualization: Plots horizontal lines at PDH and PDL with labels.
• Customization: Option to show or hide these levels and customize their colors.
• Pre-Market High (PMH) and Low (PML):
• Purpose: Highlights the price range during the pre-market session, which can indicate potential breakout levels.
• Visualization: Plots horizontal lines at PMH and PML with labels.
• Customization: Option to show or hide these levels and customize their colors.
3. First 5-Minute Marker (F5H/F5L):
• Purpose: Marks the high or low of the first 5 minutes after the market opens, which is significant for intraday momentum.
• How it Works:
• If the first 5-minute high is above the Pre-Market High (PMH), an “F5H” label is placed at the first 5-minute high.
• If the first 5-minute high is below the PMH, an “F5L” label is placed at the first 5-minute low.
• Visualization: Labels are placed at the 9:35 AM candle (closing of the first 5 minutes), colored in purple by default.
• Customization: Option to show or hide the marker and adjust the marker color.
4. Swing Points Detection:
• Purpose: Identifies significant pivot points in price action to help recognize trends and reversals.
• How it Works: Uses left and right bars to detect pivot highs and lows, then determines if they are Higher Highs (HH), Lower Highs (LH), Higher Lows (HL), or Lower Lows (LL).
• Visualization: Plots small markers (circles) with labels (HH, LH, HL, LL) at the corresponding swing points.
• Customization: Adjust the number of left and right bars for pivot detection and the size of the markers.
5. Ranging Market Detection:
• Purpose: Identifies periods when the market is consolidating (moving sideways) within a defined price range.
• How it Works: Calculates the highest high and lowest low over a specified period and determines if the price range is within a set percentage threshold.
• Visualization: Draws a gray box around the price action during the ranging period and labels the high and low prices at the end of the range.
• Customization: Adjust the range detection period and threshold, as well as the box color.
6. Trend Coloring on Chart:
• Purpose: Provides a visual cue for the short-term trend based on a moving average.
• How it Works: Colors the candles green if the price is above the moving average and red if below.
• Customization: Set the moving average length and customize the uptrend and downtrend colors.
How to Use the Indicator
1. Adding the Indicator to Your Chart:
• Copy the Pine Script code provided and paste it into the Pine Script Editor on TradingView.
• Click “Add to Chart” to apply the indicator.
2. Configuring Inputs and Settings:
• Access Inputs:
• Click on the gear icon next to the indicator’s name on your chart to open the settings.
• Customize Key Levels:
• Show Pre-Market High/Low: Toggle on/off.
• Show Previous Day High/Low: Toggle on/off.
• Show First 5-Minute Marker: Toggle on/off.
• Set Trend Parameters:
• Trend Timeframe for Background: Choose the higher timeframe for trend analysis.
• Moving Average Length for Bar Color: Set the period for the moving average used in bar coloring.
• Adjust Ranging Market Detection:
• Range Detection Period: Specify the number of bars to consider for range detection.
• Range Threshold (%): Set the maximum percentage range for the market to be considered ranging.
• Customize Visuals:
• Colors: Adjust colors for trends, levels, markers, and ranging market boxes.
• Label Font Size: Choose the size of labels displayed on the chart.
• Level Line Width: Set the thickness of the lines for key levels.
3. Interpreting the Indicator:
• Background Shading:
• Green Shade: Higher timeframe is in an uptrend.
• Red Shade: Higher timeframe is in a downtrend.
• Gray Box: Market is ranging (sideways movement).
• Key Levels and Markers:
• PDH and PDL Lines: Represent resistance and support from the previous day.
• PMH and PML Lines: Indicate potential breakout levels based on pre-market activity.
• F5H/F5L Labels: Early indication of intraday momentum after market open.
• Swing Point Markers:
• HH (Higher High): Suggests bullish momentum.
• LH (Lower High): May indicate a potential bearish reversal.
• HL (Higher Low): Supports bullish continuation.
• LL (Lower Low): Indicates bearish momentum.
• Ranging Market Box:
• Gray Box Around Price Action: Highlights consolidation periods where breakouts may occur.
• Range High and Low Labels: Provide the upper and lower bounds of the consolidation zone.
4. Applying the Indicator to Your Trading Strategy:
• Trend Alignment:
• Use the higher timeframe trend shading to align your trades with the broader market direction.
• Key Levels Trading:
• Watch for price reactions at PDH, PDL, PMH, and PML for potential entry and exit points.
• Swing Points Analysis:
• Identify trend continuations or reversals by observing the sequence of HH, HL, LH, and LL.
• Ranging Market Strategies:
• During ranging periods, consider range-bound trading strategies or prepare for breakout trades when the price exits the range.
• Intraday Momentum:
• Use the F5H/F5L marker to gauge early market sentiment and potential intraday trends.
Practical Tips
• Adjust Settings to Your Trading Style:
• Tailor the indicator’s inputs to match your preferred timeframes and trading instruments.
• Combine with Other Indicators:
• Use in conjunction with volume indicators, oscillators, or other technical tools for additional confirmation.
• Backtesting:
• Apply the indicator to historical data to observe how it performs and refine your settings accordingly.
• Stay Updated on Market Conditions:
• Be aware of news events or economic releases that may impact market behavior and the effectiveness of technical levels.
Customization Options
• Time Zone Adjustment:
• The script uses “America/New_York” time zone by default. Adjust the timezone variable in the script if your chart operates in a different time zone.
var timezone = "Your/Timezone"
• Session Times:
• Modify the Regular Trading Session and Pre-Market Session times in the indicator settings to align with the trading hours of different markets or exchanges.
• Visual Preferences:
• Colors: Personalize the indicator’s colors to suit your visual preferences or to enhance visibility.
• Label Sizes: Adjust label sizes if you find them too intrusive or not prominent enough.
• Marker Sizes: Further reduce or enlarge the swing point markers by modifying the swing_marker_size variable.
Understanding the Indicator’s Logic
1. Higher Timeframe Trend Analysis:
• The indicator retrieves the closing prices of a higher timeframe using the request.security() function.
• It compares the current higher timeframe close with the previous one to determine the trend direction.
2. Key Level Calculation:
• Previous Day High/Low: Calculated by tracking the highest and lowest prices of the previous trading day.
• Pre-Market High/Low: Calculated by monitoring price action during the pre-market session.
3. First 5-Minute Marker Logic:
• At 9:35 AM (end of the first 5 minutes after market open), the indicator evaluates whether the first 5-minute high is above or below the PMH.
• It then places the appropriate label (F5H or F5L) on the chart.
4. Swing Points Detection:
• The script uses ta.pivothigh() and ta.pivotlow() functions to detect pivot points.
• It then determines the type of swing point based on comparisons with previous swings.
5. Ranging Market Detection:
• The indicator looks back over a specified number of bars to find the highest high and lowest low.
• It calculates the percentage difference between these two points.
• If the difference is below the set threshold, the market is considered to be ranging, and a box is drawn around the price action.
Limitations and Considerations
• Indicator Limitations:
• Maximum Boxes and Labels: Due to Pine Script limitations, there is a maximum number of boxes and labels that can be displayed simultaneously.
• Performance Impact: Adding multiple visual elements (boxes, labels, markers) can affect the performance of the script on lower-end devices or with large amounts of data.
• Market Conditions:
• False Signals: Like any technical tool, the indicator may produce false signals, especially during volatile or erratic market conditions.
• Not a Standalone Solution: This indicator should be used as part of a comprehensive trading strategy, including risk management and other forms of analysis.
Conclusion
The “Top-Down Trend and Key Levels with Swing Points” indicator is a versatile tool that integrates essential aspects of technical analysis into one script. By providing insights into higher timeframe trends, highlighting key price levels, detecting swing points, and identifying ranging markets, it equips traders with valuable information to make more informed trading decisions. Whether you are a day trader looking for intraday opportunities or a swing trader aiming to align with the broader trend, this indicator can enhance your chart analysis and trading strategy.
Disclaimer
Trading involves significant risk, and it’s important to understand that past performance is not indicative of future results. This indicator is a tool to assist in analysis and should not be solely relied upon for making trading decisions. Always conduct thorough research and consider seeking advice from financial professionals before engaging in trading activities.

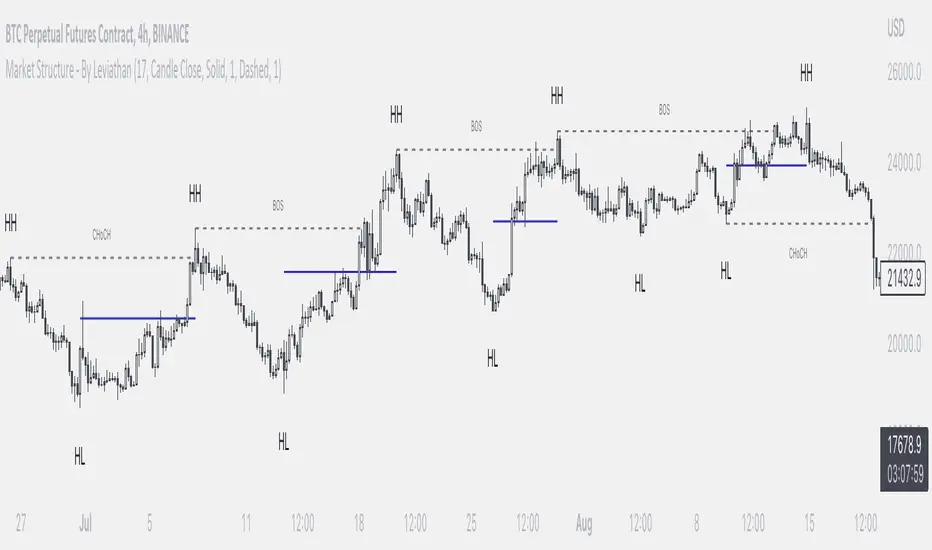
Market Structure - By LeviathanThis indicator helps you identify market structure by plotting swing highs and lows (HH, LH, HL, LL), BOS/CHOCH and 0.5 retracement levels. Other functionalities will be added in future updates.
Indicator Settings Overview
SWING LENGTH
The number of leftbars and rightbars when searching for swing points. The lower the value, the more swing points are shown and the higher the value, the less swing points are shown. I suggest adjusting it to fit your style and when switching between different timeframes.
BOS CONFIRMATION
Choose whether a Break of Structure is determined by a candle close or a wick breaching previous swing point. Using the "Wick" confirmation option will result in more breaks of structure.
CHOCH
Turning this ON renames the first counter trend Break of Structure (BOS) to CHoCH (Change of Character) and therefore signaling a possible trend shift.
SHOW 0.5 RETRACEMENT LEVEL
This will show a level halfway between a swing low and a swing high of an expansion move, which can act as an approximate retracement point if the trend continues.
In uptrends, 0.5 level is drawn between Higher Lows (HL) and Higher Highs ( HHs ). Long entries can be placed around that level if you suspect that the uptrend will continue.
In downtrends, 0.5 level is drawn between Lower Highs (LH) and Lower Lows (LLs). Short entries can be placed around that level if you suspect that the downtrend will continue.
PA Swings [TTA]Hello traders!
This script helps identify swing high levels of resistance and swing low levels of support via price action.
The indicator is designed to help identify support and resistance by measuring retracements. When the retracement has reached the threshold, the indicator identifies the high or low with a horizontal, solid line.
This line will continue until it is violated. Once it is violated it will adjust to a dashed line and continue until it is violated again (retested).
Therefore, a solid line resembles an unviolated swing level; a dashed line resembles a violated swing level that has yet to be retested.
Ideally, this script will filter some movements by identifying impulses in the market. Knowing that price is in a trending move rather than bouncing around in a range can help traders in their analysis. In range bound conditions the indicator will show small impulses, sometimes trapped by a support and/or resistance line. In trending markets there will be separation between the support and resistance lines.
Retests are also identified by the indicator.
Retests of swing highs and lows may induce precise, repeatable price moves - something a trader might find advantageous. A log is included to help identify potential price levels based on historical actions when an impulse or a retest occurs.
Consequently, this may help traders identify take-profit targets and avoid stop losses that are too close to the entry point.
The indicator has a color identity panel to help you get familiar with the colored lines, line types, and what they mean. The color panel is concealable. Additional customization options are available, such as toggling the chart labels. These labels distinguish impulses up and down, retests, and the distance price has traveled since breaking or creating a support or resistance level.
This can be toggled off. A High-Volume Swings only option is available for those that wish to filter out low volume movements (such as extended market hours).
You also have the option of hiding far away lines and can define what is “far away” for them % wise. It is defaulted to 15% which may need to be adjusted on lower timeframes.
Inactive lines can be shown or they can be removed in the settings as well. While this indicator can find some great levels of support or resistance it is important to remember that, should you find this script helpful, it is a tool in your toolbox!! (:
Hope you enjoy and thank you for checking this out!

Mark StructureMark Structure is building the market swing structure, minor and sub structure and marks all possible insignificant pivots
Building such structure is really complex task to do, that has a lot of obstacles and challenges. I'm doing my best to develop this indicator behaving in absolutely expectable and right way. Fill free to leave any comments or bug reports.
it supports:
- Marking all pivots with labels or join them continuously with trend lines.
- Marking minor and sub structured swings with labels or join them continuously with trend lines. Marking BOS or SMS BOS, which are mbos. Minor and substructure are structures inside swing structure and it can differ from the structure of lower timeframe
- Marking swings of swing structure with labels or join them continuously with trend lines. Marking BOS or SMS BOS of swing structure
- Changing bullish and bearish colors of each kind of structures
- Changing pivot labelings
- Changing colors of BOSs
Remarks:
- As I told you guys before, it has a lot of challenging cases. eg we have swing low and high on the same candle and in order to decide which pivot goes first I take lower time frame data to figure out what pivot is the first, but it happens that on lower time frame the same issue takes place, due to limitation of TradingView I can't go infinitely to lower timeframes to solve this issue, so I mark those cases with labels
- Another issue is very beginning of the trend its hard to detect swing structure there due to missing historical data. so skip a few waves in the very beginning
- Don't expect to have minor and sub structure in each swing waves, its totally fine when you don't have them at all
- Swing structure is the most significant structure and shows real price direction. Trend change is confirmed when for bull->bear the last HLbull LH>HH and HH-HL-HH are confirmed. You can change labelling for unconfirmed swing trend in the settings. By default its already done
