RedK Chop & Breakout Scout (C&B_Scout)The RedK Chop & Breakout Scout (C&BS or just CBS) is a centered oscillator that helps traders identify when the price is in a chop zone, where it's recommended to avoid trading or exit existing trades - and helps identify (good & tradeable) price breakouts.
i receive many questions asking for simple ways to identify chops .. Here's one way we can do that.
(This is work in progress - i was exploring with the idea, and wasn't sure how interesting other may find it. )
Quick Intro:
==================
Quick techno piece: This concept is similar to a Stochastic Oscillator - with the main difference being that we're utilizing units of ATR (instead of a channel width) to calculate the main indicator line - which will then lead to a non-restricted oscillator (rather than a +/- 100%) - given that ATR changes with the underlying and the timeframe, among other variables.
to make this easy, and avoid a lot of technical speak in the next part, :) i created (on the top price panel) the same setup that the C&B Scout represents as a lower-panel indicator.
So as you read below, please look back and compare what C&BS is doing in its lower panel, with how the price is behaving on the price chart.
how this works
========================
- To identify chops and breakouts, we need to first agree on a definition that we will use for these terms.
- for the sake of this exercise, let's agree that the price is in a chop zone, as long as the price is moving within a certain distance from a "price baseline" of choice ( which we can adjust based on the underlying, the volatility, the timeframe, the trading style..etc)
- when the price moves out of that chop zone, we consider this a breakout
- Now not all breakouts are "good" = they need to at least happen in the direction of the longer term trend. In this case, we can apply a long Moving Average to act as a filter - and consider breakouts to be "good" if they are in the same direction as the filter line
- With the above background in mind, we establish a price baseline (as you see on the top panel, this is based on the midline of a Donchian Channel - but we can use other slow moving averages in future versions)
- we will decide how far above/below that baseline is considered to be "chop zone" - we do this in terms of units of Average True Range (ATR) - using ATR here is valuable for so many reasons, most of all, how it adjusts to timeframe and volatility of underlying.
- The C&B Scout line simply calculates how far the price is above/below the baseline in terms of "ATR units". and shows how that value compares to our own definition of a "chop zone"
- so as long as the price is within the chop zone, the CBS line will be inside the shaded area - and when the price "breaks out" of the chop zone, the CBS line will also breakout (or down) from the chop zone.
- C&B Scout will give a visual clue to help take trades in the direction of the prevailing trend - the chop zone is green when the price is in "long mode", as in, the price is above the filter line - and will be red when we are in "short mode" - so the price is below the filter line. in green mode, we should only consider breakouts to the upside, and ignore breakouts to the downside (or breakdowns) - in red mode, we should only consider breakouts to the downside., and ignore the ones to the upside.
- i added some examples of "key actions" on the chart to help explain the approach here further.
Usage & settings Notes:
========================
- even though for many traders this will be a basic concept/setup, i still highly suggest you spend time getting used to how it works/reacts and adjusting the settings to suit your own trading style, timeframe, tolerance, what you trade....etc
- for example, if i am a conservative trader, i may consider any price movement within 1 x ATR above and below the baseline to be in "chop" (ATR Channel width = 2 x ATR) - and i want to only take trades when the price moves outside of that range *and* in the direction of the prevailing trend
- An aggressive trader may use a smaller ATR-based value, say 0.5 x ATR above/below the baseline, as their chop zone.
- A swing trader may use a shorter filter line and focus on the CBS line crossing the 0 line.
- .... and so on.
- Also note that the "tradeable" signal is when the CBS line "exits" the chop zone (upward on green background, or downward on red background) - however, an aggressive trader may take the crossing of the CBS line with the 0 line as the signal to open a trade.
- As usual please do not use this indicator "in isolation" and ensure you have other confirming signals from your setups before trading.
conclusion
===========
As i mentioned, this is really a simple concept - and i'm a big fan of those :) -- and there's so much that could be done to expand around it (add more visuals/colors, add alerts, add options for ATR calculation, Filter line calculations, baseline..etc) - but with this v1.0, i wanted to share this initially and see how much interest and how valuable fellow traders find it, before playing any further with it. so please be generous with your comments.
Search in scripts for "swing"

LNL Pullback ArrowsBuying the dip has never been easier! LNL Pullback Arrows are here to pinpoint the best possible entries for the trend following setups. With the Pullback Arrows, trader can pick his own approach and risk level thanks to four different types of arrows. The goal of these arrows is to force the traders to scale in & out of trades which is in my opinion crucial when it comes to trend following strategies. These arrows were designed primarily for the daily & weekly time frame (swing trading).
Four Types of Pullback Arrows:
1. Aggro Arrows - Ideal for aggresive approach during parabolic trends. Sometimes trends are so strong that the price barely revisits the daily 8 EMA. This is where the aggro arrows can perfectly pinpoint the aggresive high risk entries. Ideal for halfsize or 1/4 size of the full position. Aiming for quick 1-2 day moves targeting the recent high/low. These arrows could be also named as scalping arrows for the swing traders. A quick In & Out.
2. HalfSize Arrows - Medium risk approach. First arrows to scale in. HalfSize arrows are the first sign that the pullback might be ending, yet there is still some space left for an even deeper pullback. That is the reason why they are called half-size. Ideally taken with half-sized position. When trading the HalfSize Arrows, It is better to have some "spare ammo in the gun" ready to use.
3. FullSize Arrows - Regular risk approach. These arrows represent a zone where the core of the posititon should be taken. The point of validity for the trend is not that far away, meaning the risk can be kept tight. Ideal for scailing the other halfs or quarters of the full position. Also great for more conservative traders or environments with higher volatility.
4. Rare Arrows - Offer the best risk to reward entries during the trend. Rare Arrows should be the "last kick" of the retracement, therefore stops can be positioned really tight. They either trigger the stop immidiately or they provide another juicy leg up or down in the direction of the trend. However, they really do appear rarely.
Simple EMA Cloud:
A simple cloud based on 21 and 55 exponential moving averages. This default length creates a pullback zone that is wide enough for the conservative traders but also give the opportunities to more aggresive traders. Alternatives such as 8 & 21, or 21 & 34 are forming the zone that is too aggresive and usually too thin. Of course, cloud can be fully adjusted or turned off completely. The only role of the cloud is to gauge the trend.
Tips & Tricks:
1.Importance of the Scailing
- As already stated, scailing is crucial to this since there is no way of knowing the exact level at which the price magically bounce every time. It is hard to tell where and which EMA will be respected. How can we know it will be 21 EMA every time? or 34 EMA or 10 EMA or 100 SMA or 50 DMA ... Single MA does not make a trend. This is the reason why scailing is so important. Scailing can make a difference.
2. Nothing is Perfect
- Same as any other study, nothing works 100% perfectly. Sometimes the setup will go right against you and sometimes the price will fade away sideways and breaks off the structure of the trend. This is not a magic certainty tool. This is just another probability tool.
3. Point of Validity & Other Studies
- Even though the pullback arrows can be a stand-alone strategy. It is important to use other indicators that visualize the actual trend. Whether its EMA Cloud or EMAs or DMI Bars or Keltner Channels, there should be something that validates the trend, something that tells the trend is over. (Pullback Arrows are not showing the actual stops!).
Hope it helps.

Booz StrategyBooz Backtesting : Booz Backtesting is a method for analyzing the performance of your current trading strategy . Booz Backtesting aims to help you generate results and evaluate risk and return without risking real capital.
The Booz Backtesting is the Booz Super Swing Indicator equivalent but gives you the ability to backtest data on different charts.
This is an Indicator created for the purpose of identifying trends in Multiple Markets, it is based on Moving Average Crossover and extra features.
Swing Trading: This function allows you to navigate the entire trend until it is not strong enough, so you can compare it with fixed parameters such as Take Profit and Stop Loss.
Take Profit and Stop Loss function: With this function you will be able to choose the most optimal parameters and see in real time the results in order to choose the best combination of parameters.
Leverage : We have this function for the futures markets where you can check which is the most appropriate leverage for your operation.
Trend Filter: allows you to take multiple entries in the same direction of the market.
If the market crosses below the 200 moving average, it will take only short entries.
If the market crosses above the 200 moving average, it will take only long entries.
Timeframes
Charting from 1 Hour, 4 Hour, Daily, Weekly, Weekly
Markets :Booz Backtesting can be tested in Cryptocurrency, Stocks and Futures markets.
Background Color : at a glance, you can see what cycle the market is in.
Green background : Shows that the market is in a bullish cycle.
Red background: Shows that the market is in a bearish cycle.

Infiten's Return Candle OscillatorInfiten's Return Candle Oscillator is an oscillator which shows the percentage return on the open, high, close and low over a customizable period in the form of candlesticks. It may be helpful for seeing volatility, swing trading, or mean reversion trading.
The RCO consists of two plotted elements :
RCO Candles (short length): candlesticks which are plotted with low = the product of the percentage changes in the low over a period, high = the product of the percentage changes in the high over a period, close = the product of the percent changes in close over a period, and open = the product of the percentage changes in return over a period. Similarly to with standard candlesticks, if the percentage change on the close is higher than the percentage change on the open, the candlestick is green, otherwise it is red.
Smoothed RCO Line (long length) : a moving average of the average of the low, close, open and high calculated for the RCO Candles. The line's transparency is determined by the percentage difference between the RCO and the highest or lowest RCO over the long length. A more transparent line means that the RCO is closer to the highest or lowest RCO, and may be indicative of a reversal, or weakening trend.

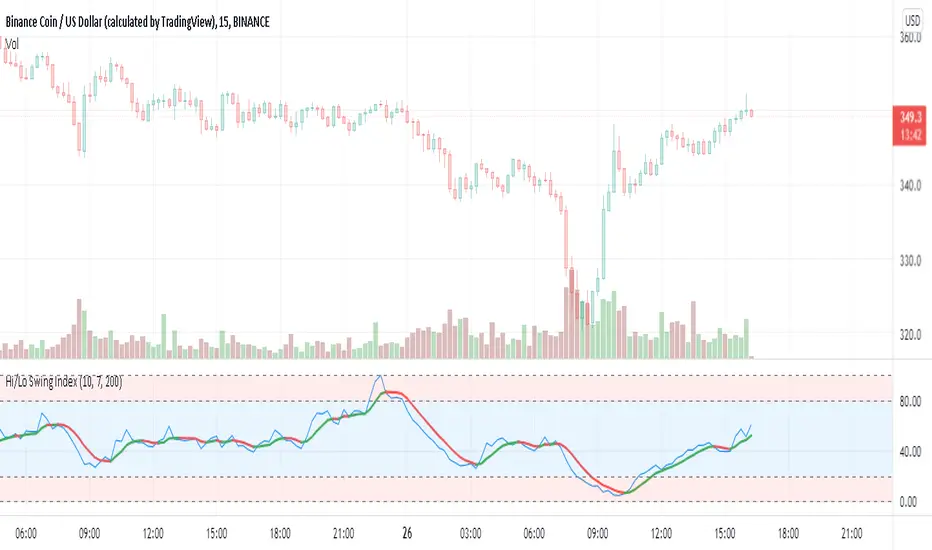
Hi/Lo Swing Index [by hajixde]Author: Hajixde
This indicator illustrates the High-to-Low variation. It works nicely on shorter time frames.
The index value is calculated based on the observation length (Memory Length). By changing this input, you can have a wider or shorter observation range.
MA Length is the moving average filter length, which smooths out the signal.
There is an additional smoothing function to make the output even smoother (Smoothing Length). Remember, that "Smoothing Length" is better to be less than "MA Length".
You may activate the trend direction.
RedK Magic RibbonRedK Magic Ribbon is simple script that combines a fast and a slow moving averages to create a 2-Moving Average Cross-over / trend visualization tool.
We utilize the Compound Ratio Weighted Average (CoRa Wave) as the fast MA line and the RedK Slow Smooth Weighted Moving Average (RSS_WMA) aka LazyLine as the slow MA line.
i put this script together when i found that i started using these 2 moving average lines in my trading charts most of the time. thought others may find it useful.
The simple idea is that when the 2 lines "agree" on direction, then this is possibly a confirmed trend in that direction.
Visually, when the 2 lines agree on a trend direction, Magic Ribbon gives either a green (up) or red (down) fill, when they disagree, it gives a gray fill - Gray areas are considered "no trade" or "get ready" zones depending on the situation.
This ribbon can be used to support trend-following trades, swing trading, or as a visual trend tracking tool
Suggested Usage Tips:
----------------------------
* Position entry should be made as close to the RSS_WMA/LazyLine as possible to maximize gain.
* The RSS_WMA can act as a guide for Stop Loss
* An aggressive (or swing) trader may consider entries as soon as the CoRa Wave line changes color, but in context of the prevailing trend.
* if you intend to use this tool for trading, please test it using the PaperTrading or Rewind features of TV to get used to how it behaves and adjust accordingly.
* The Magic Ribbon should work on any timeframe.
* The basic settings are available - they enable adjusting the length and smoothness of the CoRa Wave and the Smoothness of the RSS_WMA - as well as the source price for each. Style settings enable to adjust color, line width, or hide/show various elements as needed.
* The most important tip for using the Magic Ribbon: when you first add it to your chart, is to fine-tune the length settings to your preference. start by adjusting the LazyLine (RSS_WMA) Smoothness value, so it tracks and barely touches the highs / lows of price bars - with the least amount of lag possible - then adjust the CoRa Wave length to make it as responsive as you need. Keep smoothness to the lowest you can use (i like 3 or 4 max) - the default settings are generic usable values based on my testing.
* as usual, please use this tool only as a guide - make your own detailed chart analysis and support your trading decision with signals and confirmations from other indicators .
*** This script does not repaint.

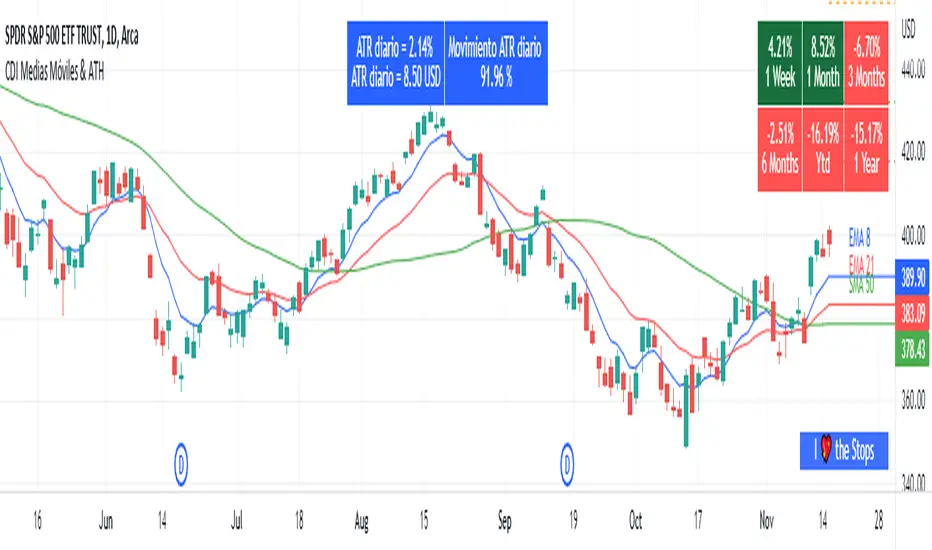
Moving Average and PerformanceThis indicator combines several tools that are used daily for analysis:
The performance of the action we are seeing.
The percentage of retracement the stock has made from its all time high.
Possibility of using up to four exponential or simple moving averages in the length we want.
It allows to see or not the levels of four moving averages in daily temporality.
This indicator is unique since it allows you to see in real time the performance of the Stock or ETF that is being analyzed, which allows you to make a timely decision for short, medium or long-term investments.
If you are doing scalping, swing, or intraday trading, you can see the retracement it has made from the ATH (3, 5, 10 or 13%) which can become Supports or Resistances where the price can rebound, Likewise, the levels of the moving averages in 1D temporality can be observed at the same time, which are usually dynamic supports or resistances and it can also be observed in the same temporality of the chart four moving averages that the trader can configure in the length that you deem convenient to improve your analysis and make decisions as quickly as possible.
Este indicador es único ya que permite ver en tiempo real el rendimiento de la Acción o ETF que se está analizando, lo cual permite tomar una decisión oportuna para las inversiones a corto, mediano o largo plazo.
Si se está haciendo trading tipo scalping, swing, o intradía, se puede observar el retroceso que ha hecho desde el ATH (3, 5, 10 o 13%) el cual puede convertirse en Soportes o Resistencias en donde el precio puede hacer rebotes, así mismo se pueden estar observando al mismo tiempo los niveles de las medias móviles en temporalidad de 1D, los cuales usualmente son Soportes o resistencias dinámicas y también se puede observar en la misma temporalidad del gráfico cuatro medias móviles que el trader puede configurar en la longitud que crea conveniente para mejorar su análisis y tomar decisiones lo más rápido posible.
Dual Mean Reversion Channel (adjusted lower band)This is a public and open-source lighter version compared to the "Overextended Price Channel" which is provided complimentaty to the Trend Insight System.
Introduction :
Channels are very useful tools to assess overextended price, volatility and upcoming retracement or impulsive moves (such as Bollinger Band squeezes). It is an indispensable addition to any trader using Mean Reversion theory for a scalp-trade or swing-trade.
This script contains :
- 2 channels Keltner-style, using the True Range for volatility
- customizable volatility (channel width) and smoothing period
- a standard selection of moving average ; SMA, EMA, VWMA
- an embedded readjustment of the lower bands to avoid the drop on a logarithmic scale (see explanation below)
Why another channel indicator ?
I have found most conventional channels to be either not based on "proper" volatility (e.g. standard deviation of price action for Bollinger Band), or the bottom channel to be ill adapted to the logarithmic scale and plunges to 0 on some high volatility periods, messing with readability on logarithmic auto-scaled chart.
Also, I find the channels to be most useful when superimposed with another one of longer length; especially a pair of channels with a 50 and 200 period moving average respectively. Mean Reversion traders that mostly trade the 50 and 200 SMA/EMA know what I am talking about as having a channel helps to have a better visual for a proper of entry and exit point.
Disclaimer :
This indicator was originally intended to be used along with the Trend Insight System to improve performance, and the default configuration mostly backtested on BTCUSD.
Please use with caution, proper risk management and along with your favorite oscillator, candlestick reading and signals system.
Some explanation :
Based on Mean Reversion paradigm, everything has a tendency to revert back to the mean :
- when the price enters the upper channel, it is supposed to be (or start getting) overbought as the market is getting overheated, thus prone to correction,
- on the other hand, when the price enters the lower channel, it is supposed to be (or getting) oversold and the market looks favorable for a buy-in.
Depending on the trading style used, a trader will usually either wait until the price leaves the channel towards the mean before taking action (conservative style) or you will set limit orders inside the channel as you expect a reversion to the mean (more agressive/risky style).
With two channels, more complex (and maybe precise) rules can be built to optimize one's trading strategy.
Important notes :
In the end, sticking with 50/200 length and a single setting on volatility might be wiser, be wary of overoptimization which is risky at best and counter productive at worst (according to legendary traders such as Mark Douglas). Even if, needless to say, the volatility needs to be adjusted between a nascent and volatile market (such as crypto) compared to standard call markets that are much less volatile.
End notes :
It will always be considered a work in progress to help bring out the best of trading with channels, any comment and suggestion are welcomed.

EMA+RSI Pump & Drop Swing Sniper (With Alerts)This is using an EMA and RSI with slightly modified settings to give good entry and exit points while looking at Bitcoin. I use this on a 4-hour chart and with other indicators to find good positions to enter a trade or exit if things are turning red.
If you click on the EMA line it will color the bars of the chart based on if they are above or below the EMA - This is just visually helpful for me to see the active trend.
Make sure you hover over or click on the EMA line to see the colors of the candles change - it's not visible by default or without doing this.

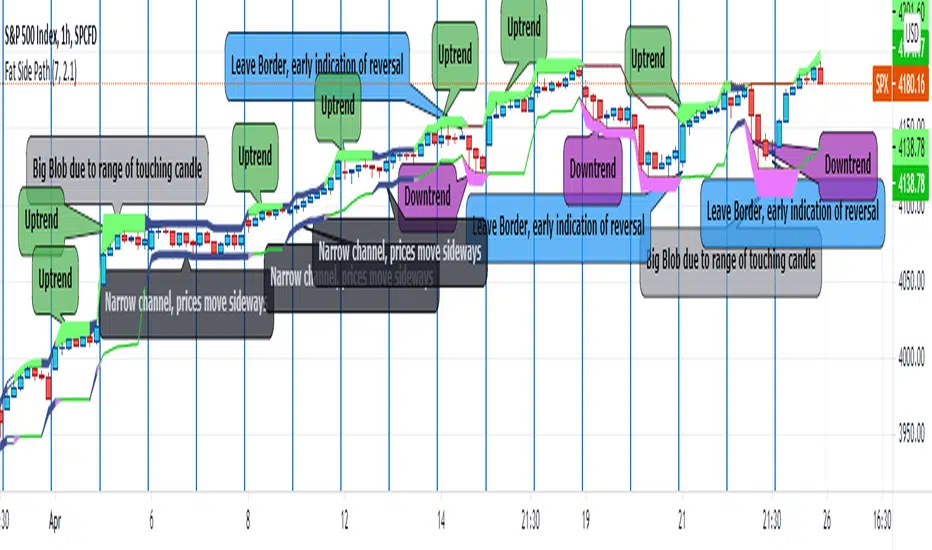
Fat Side PathI got the idea for a narrow Donchian Channel with a short lookback period which closely follows the price fluctuation in which the sides of the channel have a thickness according to the range of the last touching candle.
Any channel, be it Donchian, Keltner, Bollinger Bands or Parallel, has an upside and a downside, touching the upside is a buy signal as this may initiate an uptrend, the downside a sell signal because a down trend may come.
This gave me the idea to make only the last touched side fat, thus creating visible switching between uptrend and downtrend. However this is ‘too digital’, as in practice also periods of no trend occur in which signaling a trend would give a false signal. In a Donchian channel (and also Bollinger Bands) such periods are marked by narrowing the channel. So I gave a no trend signal to the sides when the channel is narrower than a minimum width to call a trend. I gave the thing nice colours and proper default settings.
Use of the channel in trading.
I think this thing can be useful for swing trading. In channels two typical things may happen that should be noted by the trader, these are LB, Leaving the Border, which signals a trend reversal and FTT, Failure To Traverse, i.e. the price doesn’t manage to cross the channel to the other side. This affirms the trend. FTT’s are not expected in short lookback channels like this path (Sidenote: Fibonacci levels can be regarded as predictions where FTT’s may occur). The fat side indicates direction. Because somehow trends seem to end with a notable range extension, this channel sometimes produces a “Big Blob” where the trend reverses.
I intend to use this thing together with my Keltner Fibzones channel, where the zones serve as a ‘landscape’ in which the Fat Side Path meanders providing ‘comments’ on the short term price movements.
Ichimoku Strategy [CDI]Strategy used in the CDI community that consists of having as a signal to enter long when it crosses the entire Ichimoku cloud .
It is recommended to use the strategy in one hour candles and the profit / loss ratio is 2 to 1 for swing trading, however it can be used at any time frame.
The purpose is to perform a bakctesting quickly by setting the limit and stop in the study settings (Proffit and Loss). It is also possible to deactivate the trades on chart changing the configuration in the settings pannel to visualize more clearly the yellow candles that are marked on the chart to identify the signal of the strategy.
Strategy settings:
- Profit %: approximate profit on each entry
- Loss %: approximate loss limit in each entry
- Crossing Candles: number of candles that establishes the crossing of the Ichimoku clouds
Alerts can be configured.
For more information about the strategy, you can search on YouTube for Hyenuk Chu's video "Cómo construir una buena tasa Riesgo Beneficio"
WARNING:
- For purpose educate only
- The entries are used under your responsibility

SMA + Trend Strength + Trailing Stop LossThe 'SMA + Trend Strength + Trailing Stop Loss' indicator was designed for swing trading long positions over the course of days/weeks. The benefit of the indicator is to identify areas where the market of a given asset is showing signs of a strong uptrend, divergences, and fear. A 13-bar simple moving average is color coded to four colors based on 5 given conditions at a time, which are represented as a trend meter on the bottom right of the screen. A trailing stop loss indicator is included to secure your profits or limit your loss in case the market reverses on you unexpected. Please use this indicator responsibly with proper risk management, and never rely on the indicator by itself for buy and sell signals.
When the simple moving average color is green, it means that at least 4 of 5 conditions are confirming a move upwards, this is when you can take an entry into a trade based on your entry strategy. As the trend continues, the color will eventually change to yellow signaling a divergence. This is when you can use your exit strategy to find a good point to sell. It is wise not to take new positions when the color is trending yellow.
If the color changes from yellow to orange, that is a warning sign that the trend is about to change or has begun to change. Prices may have already fallen. However, sometimes the color will change from yellow back to green signaling a continuation of the trend. You can either keep holding or take a new position in this instance.
When the color is red, this signals fear in the market, you should stay out of the market at first. However, as the market consolidates and the color starts changing back to orange, this is an opportunity to take a long position at a reasonably low price.
Simple Moving Average (13-Bar) Color Explanation:
The colors change based on 5 market conditions represented in the trend meter.
Green: Strong Uptrend
Yellow: Divergence Present
Orange: Warning
Red: Fear
Trend Meter Explanation:
The trend meter draws 5 arrows indicating bullish or bearish presence.
LL = Lower Lows - Detects when the market is trending with lower lows.
HH = Higher Highs - Detects when the market is trending with higher highs.
MA = SMA Direction - A formula is used to determine the direction of the SMA.
DI = Directional Index - Identifies when upwards momentum is trending.
RSI = Relative Strength Index - Identifies when the RSI is in an uptrend state.
Note: For advanced users, this indicator has a hidden DMI(4, 4, 4) and RSI(14) indicator used to determine the last two conditions. The Directional Index is based on a DI Plus momentum moving average to determine a momentum trend and the RSI trending over 50 will constitute an uptrend signal as below 50 it will point down.
Trailing stop loss:
The trailing stop loss is determined based on the lowest price of the last 8 bars.
A gray step-line is drawn at the suggested stop activation price.
A red step-line is drawn at the suggested stop limit price.
When the price breaches the trailing stop, a red X will appear below the bar.
You can turn each of these features on or off based on your preference. Happy trading!

2HLA very simple, almost naive strategy, in which you buy on the lowest of the two previous candles and sell at the highest of the two previous candles. You can configure these highest and lowest lenght, in some assets two is too small of a number to make profit. You can also configure to exit the position after X, and I found that 7 (which is a week of working days) is a good number for that.
This is strategy is intended to be used as a swing trade. Your capital needs to be high enough so that it can pay the operaitonal costs, and reach it's target with a reasonable profit.
Since this is a volatility based strategy, assets that are more liquid won't work properly.

Ultimate VWAP Bands- Ultimate VWAP Bands is a script that helps to decide and further clarify areas of oversold and overbought conditions.
- For example, when the price is in the lowest band it is extremely oversold relative to the VWAP . Hence it should be considered a good place to buy with a high risk to reward payoff.
- Each band is set at a fixed offset away from the VWAP . The "VWAP Band Multiplier" adjusts this and is a key part of the script. This allows the indicator to be adjusted based on the assets volatility . For example, with Crypto. A multiplier of 1 would be strongly advised. Whilst a multiplier of 0.1-0.25 would be useful for currency pairs.
- This indicator can be used for all manners of trading. However, it is most effective when used for scalping and swing trading.

[blackcat] L3 Price Positioning IndexLevel: 3
Background
Are you tired of traditional Japanese candlesticks? Do you want to try a new type of candle master chart?
Function
L3 Price Positioning Index is totally brand-new candle chart invented by myself. This main chart can provide effective resistance and support levels, and you can see where the price is running at any time. There are 3 key circle lines. Green circle line is used to indicate oversold support or breakthrough support levels; yellow circle line indicates the midline position where prices may pause; and red circle line indicates overbought resistance or breakthrough resistance levels.
There are two types of candlestick charts.
The first type candles are mid-to-long-term trend candles, navy represents an uptrend and the length of the candle represents a change in intensity; maroon represents a downward trend and the length of the candle represents a change in intensity. This trend candle is the effective support and resistance level of the second type short-term swing candle.
The second type candles are short-term candles fluctuate around the first medium- and long-term trend candles. The second short-term candle is divided into five colors: green means pump; fuchsia means retracement in the ascending process; yellow means bullish reversal signal; red means dump; blue means price rebound in the descending process.
Key Signal
THREE KEY LINES:
htop --> red circle line, overbought resistance or pump breakout threshold
hmid --> yellow circle line, price pause zone, sideways may happen here
hbot --> green circle line, oversold support or dump breakout threshold
MID-LONG TERM CANDLES:
x22,x33 --> navy for up and maroon for down trend, they are important support or resistance for short term price movements
SHORT TERM CANDLES:
1. bearreboun --> rebounce in down trend candle with blue color
2. pump --> up trend pump candle with green color
3. bullreversal --> bullish reversal candle with yellow color
4. dump --> bearish dump candle with red color
5. bullretra --> retracement in up trend candle with fuchsia
Pros and Cons
Pros:
1. Long term trend identification by three lines for overbought, oversold and breakouts
2. Mid term trend support and resistance with navy and maroon candles
3. Short term price behaviors are classified into 5 types of candles in blue, green, yellow, red and fuchsia
Cons:
I invent this to solve traditional JP candlestick shortcomings. If you find anything on Cons, just feedback to me for improvements.
Remarks
Brand-new Candle System invented by myself
Readme
In real life, I am a prolific inventor. I have successfully applied for more than 60 international and regional patents in the past 12 years. But in the past two years or so, I have tried to transfer my creativity to the development of trading strategies. Tradingview is the ideal platform for me. I am selecting and contributing some of the hundreds of scripts to publish in Tradingview community. Welcome everyone to interact with me to discuss these interesting pine scripts.
The scripts posted are categorized into 5 levels according to my efforts or manhours put into these works.
Level 1 : interesting script snippets or distinctive improvement from classic indicators or strategy. Level 1 scripts can usually appear in more complex indicators as a function module or element.
Level 2 : composite indicator/strategy. By selecting or combining several independent or dependent functions or sub indicators in proper way, the composite script exhibits a resonance phenomenon which can filter out noise or fake trading signal to enhance trading confidence level.
Level 3 : comprehensive indicator/strategy. They are simple trading systems based on my strategies. They are commonly containing several or all of entry signal, close signal, stop loss, take profit, re-entry, risk management, and position sizing techniques. Even some interesting fundamental and mass psychological aspects are incorporated.
Level 4 : script snippets or functions that do not disclose source code. Interesting element that can reveal market laws and work as raw material for indicators and strategies. If you find Level 1~2 scripts are helpful, Level 4 is a private version that took me far more efforts to develop.
Level 5 : indicator/strategy that do not disclose source code. private version of Level 3 script with my accumulated script processing skills or a large number of custom functions. I had a private function library built in past two years. Level 5 scripts use many of them to achieve private trading strategy.

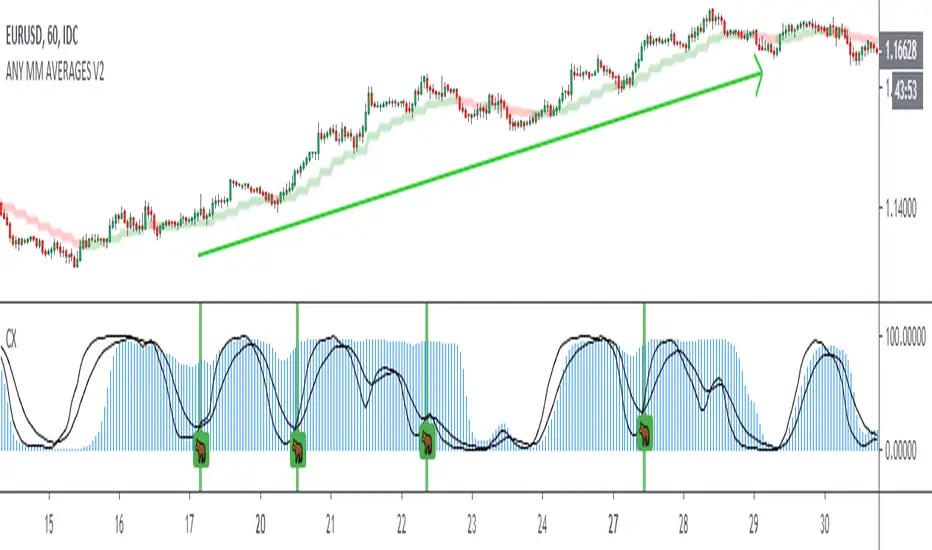
KINSKI Laguerre Filter WaveThe "Laguerre Filter Wave" Indicator usually shows market cycles and is a perfect fit for swing traders who trade with market fluctuations. Upward-trends are shown as green lines and optional bands. Downward trends are represented by the color red. Each of the 18 available lines can be adjusted to your own preferences via a gamma factor.
You also have the following display options:
- "Up/Down Movements: On/Off" - Shows ascending and descending of lines
- "Bands: On/Off" - Fills the space between the lines with colors to indicate up or down trends
- "Bands: Transparency" - sets the transparency of the fill color
- "MA Line: Size" - sets the width of the lines
- "MA Line: Transparency" - sets the transparency of the lines

Volume, Simple Relative Volume HighlightThis script plots volume bars and highlight bars that have an unusual activity, compare to the average (Standard: Simple Moving Average, 50 periods).
The script is useful for checking daily volume levels on equities. Where there is high volume, there is likely volatility, wich is good for day trading and swing trading entries.

Crack XThis indicator looks for cracks (de-correlation of 2 indicators), what you have to do is simple, first look at the trend in a higher frame, there are many indicators for this, then look for cracks as wide as possible (you can configure the size in the configuration) and that they are not close to important supports / resistances. This indicator can be very useful for Swing, Coverages, to increase existing positions.The confirmation of the crack occurs when the black lines cross + bar closure.
- Added Alerts
Trend swingTrying to code divergences of price and Volume with direction ocs.
It only highlights filtered divergence signals overlayed pointing at trend swing.
Colors:
red- doom
green - moon

SPY Master v1.0This is a simple swing trading algorithm that uses a fast RSI-EMA to trigger buy/cover signals and a slow RSI-EMA to trigger sell/short signals for SPY, an xchange-traded fund for the S&P 500.
The idea behind this strategy follows the premise that most profitable momentum trades usually occur during periods when price is trending up or down. Periods of flat price actions are usually where most unprofitable trades occur. Because we cannot predict exactly when trending periods will occur, the algorithm basically bets money on all trade opportunities during all market conditions. Despite an accuracy rate of only 40%, the algorithm's asymmetric risk/reward profile allows the average winner to be 2x the average loser. The end result is a positive (profitable) net payout.
TRADING RULES:
Buy/Cover = EMA3(RSI2) cross> 50
Sell/Short = EMA5(RSI2) cross< 50
BACKTEST SETTINGS:
- Period = March 2011 - Present
- Initial capital = $10,000
- Dividends excluded
- Trading costs excluded
PERFORMANCE COMPARISON:
There are 657 trades, which means 1,314 orders. Assuming each order costs $2 (what I pay for at Interactive Brokers), total trading costs should be $2,628.
-SPY (buy & hold) = 132.73 ---> 193.22 = +45.57% (dividends excluded)
-SPY Master v1.0 = $12,649 - $2,628 = $10,021 = +100.21%
DISCLAIMER: None of my ideas and posts are investment advice. Past performance is not an indication of future results. This strategy was constructed with the benefit of hindsight and its future performance cannot be guaranteed.

Fractal Swing Levels📊 Fractal Swing Levels — Indicator Description
Fractal Swing Levels is a lightweight, visual indicator that plots historical swing high and swing low reference levels using Williams Fractal logic. The indicator helps traders visually identify areas where price previously formed confirmed pivots. These levels can be used as contextual reference zones when analyzing price structure and market behavior.
🔍 What the Indicator Does
Detects confirmed swing highs and swing lows using a configurable fractal length. Draws horizontal levels at those swing points. Extends the levels to the right for ongoing visual reference. Limits the number of displayed levels to keep the chart clean
🎨 Visual Elements
Red lines represent historical swing high levels
Green lines represent historical swing low levels
These lines are drawn only after fractal confirmation and represent past price structure, not future projections.
⚙️ Settings Explained
Fractal Length : Controls how significant a swing must be to qualify as a level.
Higher values → fewer, more prominent levels
Lower values → more frequent levels
Max Levels Per Side : Limits how many swing high and swing low levels are displayed at one time, helping reduce chart clutter.
📈 How to Use
Use the levels as visual reference points for structure analysis. Combine with trend tools, moving averages, or other technical indicators. Useful across intraday, swing, and positional timeframes. This indicator is best used as a contextual aid, not as a standalone decision tool.
⚠️ Important Notes
This is a visual analysis tool only. It does not generate buy or sell signals. It does not predict future price movement. Levels are based solely on confirmed historical price data
🎯 Summary
Fractal Swing Levels provides a clean and minimal way to visualize historical swing structure on the chart, helping traders better understand where price has previously reacted.

Daily/Weekly Swing Highs-Lows + Candle PatternsDescription
Daily/Weekly Swing Highs-Lows + Candle Patterns
This indicator plots the most recent Daily and Weekly Swing Highs and Lows (key support/resistance levels) using a simple and effective logic: a swing high/low is confirmed when the previous bar's extreme is higher/lower than both the current and the one before it.
Features:
• Daily Swing Highs/Lows (teal/maroon circles) – toggleable
• Weekly Swing Highs/Lows (blue/purple circles) – optional
• Visual separators for new daily and weekly bars (light background color)
• Daily candle pattern labels (optional):
- US = Up Swing (strong bullish continuation)
- DS = Down Swing (strong bearish continuation)
- IN = Inside Bar
- OUT = Outside Bar
• Daily close position labels (optional):
- P = Positive (close in upper 25% of the range)
- mP = minor Positive (50–75%)
- mN = minor Negative (25–50%)
- N = Negative (lower 25%)
All elements are fully customizable (colors, visibility) and work on any timeframe.
Best suited for intraday timeframes (1 min to 4 hours) where daily and weekly key levels provide important context for price action and reversals.
The optional "Trading session length" input is mainly useful for markets with shorter sessions (e.g., European indices) and does not affect swing detection.
Open-source, free to use and modify.
How to Use the Indicator + Practical Use Case
Key Settings (Inputs)
Trading session length (hours) → Default 8.5 h (useful for FTSEMIB, DAX, etc.). Leave it as is unless you trade a market with a different session length.
Daily Swing Levels → Show/Hide daily swing highs (teal) and lows (maroon).
Weekly Swing Levels → Usually keep off on intraday charts to avoid clutter (turn on for higher-timeframe context).
Daily Candle Patterns → Enable only if you want to see US/DS/IN/OUT labels on the daily close.
Close Position (P/mP/mN/N) → Enable if you want to quickly see how strong/weak the daily close was.
What You See on the Chart
Teal circles = Last confirmed daily swing high (resistance).
Maroon circles = Last confirmed daily swing low (support).
Blue/purple circles (if enabled) = Weekly swing high/low.
Light gray background = Start of a new trading day.
Purple background (if weekly enabled) = Start of a new week.
Small labels on daily close (if enabled):
- US = strong bullish day
- DS = strong bearish day
- IN = inside bar (consolidation)
- OUT = outside bar (expansion)
- P/mP/mN/N = how far the close was from the high/low of the day.
Best Timeframes 1 min to 240 min charts → Daily levels act as major support/resistance zones for intraday trading.
Avoid using on daily or higher charts (the logic is designed for intraday context).
Why this works well intraday:
The daily swing high/low levels are high-probability zones where institutions and algorithms often defend positions. On intraday charts, they act as “magnets” for price, giving you clean entries and exits with clear invalidation levels.
This indicator keeps your chart clean while providing exactly the context most intraday traders need: key daily levels + daily momentum context.

Smart Money Swing Strategy [All-in-One]# Pro Swing Trader 📈
A comprehensive swing trading indicator for TradingView that combines multiple confluence factors to identify high-probability trade setups with built-in risk management.
## 🎯 Overview
This indicator is designed for swing traders who want to catch momentum pullbacks with precision entries. It filters trades using multiple timeframe analysis, RSI zones, volume confirmation, and EMA trends to deliver only the highest-confidence setups.
### Key Features
✅ **Multi-Timeframe Confluence** - Confirms trades with higher timeframe analysis (Daily, 4H, etc.)
✅ **Smart Entry Signals** - Detects pullback-to-EMA reclaim patterns
✅ **Automatic Risk Management** - Calculates stops, targets, and R-multiples
✅ **Dynamic Stop Loss** - ATR trailing stop + break-even automation
✅ **Real-Time HUD Dashboard** - Live confluence scoring and trade metrics
✅ **Comprehensive Alerts** - Entry, TP1, TP2, and stop-loss notifications
✅ **Visual Trade Levels** - Clear on-chart stop-loss and take-profit lines
---
## 📊 How It Works
### Signal Logic
The indicator identifies two types of signals:
**Base Signals** (Small triangles):
- Price pulls back between Fast EMA and Slow EMA
- RSI is in the swing zone (40-60 by default)
- Price reclaims the Fast EMA with momentum
- Optional: Volume spike confirmation
**High-Confidence Signals** (Large triangles):
- All base signal criteria met
- Higher timeframe confirms the trend direction
- HTF RSI and slope alignment
- These are your primary trade signals
### Entry Conditions
#### Long Entry (🟢 HC L)
1. Fast EMA > Slow EMA (uptrend)
2. Previous candle closed between the EMAs (pullback)
3. Current candle crosses above and closes above Fast EMA (reclaim)
4. RSI between 40-60 (swing zone)
5. **HTF Confirmation**: Daily/4H price above EMA50, RSI > 50, positive slope
6. Optional: Volume > 1.5x 20-bar average
#### Short Entry (🔻 HC S)
1. Fast EMA < Slow EMA (downtrend)
2. Previous candle closed between the EMAs (pullback)
3. Current candle crosses below and closes below Fast EMA (reclaim)
4. RSI between 40-60 (swing zone)
5. **HTF Confirmation**: Daily/4H price below EMA50, RSI < 50, negative slope
6. Optional: Volume > 1.5x 20-bar average
---
## 🎛️ Settings & Parameters
### Trend Parameters
- **Fast EMA**: Default 20 - Quick trend detection
- **Slow EMA**: Default 50 - Major trend filter
- **Swing Lookback**: Default 10 - Bars to find swing high/low for stops
### RSI Settings
- **RSI Length**: Default 14
- **RSI Min**: Default 40 - Lower bound of swing zone
- **RSI Max**: Default 60 - Upper bound of swing zone
### Risk Management
- **Final TP Risk-Reward (R)**: Default 2.0 - Main profit target multiplier
- **TP1 R Multiple**: Default 1.0 - Partial profit target
- **Use Break-even Stop**: Move stop to entry after 1R profit
- **ATR Trailing Stop**: Dynamic stop based on ATR(14) x 2.0
### Filters
- **Require Volume Spike**: Optional volume confirmation filter
- **Use Higher TF Confirmation**: Enable multi-timeframe analysis
- **Higher TF**: Default "D" (Daily) - Can use 240 (4H), W (Weekly), etc.
---
## 📈 Dashboard (HUD)
The top-center dashboard shows real-time confluence status:
| Column | Meaning |
|--------|---------|
| **Trend** | Current trend direction (UP/DOWN/Flat) |
| **HTF** | Higher timeframe alignment (Bull/Bear/Flat) |
| **RSI Zone** | Is RSI in swing zone? (YES/NO) |
| **Volume** | Volume spike detected? (YES/NO) |
| **Signal** | Active signal type (HC LONG/HC SHORT/None) |
| **R Risk** | Current profit in R-multiples |
| **Stop** | Current stop-loss level |
| **TP1** | Partial take-profit status |
| **TP2** | Final take-profit status |
| **Conf %** | Overall confluence score (0-100%) |
### Confidence Score Breakdown
- **20%** - Trend present (up or down)
- **30%** - HTF confirmation aligned (or 15% if HTF off)
- **20%** - RSI in swing zone
- **10%** - Volume spike
- **20%** - High-confidence signal triggered
**Scoring**:
- 🟢 70%+ = High probability setup
- 🟡 40-69% = Moderate setup
- 🔴 <40% = Low probability
---
## 🔔 Alert Setup
The indicator includes 8 alert conditions:
### Entry Alerts
- **HC LONG ENTRY** - High-confidence long signal triggered
- **HC SHORT ENTRY** - High-confidence short signal triggered
### Profit Target Alerts
- **LONG TP1 Reached** - Hit partial profit (1R by default)
- **LONG Final TP Reached** - Hit final target (2R by default)
- **SHORT TP1 Reached** - Hit partial profit
- **SHORT Final TP Reached** - Hit final target
### Stop Loss Alerts
- **LONG Stop/BE/Trail Level Hit** - Long position stopped out
- **SHORT Stop/BE/Trail Level Hit** - Short position stopped out
### How to Set Up Alerts
1. Click "Add Alert" on TradingView
2. Choose this indicator from the dropdown
3. Select desired alert condition
4. Set alert to trigger "Once Per Bar Close"
5. Customize notification method (popup/email/webhook)
---
## 📋 Trading Workflow
### 1. Wait for High-Confidence Signal
Look for the large **HC L** or **HC S** triangle on chart close.
### 2. Verify Confluence
Check the HUD dashboard:
- Confidence score should be 70%+
- HTF status should show alignment
- RSI Zone should be "YES"
### 3. Entry
Enter the trade at market or on next candle open.
### 4. Set Stop Loss
Use the **initial stop** shown in the HUD (red line on chart):
- **Longs**: Below the swing low (10-bar lookback)
- **Shorts**: Above the swing high (10-bar lookback)
### 5. Set Take Profits
- **TP1**: 1R (50% position close) - Yellow line
- **TP2**: 2R (remaining 50% close) - Green line
### 6. Manage the Trade
- Monitor the **R Risk** column to track profit
- Stop moves to break-even automatically after 1R (if enabled)
- ATR trailing stop engages dynamically (red line adjusts)
- Exit if price hits dynamic stop level
---
## 🎨 Visual Guide
### On-Chart Elements
**Triangles**:
- Small lime/red triangles = Base signals (lower confidence)
- Large lime/red triangles = High-confidence signals (trade these!)
**Lines**:
- 🟢 Green line = Fast EMA (20)
- 🟠 Orange line = Slow EMA (50)
- 🔴 Red line = Dynamic stop-loss level
- 🟡 Yellow line = TP1 level
- 🟢 Green line = TP2 (final target)
**HUD Colors**:
- 🟢 Green = Bullish/Active/Good
- 🔴 Red = Bearish/Inactive/Warning
- 🟡 Yellow = Neutral/Caution
- 🔵 Blue = Informational
- ⚫ Gray = Disabled/Off
---
## 💡 Strategy Tips
### Best Practices
1. **Only trade High-Confidence signals** - Ignore base signals unless very experienced
2. **Respect the HTF** - Don't fight the higher timeframe trend
3. **Use proper position sizing** - Risk 1-2% of account per trade
4. **Partial profits work** - Take 50% off at TP1, let rest run to TP2
5. **Let winners run** - Trailing stop helps capture extended moves
6. **Be patient** - Quality over quantity; wait for 70%+ confluence
### Optimal Timeframes
- **Primary Chart**: 1H, 4H, Daily (swing trading)
- **HTF Setting**: One level higher than your chart
- If trading 1H → Set HTF to 4H or D
- If trading 4H → Set HTF to D or W
- If trading Daily → Set HTF to W
### Market Conditions
**Best Performance**:
- Trending markets with healthy pullbacks
- Clear support/resistance zones
- Moderate volatility
**Avoid Trading**:
- Extremely choppy/sideways markets
- Major news events (unless experienced)
- Low confidence scores (<40%)
---
## ⚙️ Advanced Customization
### Aggressive Setup (More Signals)
```
Fast EMA: 12
Slow EMA: 26
RSI Min: 35
RSI Max: 65
Use HTF Confirmation: OFF
Require Volume Spike: OFF
```
### Conservative Setup (Fewer, Higher Quality)
```
Fast EMA: 20
Slow EMA: 50
RSI Min: 45
RSI Max: 55
Use HTF Confirmation: ON
Require Volume Spike: ON
Final TP R: 3.0
```
### Scalping Adaptation (Not Recommended)
```
Fast EMA: 9
Slow EMA: 21
Swing Lookback: 5
TP1 R: 0.5
Final TP R: 1.0
```
---
## ⚠️ Risk Disclaimer
**IMPORTANT**: This indicator is for educational and informational purposes only.
- Past performance does not guarantee future results
- No indicator is 100% accurate
- Always use proper risk management
- Never risk more than you can afford to lose
- Consider using a demo account first
- Seek professional financial advice if needed
Trading involves substantial risk of loss and is not suitable for all investors.
---
## 🔧 Troubleshooting
### "No signals appearing"
- Check if HTF confirmation is enabled but market isn't aligned
- Verify RSI zone isn't too restrictive
- Ensure volume spike isn't filtering out all setups
- Try adjusting EMA lengths for your asset
### "Too many false signals"
- Enable HTF confirmation
- Tighten RSI zone (e.g., 45-55)
- Enable volume spike requirement
- Only trade 70%+ confidence setups
### "Stops too tight/wide"
- Adjust Swing Lookback length
- Modify ATR multiplier for trailing stop
- Consider the asset's volatility
### "Alerts not working"
- Ensure alert is set to "Once Per Bar Close"
- Check indicator is added to the chart
- Verify TradingView notification settings
---
## 📚 Version History
**v1.0 (Current)**
- Initial release
- Multi-timeframe confluence system
- Dynamic risk management
- Real-time HUD dashboard
- Comprehensive alert system
- ATR trailing stops
- Break-even automation
---
## 🤝 Support & Feedback
If you find this indicator helpful:
- ⭐ Star the script on TradingView
- 💬 Share your results and feedback
- 🐛 Report bugs or suggest improvements
- 📖 Share with other traders
---
## 📖 Additional Resources
### Recommended Reading
- "The New Trading for a Living" by Dr. Alexander Elder
- "Swing Trading Using Multiple Timeframes" - Educational articles
- Risk management and position sizing guides
### Learn More About
- Multiple timeframe analysis
- EMA crossover strategies
- RSI divergence and zones
- ATR-based stops
- R-multiple profit management
---
## 📝 License
This indicator is provided as-is for personal trading use.
**Usage Rights**:
- ✅ Use for personal trading
- ✅ Modify for personal use
- ❌ Resell or redistribute
- ❌ Claim as original work
---
## 🎓 Quick Start Checklist
- Add indicator to TradingView chart
- Set your preferred timeframe (1H/4H/Daily)
- Configure HTF setting (one level higher)
- Review default parameters
- Set up entry alerts (HC LONG/SHORT)
- Set up TP and SL alerts
- Test on historical data
- Paper trade first
- Start with small position sizes
- Track your results
---
**Happy Trading! 📊💰**
*Remember: Discipline, patience, and risk management are the keys to long-term success.*
