Triple Moving Average HeatmapHi everyone
I didn't publish on Friday because I was working on an Expert Advisor in MT4. The day I don't publish, some scripts spamming guys published many (not useful) scripts the same to kick me out of the TOP #1 ranking.
So what I'm going to do about it? crying or sharing more quality scripts than before? :)
I guess you know the answer :) I'm gonna share a few quality scripts that I have in my library. I noticed that you guys tend to like more the scripts useful for your trading actually making you money rather than a copy-paste (of another copy-paste)
Alright, enough for the trolling now let's introduce the Three MA heatmap which is an upgrade of that script : MA-heatmap-Double-cross-edition/
The challenge was to keep the heatmap not rolling and to make it match with the MA cross. I did it using this
```
since_ma_buy = barssince(macrossover)
since_ma_sell = barssince(macrossunder)
heatmap_color() =>
since_ma_buy < since_ma_sell ? color.new(color.green, 20) : since_ma_buy > since_ma_sell ? color.new(color.red, 20) : na
```
This is a technique that I found after drinking three glasses of red wine (#french) to keep the heatmap stable and not rolling.
To get what I'm saying I invite you to replace the piece of code above by what everyone would normally do
```
heatmap_color() =>
macrossunder() ? color.new(color.green, 20) : macrossover() ? color.new(color.red, 20) : na
```
Ah and I'm not done sharing for the day, a few scripts are coming also after that one and tonight !!!!! I want to live in a world where you guys can enjoy quality scripts (mostly) :)
PS
____________________________________________________________
Feel free to hit the thumbs up as it shows me that I'm not doing this for nothing and will motivate to deliver more quality content in the future.
- I'm an officially approved PineEditor/LUA/MT4 approved mentor on codementor. You can request a coaching with me if you want and I'll teach you how to build kick-ass indicators and strategies
Jump on a 1 to 1 coaching with me
- You can also hire for a custom dev of your indicator/strategy/bot/chrome extension/python
Search in scripts for "the script"

A+ Model - Cave EducationHere is a comprehensive and detailed explanation of the "A+ Model - Cave Education" Pine Script code.
This script is a sophisticated technical analysis tool designed for TradingView. It assists traders in identifying specific institutional time windows, price ranges (sessions), and "Macro" volatility periods based on the ICT (Inner Circle Trader) or similar time-based trading concepts.
Below is the breakdown of how the code functions, organized by its logic sections.
1. General Overview
The script is an overlay indicator (it sits directly on the price chart). Its primary purpose is to:
Highlight a specific trading session (The "A+ Box") and mark its High/Low.
Mark key institutional times (07:00 NY and 09:30 NY Open).
Identify "Macro" windows (specific 20-minute periods where algorithms are active) and draw dynamic ranges around them based on volatility (ATR).
Project future times onto the chart to help the trader prepare for the next day.
2. Settings & Inputs (User Configuration)
The code begins by defining a vast array of user inputs, grouped for better usability:
General Time & Box: Allows the user to define the "A+ Session" time (default 20:00-00:00) and the Time Zone (UTC-5/New York). It also handles the visual style (colors) of the session box.
Visibility: A crucial performance and visual clutter setting. boxDays limits how far back the A+ boxes and time lines are drawn (default 14 days). Macros are strictly limited to the current week to prevent chart lagging.
Line & Text Controls: Every visual element (A+ lines, NY markers, Macros) has toggles (input.bool) to show/hide the lines or the text labels separately.
Macro Settings: Defines the time windows for three separate macros and an ATR Multiplier. The ATR multiplier determines how wide the channel lines are drawn around the macro price action.
3. Logic Breakdown by Section
Section 1: The "A+ Draw" Box (Session Range)
This is the core of the A+ Model.
Logic: The script checks if the current bar is within the user-defined sessionTime.
Box Creation:
When the session starts, it initializes a new Box (box.new).
Throughout the session, it continuously updates the Box's Top (Highest High) and Bottom (Lowest Low) to encompass the full range of that time period.
Extension Lines (Support/Resistance):
Once the session ends, the script draws two horizontal lines: one from the Session High and one from the Session Low.
Smart Break Logic: These lines are active (highActive, lowActive). They extend to the right until the price breaks them (High line is broken by a higher price, Low line by a lower price). This helps traders see if the session range is being respected or broken later in the day.
Section 2: Time Lines (NY Midnight & Open)
This section marks vertical reference points.
It checks for specific times: 07:00 and 09:30 (in the user's timezone).
If the current bar matches these times, it draws a vertical line (line.new) covering the High/Low of that bar and places a label (e.g., "NY." or "09:30") above it.
This helps the trader orient themselves regarding the New York session Open and the "Killzone" start.
Section 3: Macros (Volatility Windows)
This is the most complex calculation in the script.
Definition: Macros are specific time windows (e.g., 09:50–10:10) where price delivery is often accelerated.
Visibility Rule: To keep the script fast, this only runs if isCurrentWeek is true.
ATR Offset: The script calculates the Average True Range (ATR). It uses this to create a "channel" around the price.
Drawing Logic:
When a Macro time starts, the script tracks the Highest High and Lowest Low inside that specific 20-minute window.
It draws parallel horizontal lines above and below these prices.
The Twist: The lines are not drawn at the High/Low. They are offset by ATR * Multiplier. This creates a wider "zone" around the macro price action, visually indicating a volatility range.
Section 4: Future Projection (Tomorrow)
This feature is for planning ahead.
It runs only on the last bar of the chart (barstate.islast).
It calculates the timestamps for the next occurrence of the key times (07:00, 09:30, and all three Macros).
It draws vertical lines into the future (empty space on the right of the chart).
Benefit: The trader can see exactly where 09:30 or the next Macro will occur on the timeline before the candles even print.
4. Helper Functions
The code uses custom functions to keep the logic clean:
f_drawFuture(...): A standardized function to draw the future vertical lines and labels so the code doesn't have to repeat itself for every single time marker.
isStartTime(...) & isInTime(...): Shorthand functions to check if the current candle belongs to a specific session string (like "0950-1010").
Summary of Improvements in this Version
Compared to a standard indicator, this script is highly optimized:
Text Control: You can turn off text labels while keeping the lines (or vice versa).
Performance: It limits historical drawing (only 14 days back for boxes, only this week for macros) to prevent "Maximum Line Count" errors in Pine Script.
Visual Clarity: It uses different colors for different Macros (Blue, Red, Orange) to make them instantly distinguishable.

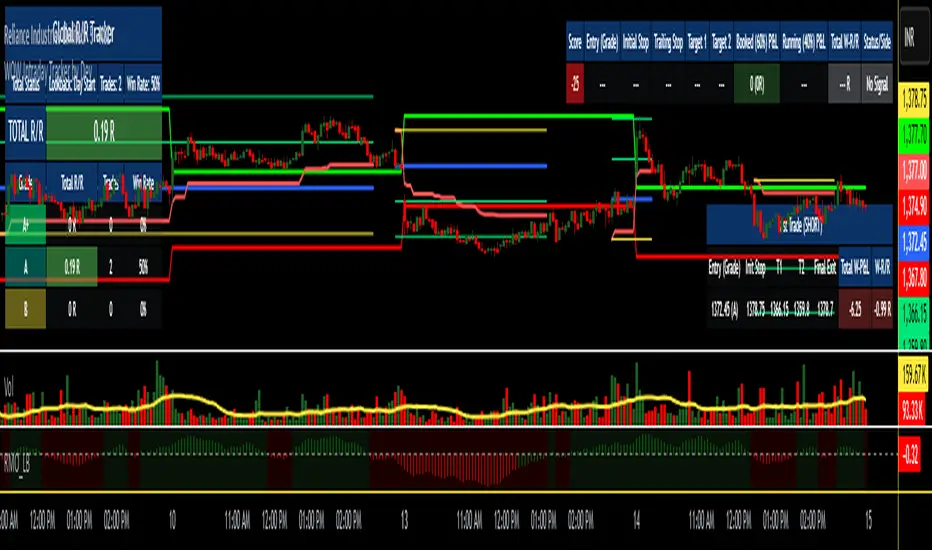
WOW Intraday Tracker by Dev🎯 WOW Intraday Tracker: Professional Trade Execution & R/R Analysis
The WOW Intraday Tracker (V1.30 Final) is an advanced, invite-only tool built for disciplined intraday trading. It transforms market signals into a fully managed trade, providing both real-time execution confidence and objective performance review.
************************************************************************************
✨ Core Execution Features
The Tracker automates the most critical aspects of trade management:
Automatic Entry Trigger: The script uses a proprietary multi-factor scoring system to identify high-probability setups. Once a trade signal is validated and its Score meets the Activation Threshold (which is visible in the Running Trade Table), the entry order (Long or Short) is automatically triggered and monitored.
Trade Grade Qualification: Crucially, every setup is assigned a Trade Grade (A+, A, or B) before entry, based on structural confluence, allowing traders to qualify the setup quality instantly.
Initial SL & Multiple Targets (TGTs): All trades are established with risk-defined parameters from the start.
Initial Stop-Loss (SL): Automatically calculated based on user-defined ATR Multiples to align risk with current volatility.
Multiple Take-Targets (TGTs): Two distinct target levels (TGT1 and TGT2) are set based on user-defined R-Multiples (Risk-to-Reward ratios) to facilitate a partial profit-taking strategy.
Dynamic Trailing & Stop Adjustment: As the trade progresses, the script automatically manages risk, adjusting the stop-loss upon TGT hits to lock in profit.
Signal Cancellation Feature: To protect capital, the script actively monitors the signal's health. If the internal trade score drops below the configurable Cancellation Threshold before entry, the pending order is automatically invalidated and cleared.
⚖️ Trade Exit and Weighted R/R Assumptions
The script's primary function is to track and calculate a Weighted Risk-to-Reward (R/R) based on a predetermined exit plan:
Target 1 (T1): 30% of the original position. Stop is adjusted to protect profits.
Target 2 (T2): Another 30% of the original position. Trailing Stop begins based on a volatility factor.
Final Exit: Rest 40% of the original position. Exited when the Trailing Stop is hit.
Important Note: The Trailing Stop is tracked on a closing basis within the script. While you can choose to exit the trade manually on a hit basis or book profits based on your personal judgment, the script's final Weighted R/R calculation is based on the assumption that the position exits as detailed above.
**************************************************************************************
📊 Global R/R Tracker Table (Performance by Grade)
This powerful feature provides objective, actionable data for trade review. It continuously tallies your performance, broken down by the quality (Grade) of the trade setup.
The table tracks performance for A+, A, and B grade setups, plus a TOTAL row, based on your chosen lookback (Full History or Day Start)
By separating performance by Grade, you gain a clear, evidence-based understanding of which setups truly deserve your capital and focus.
*************************************************************************************
🎨 Advanced Customization & Styling
The WOW Intraday Tracker offers extensive control over the look and feel of your workspace to ensure maximum clarity and minimal chart clutter.
Table Positioning: Freely select the on-chart location (Top Right, Bottom Left, etc.) for all three tables.
Theming: Customize the background and text colors for all tables, including the dynamic green/red backgrounds of the Global R/R Tracker.
Plot Lines: Full color control over all plotted trade lines: PDH/PDL, Entry Price, Initial Stop, Trailing Stop, and Targets.
*********************************************************************************
⏱️ Usage & Recommended Timeframes
The WOW Intraday Tracker is primarily designed and optimized for high-frequency, short-term intraday trading.
Recommended Timeframes: For optimal performance, we recommend using the script on lower-to-mid-range intraday timeframes: 5-minute, 15-minute, and 25 (or 30) minutes.
Intended Use: While the script can be applied to higher timeframes, its main purpose is to capture volatility and quick moves within the trading day.
Swing Trading: In rare instances, the tracker may generate signals suitable for a short-term swing trade (1-2 days), but this is secondary to its core intraday function.
********************************************************************************************
🔑 Access Note
The WOW Intraday Tracker utilizes proprietary logic within its scoring system and is published as an invite-only script. The source code is protected to maintain the integrity and value of the intellectual property.
To inquire about access, please contact the author directly via TradingView Private Message on this profile.
RSS-Stochastik [afterworktrading]Hi all,
this is the first script from the series "afterworktrading". The goal is to develop and provide tools for traders with a fulltime job or little time for trading/analyzing charts.
Over time some of the scripts will also be linked to complete trading systems.
Let's start with my favourite one, the "RSS-Stochastik" with alert function.
The RSS-concept (Relative Spread Strength, developed by Ian Copsey) is based on the variance between a "short" and a "long" moving averages (or "slow" and "fast"), here between two EMA.
This variance is calculated and plotted in a RSI-diagram to show "overbought" and "oversold" conditions, helping to identify an ideal entry setup for trend continuation or catching a possible reversal.
Compared to the conventional RSI etc., possible reversal or trend continuation areas are often better represented in terms of quality, as an example see the Amazon-Chart.
The EMA-values, limit value thresholds and background colors can be set in the script. As a special feature, alarms can be set to be notified when a value has reached the extreme range. This reduces the screen time to the minimum.
In my personal trading, this indicator forms the basis for almost all trades, but is not a pure signal indicator on its own.
However, the informative value can be further improved if volume or support/resistance zones etc. are linked to the RSS, see example NASDAQ future with support zone price or 200 EMA.
Example for a possible RSS-Trade-Setup:
- choose an asset with a strong trend
- set alerts for crossing the oversold or overbought condition in direction of the trend
- in case of an alert check possible support/resistance areas on the current chart level (EMA, price zones, volume zones, anchored VWAP etc.)
- trade in the direction of the trend using your preferred entry setup
In my opinion, the system can be used very well, especially in trend phases, in order to obtain optimal entries.
Does it works also on lower timeframes?
Yes, it might work on every timeframe with a strong trend of high quality. Please see attached a 5m-Chart of GPBUSD-pair, notice the signal quality in direction of the trend.
Like every trading system this is not the "holy grail setup" and you will have losing trades. But handling this indicator with care you can have better entries especially in trend direction with less screen time due to the alert function.
Good luck with it! Further indicators will be published in the coming months, some will also be based on the RSS system.
As always: no liability for losing trades, no investment advice etc. Observe the risk limit for every trade!

MMTools - Backtester❖ Overview
Backtester is a script implemented as a strategy, featuring multiple conditions and tools to offer an alternative way to work with Catcher. It supports both backtesting and algorithmic trading, allowing you to evaluate the indicator's performance on historical data for any instrument using the Strategy Tester.
❖ Settings
⚙️ Custom Conditions and Signals
This section is intended to provide flexibility when working with Catcher. (If you intend to use Catcher alone, this section can be disregarded). You may combine the primary indicator (Catcher) with additional custom indicators to define entry and exit signals. Simply add the custom indicator to your chart, display it and then select its name in the corresponding dropdown menu. By default, the 'Close' option is selected, meaning custom conditions are disabled.
Operator 'OR': An entry order is activated when either your custom signal or the primary signal occurs.
Operator 'AND': An entry order is activated only when both the custom and primary signals occur simultaneously.
If both 'AND' and 'OR' operators are used, enabling the 'Only Primary' option will apply the 'AND' operator only to the primary indicator.
Custom Exit: Allows the strategy to close a position based on a custom signal, in addition to standard exit conditions. The first condition met will trigger the exit.
Note: The strategy executes orders at the open of the next bar after the custom condition is met.
⚙️ Confirmation
When enabled, the strategy will enter a position only if a specified number of signals occur within a defined lookback period.
⚙️ Exits
Two types of exit mechanisms are available for take-profit and stop-loss:
Timeout: Sets a maximum duration (in bars) that a trade can remain open. If this limit is exceeded, the strategy will close the position.
Percentage-Based: Exit positions based on a specified percentage move.
⚙️ Start Date
Specifies the starting point for the backtest.
⚙️ Plotting
The green line represents the take-profit level, while the red line indicates the stop-loss level. Plotting is limited to the last 250 bars.
⚙️ Other Settings
Remember to configure additional parameters under the “Properties” tab, including commissions, slippage, and pyramiding. Default commission is set at 0.05%.
❖ Access
Please refer to the Author's Instructions field to request access to the script.
-----------------------------------------------------------
Disclaimer
The information provided by my scripts is for informational purposes only and does not constitute financial advice. Past performance is not indicative of future results. Always do your own research before making financial decisions.

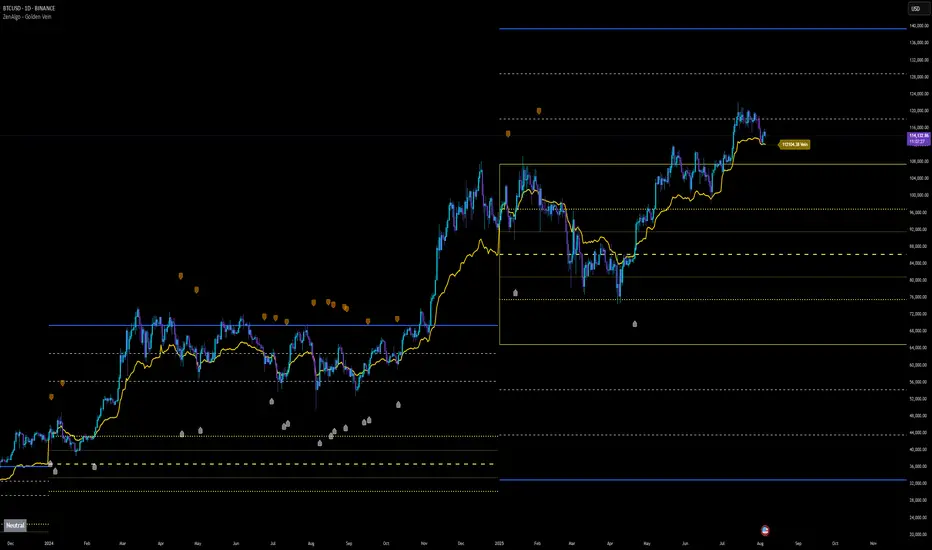
ZenAlgo - Golden VeinOverview and Motivation
This indicator combines multiple volume-weighted average price (VWAP) calculations from different timeframes and then merges them into a single composite line called “the Vein”. It begins by pulling a user-defined source (for instance, a typical price) and then anchors a VWAP on daily, weekly, monthly, quarterly, semiannual, and yearly intervals. By viewing all these timeframes together, the script captures multi-period trends in a way that stands apart from simpler, single-timeframe VWAP indicators. This comprehensive perspective is designed to offer practical benefits to those who monitor both short- and long-term VWAP behavior within a single tool.
Because it tracks many timeframes simultaneously, it can highlight instances when short-term and long-term VWAPs converge or diverge. Traders who need multi-timeframe validation may find this approach particularly helpful. Other free indicators typically restrict themselves to one or two timeframes, so the built-in multi-timeframe data in this script can save effort for those who rely heavily on VWAP analysis.
Core Inputs and Offsets
At the start, the script takes a single price input (e.g., the average of high, low, and close) and uses it to compute multiple VWAP lines. Users can also choose a distance factor (based on an ATR calculation) to control how far labels are placed from any crossover events. This distance sets how clearly the chart will display labels without overcrowding.
Beyond giving a cleaner visual, having a user-defined distance for labels means the script can adapt to any ticker’s volatility. If one trades assets with large intraday swings, the script leaves enough space for labels to remain readable. This flexibility is something that simpler free VWAP scripts might lack.
Multi-Timeframe VWAP Computations
The script calculates distinct VWAP lines: Daily, Weekly, Monthly, Quarterly (3-Month), Semiannual (6-Month), and Yearly (12-Month). Each line resets whenever it detects a new period has started, ensuring that each timeframe’s VWAP properly anchors to its own session window. This allows the indicator to track how the market perceives fair value (through VWAP) on multiple horizons, all at once.
Simultaneously checking these various intervals can offer added clarity to traders who want to compare immediate market conditions (e.g., daily) to broader contexts (e.g., quarterly or yearly). Tools that only show one or two timeframes may miss the nuances that arise when, say, daily VWAP aligns with monthly VWAP at a turning point.
Crossover Detection and Labeling
Whenever two different VWAP lines intersect, the script generates an internal crossover signal. It then draws small labels (e.g., D↑W or M↓Q) to highlight that a lower timeframe VWAP has moved above or below a higher timeframe VWAP. These labels use color-coding and an ATR-based offset to remain visible.
An additional subtle feature is how daily VWAP crossovers can optionally be displayed only on a specific weekday and hour. That allows users who only want to track daily crossovers under certain conditions (for example, a fixed point in the weekly cycle) to filter out other signals. This adaptability can be worth paying for if one needs advanced filtering—an area where simpler free VWAP cross indicators typically do not offer such granular control.
The “Golden VWAP” (Composite Calculation)
All six VWAP lines (daily, weekly, monthly, quarterly, semiannual, yearly) feed into a central average called “the Vein”. The script takes the midpoint of these six values on each bar, effectively combining short-, medium-, and long-term VWAP data into one. This composite serves as a reference line for overall market direction.
A volatility band (either a standard-deviation-based range or a user-defined percentage) wraps around this composite. The script thereby creates an upper and a lower boundary around the Golden VWAP, called “Resistance” and “Support.” Traders may interpret price moves beyond these levels as higher-probability expansions or contractions, but there is no guarantee of outcome. In choppier markets, breakouts above or below these bands might not lead to follow-through, so interpretation should always be combined with other evidence.
Simplified Market State Logic
By checking how price and the Golden VWAP behave from one bar to the next, the script tags the market state with labels like Bullish, Bearish, Super Bullish, or Super Bearish. These classifications hinge on whether the Golden VWAP is rising or falling, and whether price has crossed above or below the composite band. An optional table in the lower-left corner of the chart displays this label.
While such classification is convenient for scanning changing conditions quickly, it should be interpreted with caution. If the market is sideways or if volume patterns are erratic, the script can produce signals that do not align with real momentum. Treat these states as indications of potential bias rather than automatic buy or sell triggers.
Added Value
By gathering VWAP lines across multiple timeframes, generating alerts on all possible combinations of crossovers, and overlaying a composite VWAP with adjustable volatility bands, this script goes beyond typical single-timeframe VWAP indicators. It aims to let users track short-term shifts (e.g., daily crossing weekly) in the context of longer-term trends (e.g., yearly). This granularity and automation can reduce the need for multiple charts or manual recalculations of different VWAP windows.
Why It Can Be Worth Paying For
The capability to simultaneously anchor VWAP to multiple timeframes, detect crossovers, filter out daily signals by weekday/hour, and visualize a composite “Vein” with adjustable ranges represents a comprehensive feature set that free scripts often do not bundle together. For those who rely on multi-timeframe VWAP analysis, the time saved and clarity gained may justify a paid solution.
Interpreting Values
Crossover labels: Identify points where one timeframe’s VWAP moves above or below another. The direction (up or down) suggests potential momentum shifts.
Golden VWAP line: Treat it as the average “fair value” across all anchored periods. Large price moves above or below this line’s surrounding band might signal increased directional conviction—or false breakouts if volume is deceptive.
Market states: Use the Bullish/Super Bullish/Bearish/Super Bearish labels to gauge how price interacts with the composite’s slope and band.
How to Use It Best
Combine these signals with other risk-management methods.
Monitor multiple crossovers in tandem: for example, daily crossing weekly plus monthly crossing quarterly may offer stronger confluence.
Use the optional daily-label toggle to stay focused on selected higher-confidence signals if you find too many crossovers distracting.
Remember that every alert or label should be evaluated in broader market context and your own trading strategy.
Potential Shortcomings
As with any technical study, VWAP lines and crossovers are not foolproof predictors. The script can be less reliable in low-volume or fast-moving conditions. Large price shocks can cause abrupt changes that do not fit the typical patterns this indicator looks for.
In short, this script’s distinct advantage is showing multiple anchored VWAPs and a composite perspective in one place, offering fine control of alerts and appearance settings. Those who benefit most are chartists who want deeper VWAP insights across various timescales without juggling multiple separate indicators. However, like any technical tool, it should be understood as an aid rather than a guarantee of outcomes.
Day’s Open ForecastOverview
This Pine Script indicator combines two primary components:
1. Day’s Open Forecast:
o Tracks historical daily moves (up and down) from the day’s open.
o Calculates average up and down moves over a user-defined lookback period.
o Optionally includes standard deviation adjustments to forecast potential intraday levels.
o Plots lines on the chart for the forecasted up and down moves from the current day's open.
2. Session VWAP:
o Allows you to specify a custom trading session (by time range and UTC offset).
o Calculates and plots a Volume-Weighted Average Price (VWAP) during that session.
By combining these two features, you can gauge potential intraday moves relative to historical behavior from the open, while also tracking a session-specific VWAP that can act as a dynamic support/resistance reference.
How the Code Works
1. Collect Daily Moves
o The script detects when a new day starts using time("D").
o Once a new day is detected, it stores the previous day’s up-move (dayHigh - dayOpen) and down-move (dayOpen - dayLow) into arrays.
o These arrays keep track of the last N days (default: 126) of up/down move data.
2. Compute Statistics
o The script computes the average (f_average()) of up-moves and down-moves over the stored period.
o It also computes the standard deviation (f_stddev()) of up/down moves for optional “forecast bands.”
3. Forecast Lines
o Plots the current day’s open.
o Plots the average forecast lines above and below the open (Avg Up Move Level and Avg Down Move Level).
o If standard deviation is enabled, plots additional lines (Avg+StdDev Up and Avg+StdDev Down).
4. Session VWAP
o The script detects the start of a user-defined session (via input.session) and resets accumulation of volume and the numerator for VWAP.
o As each bar in the session updates, it accumulates volume (vwapCumulativeVolume) and a price-volume product (vwapCumulativeNumerator).
o The session VWAP is then calculated as (vwapCumulativeNumerator / vwapCumulativeVolume) and plotted.
5. Visualization Options
o Users can toggle standard deviation usage, historical up/down moves plotting, and whether to show the forecast “bands.”
o The vwapSession and vwapUtc inputs let you adjust which session (and time zone offset) the VWAP is calculated for.
________________________________________
How to Use This Indicator on TradingView
1. Create a New Script
o Open TradingView, then navigate to Pine Editor (usually found at the bottom of the chart).
o Copy and paste the entire code into the editor.
2. Save and Add to Chart
o Click Save (give it a relevant title if you wish), then click Add to chart.
o The indicator will appear on your chart with the forecast lines and VWAP.
o By default, it is overlayed on the price chart (because of overlay=true).
3. Customize Inputs
o In the indicator’s settings, you can:
Change lookback days (default: 126).
Enable or disable standard deviation (Include Standard Deviation in Forecast?).
Adjust the standard deviation multiplier.
Choose whether to plot bands (Plot Bands with Averages/StdDev?).
Plot historical moves if desired (Plot Historical Up/Down Moves for Reference?).
Set your custom session and UTC offset for the VWAP calculation.
4. Interpretation
o “Current Day Open” is simply today’s open price on your chart.
o Up/Down Move Lines: Indicate a potential forecast based on historical averages.
If standard deviation is enabled, the second set of lines acts as an extended range.
o VWAP: Helpful for determining intraday price equilibrium over the specified session.
Important Notes / Best Practices
• The script only updates the historical up/down move data once per day (when a new day starts).
• The VWAP portion resets at the start of the specified session each day.
• Standard deviation multiplies the average up/down range, giving you a sense of “volatility range” around the day’s open.
• Adjust the lookback length (dayCount) to balance how many days of data you want to average. More days = smoother but possibly slower to adapt; fewer days = more reactive but potentially less reliable historically.
Educational & Liability Disclaimers
1. Educational Disclaimer
o The information provided by this indicator is for educational and informational purposes only. It is a technical analysis tool intended to demonstrate how to use historical data and basic statistics in Pine Script.
2. No Financial Advice
o This script does not constitute financial or investment advice. All examples and explanations are solely illustrative. You should always do your own analysis before making any investment decisions.
3. No Liability
o The author of this script is not liable for any losses or damages—monetary or otherwise—that may occur from the application of this script.
o Past performance does not guarantee future results, and you should never invest money you cannot afford to lose.
By adding this indicator to your TradingView chart, you acknowledge and accept that you alone are responsible for your own trading decisions.
Enjoy using the “Day’s Open Forecast” and Session VWAP for better market insights!

[blackcat] L2 Six Round Positioning█ OVERVIEW
The script is an indicator designed to plot the direction (up, down, no change) of several moving averages (MA) on a separate chart, without overlaying the price data. It calculates Simple Moving Averages (SMA) for 3, 5, 8, 34, 60, 120, and 250 periods and uses conditional logic to determine the color and position of the plotted columns based on whether each MA is increasing, decreasing, or unchanged.
█ LOGICAL FRAMEWORK
The script is structured into three main sections:
1 — Input Parameters: None explicitly defined, but the script uses default settings for the indicator function.
2 — Calculations: Computes Simple Moving Averages (SMA) for seven different periods.
3 — Plotting: Uses conditional logic to plot columns representing the direction of each MA, with positions and colors indicating whether the MA is increasing, decreasing, or unchanged.
The flow of data is straightforward: the script calculates the SMAs, determines their direction, sets the appropriate color, and then plots the columns.
█ CUSTOM FUNCTIONS
• No custom functions are defined in this script. All calculations and plotting are done using built-in Pine Script functions such as ta.sma for SMA calculation and plot for plotting.
█ KEY POINTS AND TECHNIQUES
• Use of ta.sma: The script effectively uses the ta.sma function to calculate Simple Moving Averages for different periods.
• Conditional Logic: The script employs conditional logic (ternary operators) to determine the color and position of the plotted columns based on the direction of each MA.
• Plotting with plot: The plot function is used extensively to display the direction of each MA with different colors and positions.
• Color Transparency: The use of color.new with transparency (e.g., color.new(color.green, 50)) allows for visually distinct colors that are not too overpowering.
█ EXTENDED KNOWLEDGE AND APPLICATIONS
• Modifications: The script could be enhanced by adding input parameters to allow users to customize the periods of the moving averages, colors, and transparency levels.
• Extensions: Similar techniques could be applied to other types of moving averages (e.g., EMA, WMA) or to other technical indicators.
• Strategy Development: This indicator could serve as a component in a larger trading strategy by providing insights into the overall trend direction across multiple timeframes.
• Related Concepts: Understanding of moving averages, conditional logic, and plotting techniques in Pine Script would be beneficial for further development and customization of this script.

Top-Down Trend and Key Levels with Swing Points//by antaryaami0
Overview
The “Top-Down Trend and Key Levels with Swing Points” indicator is a comprehensive tool designed to enhance your technical analysis by integrating multiple trading concepts into a single, easy-to-use script. It combines higher timeframe trend analysis, key price levels, swing point detection, and ranging market identification to provide a holistic view of market conditions. This indicator is particularly useful for traders who employ multi-timeframe analysis, support and resistance levels, and price action strategies.
Key Features
1. Higher Timeframe Trend Background Shading:
• Purpose: Identifies the prevailing trend on a higher timeframe to align lower timeframe trading decisions with the broader market direction.
• How it Works: The indicator compares the current higher timeframe close with the previous one to determine if the trend is up, down, or ranging.
• Customization:
• Trend Timeframe: Set your preferred higher timeframe (e.g., Daily, Weekly).
• Up Trend Color & Down Trend Color: Customize the background colors for uptrends and downtrends.
• Ranging Market Color: A separate color to indicate when the market is moving sideways.
2. Key Price Levels:
• Previous Day High (PDH) and Low (PDL):
• Purpose: Identifies key support and resistance levels from the previous trading day.
• Visualization: Plots horizontal lines at PDH and PDL with labels.
• Customization: Option to show or hide these levels and customize their colors.
• Pre-Market High (PMH) and Low (PML):
• Purpose: Highlights the price range during the pre-market session, which can indicate potential breakout levels.
• Visualization: Plots horizontal lines at PMH and PML with labels.
• Customization: Option to show or hide these levels and customize their colors.
3. First 5-Minute Marker (F5H/F5L):
• Purpose: Marks the high or low of the first 5 minutes after the market opens, which is significant for intraday momentum.
• How it Works:
• If the first 5-minute high is above the Pre-Market High (PMH), an “F5H” label is placed at the first 5-minute high.
• If the first 5-minute high is below the PMH, an “F5L” label is placed at the first 5-minute low.
• Visualization: Labels are placed at the 9:35 AM candle (closing of the first 5 minutes), colored in purple by default.
• Customization: Option to show or hide the marker and adjust the marker color.
4. Swing Points Detection:
• Purpose: Identifies significant pivot points in price action to help recognize trends and reversals.
• How it Works: Uses left and right bars to detect pivot highs and lows, then determines if they are Higher Highs (HH), Lower Highs (LH), Higher Lows (HL), or Lower Lows (LL).
• Visualization: Plots small markers (circles) with labels (HH, LH, HL, LL) at the corresponding swing points.
• Customization: Adjust the number of left and right bars for pivot detection and the size of the markers.
5. Ranging Market Detection:
• Purpose: Identifies periods when the market is consolidating (moving sideways) within a defined price range.
• How it Works: Calculates the highest high and lowest low over a specified period and determines if the price range is within a set percentage threshold.
• Visualization: Draws a gray box around the price action during the ranging period and labels the high and low prices at the end of the range.
• Customization: Adjust the range detection period and threshold, as well as the box color.
6. Trend Coloring on Chart:
• Purpose: Provides a visual cue for the short-term trend based on a moving average.
• How it Works: Colors the candles green if the price is above the moving average and red if below.
• Customization: Set the moving average length and customize the uptrend and downtrend colors.
How to Use the Indicator
1. Adding the Indicator to Your Chart:
• Copy the Pine Script code provided and paste it into the Pine Script Editor on TradingView.
• Click “Add to Chart” to apply the indicator.
2. Configuring Inputs and Settings:
• Access Inputs:
• Click on the gear icon next to the indicator’s name on your chart to open the settings.
• Customize Key Levels:
• Show Pre-Market High/Low: Toggle on/off.
• Show Previous Day High/Low: Toggle on/off.
• Show First 5-Minute Marker: Toggle on/off.
• Set Trend Parameters:
• Trend Timeframe for Background: Choose the higher timeframe for trend analysis.
• Moving Average Length for Bar Color: Set the period for the moving average used in bar coloring.
• Adjust Ranging Market Detection:
• Range Detection Period: Specify the number of bars to consider for range detection.
• Range Threshold (%): Set the maximum percentage range for the market to be considered ranging.
• Customize Visuals:
• Colors: Adjust colors for trends, levels, markers, and ranging market boxes.
• Label Font Size: Choose the size of labels displayed on the chart.
• Level Line Width: Set the thickness of the lines for key levels.
3. Interpreting the Indicator:
• Background Shading:
• Green Shade: Higher timeframe is in an uptrend.
• Red Shade: Higher timeframe is in a downtrend.
• Gray Box: Market is ranging (sideways movement).
• Key Levels and Markers:
• PDH and PDL Lines: Represent resistance and support from the previous day.
• PMH and PML Lines: Indicate potential breakout levels based on pre-market activity.
• F5H/F5L Labels: Early indication of intraday momentum after market open.
• Swing Point Markers:
• HH (Higher High): Suggests bullish momentum.
• LH (Lower High): May indicate a potential bearish reversal.
• HL (Higher Low): Supports bullish continuation.
• LL (Lower Low): Indicates bearish momentum.
• Ranging Market Box:
• Gray Box Around Price Action: Highlights consolidation periods where breakouts may occur.
• Range High and Low Labels: Provide the upper and lower bounds of the consolidation zone.
4. Applying the Indicator to Your Trading Strategy:
• Trend Alignment:
• Use the higher timeframe trend shading to align your trades with the broader market direction.
• Key Levels Trading:
• Watch for price reactions at PDH, PDL, PMH, and PML for potential entry and exit points.
• Swing Points Analysis:
• Identify trend continuations or reversals by observing the sequence of HH, HL, LH, and LL.
• Ranging Market Strategies:
• During ranging periods, consider range-bound trading strategies or prepare for breakout trades when the price exits the range.
• Intraday Momentum:
• Use the F5H/F5L marker to gauge early market sentiment and potential intraday trends.
Practical Tips
• Adjust Settings to Your Trading Style:
• Tailor the indicator’s inputs to match your preferred timeframes and trading instruments.
• Combine with Other Indicators:
• Use in conjunction with volume indicators, oscillators, or other technical tools for additional confirmation.
• Backtesting:
• Apply the indicator to historical data to observe how it performs and refine your settings accordingly.
• Stay Updated on Market Conditions:
• Be aware of news events or economic releases that may impact market behavior and the effectiveness of technical levels.
Customization Options
• Time Zone Adjustment:
• The script uses “America/New_York” time zone by default. Adjust the timezone variable in the script if your chart operates in a different time zone.
var timezone = "Your/Timezone"
• Session Times:
• Modify the Regular Trading Session and Pre-Market Session times in the indicator settings to align with the trading hours of different markets or exchanges.
• Visual Preferences:
• Colors: Personalize the indicator’s colors to suit your visual preferences or to enhance visibility.
• Label Sizes: Adjust label sizes if you find them too intrusive or not prominent enough.
• Marker Sizes: Further reduce or enlarge the swing point markers by modifying the swing_marker_size variable.
Understanding the Indicator’s Logic
1. Higher Timeframe Trend Analysis:
• The indicator retrieves the closing prices of a higher timeframe using the request.security() function.
• It compares the current higher timeframe close with the previous one to determine the trend direction.
2. Key Level Calculation:
• Previous Day High/Low: Calculated by tracking the highest and lowest prices of the previous trading day.
• Pre-Market High/Low: Calculated by monitoring price action during the pre-market session.
3. First 5-Minute Marker Logic:
• At 9:35 AM (end of the first 5 minutes after market open), the indicator evaluates whether the first 5-minute high is above or below the PMH.
• It then places the appropriate label (F5H or F5L) on the chart.
4. Swing Points Detection:
• The script uses ta.pivothigh() and ta.pivotlow() functions to detect pivot points.
• It then determines the type of swing point based on comparisons with previous swings.
5. Ranging Market Detection:
• The indicator looks back over a specified number of bars to find the highest high and lowest low.
• It calculates the percentage difference between these two points.
• If the difference is below the set threshold, the market is considered to be ranging, and a box is drawn around the price action.
Limitations and Considerations
• Indicator Limitations:
• Maximum Boxes and Labels: Due to Pine Script limitations, there is a maximum number of boxes and labels that can be displayed simultaneously.
• Performance Impact: Adding multiple visual elements (boxes, labels, markers) can affect the performance of the script on lower-end devices or with large amounts of data.
• Market Conditions:
• False Signals: Like any technical tool, the indicator may produce false signals, especially during volatile or erratic market conditions.
• Not a Standalone Solution: This indicator should be used as part of a comprehensive trading strategy, including risk management and other forms of analysis.
Conclusion
The “Top-Down Trend and Key Levels with Swing Points” indicator is a versatile tool that integrates essential aspects of technical analysis into one script. By providing insights into higher timeframe trends, highlighting key price levels, detecting swing points, and identifying ranging markets, it equips traders with valuable information to make more informed trading decisions. Whether you are a day trader looking for intraday opportunities or a swing trader aiming to align with the broader trend, this indicator can enhance your chart analysis and trading strategy.
Disclaimer
Trading involves significant risk, and it’s important to understand that past performance is not indicative of future results. This indicator is a tool to assist in analysis and should not be solely relied upon for making trading decisions. Always conduct thorough research and consider seeking advice from financial professionals before engaging in trading activities.

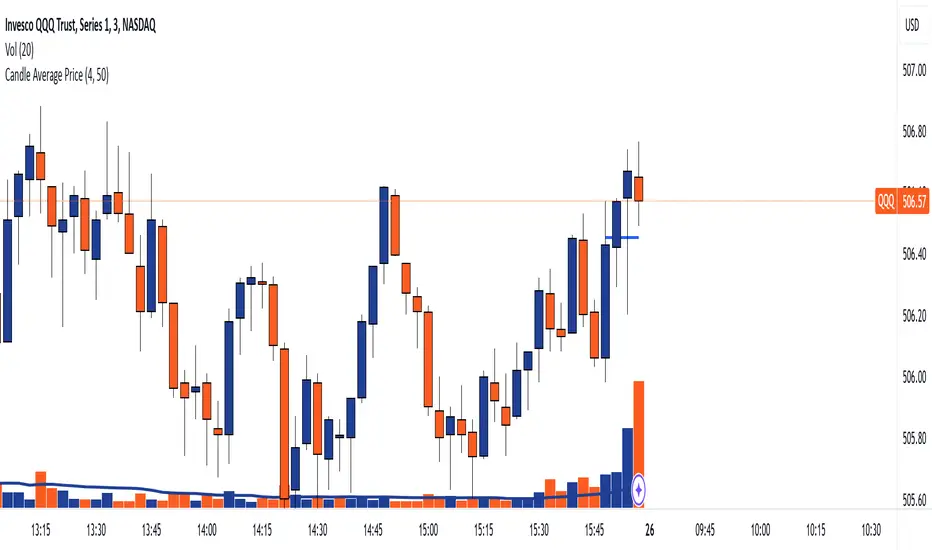
Candle Average PriceOverview
The Candle Average Price indicator is a custom tool designed to help traders identify key price levels by calculating and displaying the average price of recent candles on your TradingView chart. This indicator computes the average price based on a user-defined percentage of each candle's range over a specified number of candles. It then plots a horizontal line representing this average, covering only the last N candles as defined by you.
Key Features
Customizable Number of Candles: Define how many past candles to include in the average calculation.
Adjustable Percentage Level: Choose any percentage of each candle's range (from low to high) to calculate the price level.
Dynamic Horizontal Line: The indicator plots a horizontal line representing the calculated average, updating with each new bar and covering only the specified number of candles.
How It Works
Price at Specified Percentage:
For each candle, the indicator calculates a price level at your chosen percentage within the candle's range.
Formula: Price = Low + (Percentage Level / 100) * (High - Low)
Average Price Calculation:
It computes the average of these price levels over the last N candles.
Formula: Average Price = Sum of Price Levels over N Candles / N
Horizontal Line Plotting:
A horizontal line is drawn at the calculated average price level.
The line spans from N candles ago to the current candle, covering exactly the number of candles specified.
Input Parameters
Number of Candles (length):
Description: The number of recent candles over which the average is calculated.
Default Value: 4
Range: 1 to any positive integer.
Usage: Adjust this to include more or fewer candles in the calculation. A higher number smooths the average, while a lower number makes it more responsive to recent price changes.
Percentage Level (%):
Description: The percentage within each candle's range to calculate the price level.
Default Value: 50%
Range: 0% (candle low) to 100% (candle high).
Usage: Modify this to focus on different parts of each candle:
0%: Uses the low of each candle.
50%: Uses the midpoint of each candle.
100%: Uses the high of each candle.
Custom Percentage: Any value between 0% and 100% to target specific levels.
How to Use the Indicator
Adding the Indicator to Your Chart:
Open the TradingView chart of your preferred financial instrument.
Click on Indicators at the top of the chart.
Select Invite-Only Scripts if you've saved the script there, or use the Pine Editor to paste and apply the script.
Configuring the Settings:
After adding the indicator, click on the gear icon ⚙️ next to its name to open settings.
Adjust the Number of Candles (length) to your desired period.
Set the Percentage Level (%) (percentage) to the specific level within each candle's range you want to analyze.
Interpreting the Horizontal Line:
The horizontal line represents the average price calculated based on your inputs.
It updates with each new bar, always reflecting the most recent data over the specified number of candles.
The line only spans the last N candles, providing a focused view of recent price action.
Practical Applications
Identifying Support and Resistance Levels:
The average price line can act as a dynamic support or resistance level.
Traders can watch for price reactions around this line to make trading decisions.
Trend Analysis:
Observing how the price interacts with the average line can provide insights into the current trend's strength and potential reversals.
Entry and Exit Signals:
Use the line as a reference point for setting stop-loss orders or taking profits.
Combine it with other indicators for more robust trading signals.
In highly volatile markets, consider increasing the number of candles to avoid false signals.
Limitations and Considerations
Not a Standalone Tool:
This indicator should not be used in isolation for making trading decisions. Always consider additional analysis.
Market Conditions Matter:
The indicator may perform differently in trending markets versus ranging markets.
Data Refresh:
Ensure you have a stable internet connection and that your TradingView chart is set to the correct time frame.
Conclusion
The Candle Average Price indicator is a flexible and user-friendly tool that provides valuable insights into recent price action by calculating the average price based on your specific criteria. By adjusting the parameters to suit your trading style, you can incorporate this indicator into your technical analysis to help identify potential trading opportunities.
Disclaimer: Trading financial instruments involves risk, and past performance is not indicative of future results. This indicator is a tool to assist in analysis and should not be considered financial advice.
Happy Trading!
Asian Range IndicatorIndicator Name:
Asian Range Indicator
Description:
This TradingView indicator is designed to accurately detect the price range during the Asian session, based on our trading strategy. This range is crucial for planning trades in the European and American sessions. Using advanced algorithms, the indicator automatically identifies and plots the highs and lows within the Asian session period, highlighting them on the chart with shaded areas for clear visualization. This helps traders anticipate breakouts and set more precise entry and exit levels.
How to Use the Indicator:
Add the indicator to your TradingView chart.
Observe the shaded areas representing the Asian range.
Use these levels to plan your trades during the European and American sessions.
Combine with other technical indicators to confirm your trading decisions.
Chart:
The chart published with this script is clean and easy to understand, clearly showing the Asian range highlighted with shaded areas. No other scripts are included, ensuring the indicator's output is easily identifiable. The shaded areas contribute to the visual understanding of the Asian range, helping traders effectively use the script.
Wave LineWave Line is a chart type obtained by plotting the High and Low values in each time interval according to their sequential order. This method produces a continuous line rather than bars, which is beneficial for analyzing changes within each interval rather than focusing on the price range and open/close values. E.g for Wave Analysis.
How to use:
1. Adjust the interval unit and multiplier for the main timeframe.
2. Ideally, select a lower timeframe on your chart, approximately 5 times smaller than the one specified for the script.
3. Lower Timeframe is the timeframe which will be the scripts reference when the high and low of the main timeframe align on a single bar of the opened chart. This timeframe may also be 5-10 times smaller than the main timeframe. It is important to note that this should not be excessively smaller as the script may fail in retrieving data. An alternative method is included to estimate the order if it is not clear in the fetched data.
4. Set a preferred value for Monowave Length, indicating the number of bars a monowave will cover horizontally. Set the value to be half of the Interval Multiplier for the Wave Line to align with the bar chart. However if the multiplier is an odd number, perfect alignment may not be achieved.
5. Ensure that the product of Max Polyline Segments and Monowave length does not exceed 5000, and adjust the value for Max Polyline Segments accordingly.

RSI Graphique and Dashboard MTFMTF RSI Indicator - User Guide
Introduction:
The MTF RSI (Multi-Timeframe Relative Strength Index) Pine Script is designed to provide traders with a comprehensive view of the RSI (Relative Strength Index) across multiple timeframes. The script includes a primary chart displaying RSI values and a dashboard summarizing RSI trends for different time intervals.
Installation:
Copy the provided Pine Script.
Open the TradingView platform.
Create a new script.
Paste the copied code into the script editor.
Save and apply the script to your chart.
Primary Chart:
The primary chart displays RSI values for the selected timeframe (5, 15, 60, 240, 1440 minutes).
different color lines represent RSI values for different timeframes.
Overbought and Oversold Levels:
Overbought levels (70) are marked in red, while oversold levels (30) are marked in blue for different timeframes.
Dashboard:
The dashboard is a quick reference for RSI trends across multiple timeframes.
Each row represents a timeframe with corresponding RSI trend information.
Arrows (▲ for bullish, ▼ for bearish) indicate the current RSI trend.
Arrow colors represent the trend: blue for bullish, red for bearish.
Settings:
Users can customize the RSI length, background color, and other parameters.
The background color of the dashboard can be adjusted for light or dark themes.
Interpretation:
Bullish Trend: ▲ arrow and blue color.
Bearish Trend: ▼ arrow and red color.
RSI values above 70 may indicate overbought conditions, while values below 30 may indicate oversold conditions.
Practical Tips:
Timeframe Selection: Consider the trend alignment across different timeframes for comprehensive market analysis.
Confirmation: Use additional indicators or technical analysis to confirm RSI signals.
Backtesting: Before applying in live trading, conduct thorough backtesting to evaluate the script's performance.
Adjustment: Modify settings according to your trading preferences and market conditions.
Disclaimer:
This script is a tool for technical analysis and should be used in conjunction with other indicators. It is not financial advice, and users should conduct their own research before making trading decisions. Adjust settings based on personal preferences and risk tolerance. Use the script responsibly and at your own risk.

Sublime Trading | Trend Strength FilterWhat kind of traders/investors are we?
We are trend followers. Our scripts are designed to be used on the higher timeframes (weekly/daily) to catch the large moves/trends in the market.
Most have heard of long-term trend following. Few know how to execute the strategy.
Our scripts are designed specifically to identify and invest in long-term market trends.
What does this script do?
Identifying trends is at the heart of sound investing.
This script is colour coded to help identify long-term trends and environments where you will want to consider taking positions.
It is also designed to identify sideways/consolidating markets, environments where you will want to consider standing aside.
How is the trailing stoploss produced?
The script uses two sets of Bollinger Bands, one with setting Standard Deviation 1 and the other with Standard Deviation 2.
These settings help to create 3 zones - Buy, Sell and Stand Aside.
The bars will change colour according to which zone they are in.
The Buy zone is colour-coded green, and when a bull market or the start of a bull trend is in play. The green switches from light green to dark green as the asset’s price moves above the Buy zone.
This switch in colour serves as a warning that a reversal/pullback may occur next from bullish to bearish.
The Sell zone is colour-coded red and when a bear market or the start of a bear trend is in play. The red switches from light red to dark red as the asset’s price moves below the Sell zone.
This switch in colour serves as a warning that a reversal/pullback may occur next from bearish to bullish.
The Stand Aside is confirmed when the colour-code changes to grey. This may not necessarily mean a trend reversal but simply a time to apply patience before a trend continuation.
A sustained mixture of red, green and grey bars confirms a consolidation or sideways market and when investors/traders will want to stand aside and consider another asset.
What is the best timeframe to use the script?
Long-term trends are identified on the daily and weekly timeframes where traders and investors take fewer positions but hold for longer time periods.
We recommend using the script in unison on the weekly and daily timeframes.
When both timeframes fall into the Buy zone and colour-coded green, it signifies a strong bull market.
When both timeframes fall into the Sell zone and colour-coded red, it signifies a strong bear market.
When there is a mixture of green, red and grey bars across the two timeframes, it signifies a sideways market and when investors stand aside and protect their capital.
The weekly timeframe will also help mask the noise on the daily timeframe, allowing you to hold positions longer.
The Trailing Strength Filter script is for investors who want to identify and invest in long-term trends whilst simultaneously eliminating intraday swings.
What makes this script unique?
Identifying the start of long-term trends and then riding out established trends are among the main struggles budding investors face. This script has been coded specifically for the daily and weekly timeframe to:
Seamlessly identify the start, middle and end of trends
Align with the market and remove social media noise calling market tops and bottoms
Allow for discretion when entering but particularly exiting of positions if a market trend has not ended
This trend filter script ensures alignment with long-term market trends.

Monthly Strategy Performance TableWhat Is This?
This script code adds a Monthly Strategy Performance Table to your Pine Script strategy scripts so you can see a month-by-month and year-by-year breakdown of your P&L as a percentage of your account balance.
The table is based on realized equity rather than open equity, so it only updates the metrics when a trade is closed.
That's why some numbers will not match the Strategy Tester metrics (such as max drawdown), as the Strategy Tester bases metrics like max drawdown on open trade equity and not realized equity (closed trades).
The script is still a work-in-progress, so make sure to read the disclaimer below. But I think it's ready to release the code for others to play around with.
How To Use It
The script code includes one of my strategies as an example strategy. You need to replace my strategy code with your own. To do that just copy the source code below into a blank script, delete lines 11 -> 60 and paste your strategy code in there instead of mine. The script should work with most systems, but make sure to read the disclaimer below.
It works best with a significant amount of historical data, so it may not work very effectively on intraday timeframes as there is a severe limitation of available bars on TradingView. I recommend using it on 4HR timeframes and above, as anything less will produce very little usable data. Having a premium TradingView plan will also help boost the number of available bars.
You can hover your mouse over a table cell to get more information in the form of tooltips (such as the Long and Short win rate if you hover over your total return cell).
Credit
The code in this script is based on open-source code originally written by QuantNomad, I've made significant changes and additions to the original script but all credit for the idea and especially the display table code goes to them - I just built on top of it:
Why Did I Make This?
None of this is trading or investment advice, just my personal opinion based on my experience as a trader and systems developer these past 6+ years:
The TradingView Strategy Tester is severely limited in some important ways. And unless you use complex Excel formulas on exported test data, you can't see a granular perspective of your system's historical performance.
There is much more to creating profitable and tradeable systems than developing a strategy with a good win rate and a good return with a reasonable drawdown.
Some additional questions we need to ask ourselves are:
What did the system's worst drawdown look like?
How long did it last?
How often do drawdowns occur, and how quickly are they typically recovered?
How often do we have a break-even or losing month or year?
What is our expected compounded annual growth rate, and how does that growth rate compare to our max drawdown?
And many more questions that are too long to list and take a lifetime of trading experience to answer.
Without answering these kinds of questions, we run the risk of developing systems that look good on paper, but when it comes to live trading, we are uncomfortable or incapable of enduring the system's granular characteristics.
This Monthly Performance Table script code is intended to help bridge some of that gap with the Strategy Tester's limited default performance data.
Disclaimer
I've done my best to ensure the numbers this code outputs are accurate, and according to my testing with my personal strategy scripts it appears to work fine. But there is always a good chance I've missed something, or that this code will not work with your particular system.
The majority of my TradingView systems are extremely simple single-target systems that operate on a closed-candle basis to minimize many of the data reliability issues with the Strategy Tester, so I was unable to do much testing with multiple targets and pyramiding etc.
I've included a Debug option in the script that will display important data and information on a label each time a trade is closed. I recommend using the Debug option to confirm that the numbers you see in the table are accurate and match what your strategy is actually doing.
Always do your own due diligence, verify all claims as best you can, and never take anyone's word for anything.
Take care, and best of luck with your trading :)
Kind regards,
Matt.
PS. If you're interested in learning how this script works, I have a free hour-long video lesson breaking down the source code - just check out the links below this script or in my profile.

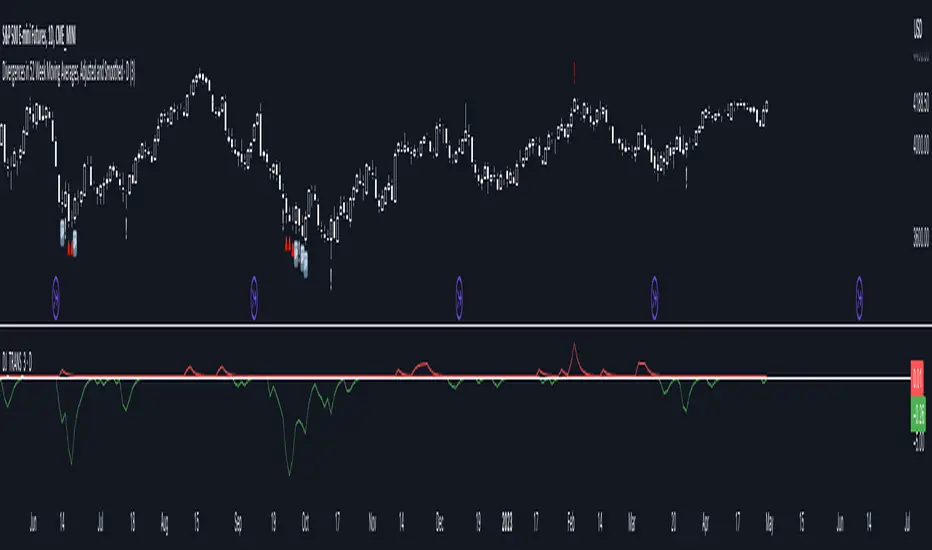
Divergences in 52 Week Moving Averages, Adjusted and SmoothedThis script description is intended to be holistic and comprehensive for the understanding of the interested parties who view the script.
Following the PineCoders suggestions, I have provided detailed breakdowns both within the code and in the description immediately below:
► Description
This description is intended to be detailed and meaningful, conveying the understanding of the script’s intention to the user:
The theory: Divergences and extreme readings in 52-Week highs on major indexes can provide a view into a potential pending move in the opposite direction of how the market has been trending. By comparing the 52-Week Hi/Lo indices and applying an Exponential Moving Average (EMA), we can assess how extreme a move is from the average. If the move provides an extreme reading, it would potentially be beneficial to “fade” the move (take a position in the opposing direction).
The intention: The intentionality of this script is to provide a visualization of when the highly-probable opportunity to fade over a multi-day or multi-week period arises. In addition to this, based on backtesting prior moves and reading the various levels of significant reversals, three tiers: “Standard”, “Sensitive”, and “Highly Sensitive” have been applied, the user can choose which sensitivity level they would like to see, there are far less false positives on the Standard and Sensitive settings, while Highly Sensitive often signals multiple times with the move coming a few days later.
The application: The settings allow the user to customize their sensitivity to the fade signals, with the ability to customize the visual that shows up as well. For higher-highs that are fade-worthy, the signal will appear on the top of the candle, for lower-lows that are fade-worthy, the signal will appear on the bottom of the candle. The users risk criteria should be the primary driver of the entry/exit, although when backtesting it appears that the significant move is typically completed within a 2-4 week period at max and 3-5 day period at minimum.
A personal note: I am a futures trader intraday but would very strongly caution users when using this strategy with futures (unless their risk tolerance is higher than most). The most beneficial strategy when fading moves would be to enter in tranches, starting at the first signal and adding on any pullback (as long as the pullback is not below the initial entry point). 1-6 Week Date-To-Expiry options would be the primary method for applying this strategy. I would also like to add that SPY/SPX options (SPDR S&P 500 ETF Trust / CBOE S&P 500 Index) are the most liquid options that could be applied in this strategy.
► Description (additional)
With the understanding that few users can read pinescript (Pine), the description above contains all of the necessary information that is necessary for a user to understand the intention for script utilization. For those who do understand Pine, the code is commented in each section in order to provide an understanding of the underlying functions, calculations, and thought process that went on during the writing of the script.
► Description (additional)
This script’s description contains no delegations, all aspects of the script as well as the initial idea behind it are contained in the description above, which is self-contained in it’s entirety with a clear and defined purpose that is written with the intent to holistically capture the intent of the potential use for this indicator.
► General House Rule #2
This script and the description (as well as my profile) contain no links or associations to promotion of any kind, I am not a business, I am not an individual that will in any way make money from this script or the promotion of another person, idea, company, entity, or legal persons (foreign or domestic).
► Originality and usefulness
This is an original and custom script (and idea) that is not a rehashing or a copy of any code from any other programmers in the tradingview community.