VWAP Diario + VWAP 08:00-12:00 ventanas NYWhat it plots
Daily VWAP (main line)
Anchored to the current trading day and only visible between 19:00 and 16:50 New York (UTC-5) to prevent any “ghost” segments.
Dynamic color: turns green when price closes above (bullish bias) and red when price closes below (bearish bias).
Optional standard-deviation/percentage bands (off by default).
08:00–12:00 VWAP (morning line)
Resets at 08:00 NY and shows until 12:00 NY only.
Acts as a morning value guide for early direction and pullbacks.
Clean rendering: Both lines use strict time masks and line breaks, so nothing is drawn outside their windows. You can toggle either line on/off.
How to Read It
Daily VWAP ≈ “fair value” of the whole session; use it for directional bias and confluence.
08:00–12:00 VWAP ≈ “fair value” of the morning; helps refine entries during the open.
Alignment:
Bullish environment: price and 08–12 VWAP sit above the Daily VWAP.
Rotation/mixed: price oscillates between the two lines.
Bearish: price and 08–12 VWAP sit below the Daily VWAP.
Two Mechanical Playbooks
Recommended charts: 1-minute for entries, 5-minute for context on NQ/Nasdaq100.
Primary execution window: 09:30–12:00 NY.
A) Trend Play (Break → Pullback to VWAP)
Goal: Join the day’s impulse with value confirmation.
Rules
Bias filter before 09:30
Bullish: 08–12 VWAP ≥ Daily VWAP; Bearish: 08–12 ≤ Daily.
First push 09:30–09:45 breaks the initial range high (bull) or low (bear).
Entry (pullback into confluence)
Wait for a pullback that tags/wicks the 08–12 VWAP or the Daily VWAP in the direction of bias.
Go long on bullish rejection (close back above); short on bearish rejection.
Stop-loss
Beyond the rejection wick or the touched VWAP (e.g., 1–1.5× ATR(1m/5m)).
Take-profit
TP1 = 1R (scale 50%); TP2 = 2–3R or day extremes (HOD/LOD).
If bands are on, consider exiting on a clean tag of the opposite band.
Management
Move to breakeven at 1R; exit early if price reclaims the opposite side of Daily VWAP.
Avoid when the morning is choppy and price sits glued between the two VWAPs.
B) Mean-Reversion Play (Controlled Reversal at Daily VWAP)
Goal: Capture a return to value after an overstretch and a clean rejection.
Rules
Stretch condition
Fast move away from Daily VWAP (3–5 bars) or beyond Band #1/#2 if enabled.
Rejection signal at Daily VWAP
A bar that touches Daily VWAP and closes back on the opposite side (pin/engulfing/strong close).
Entry
Long if a selloff rejects above Daily VWAP.
Short if a rally rejects below Daily VWAP.
Stop-loss
Just beyond the rejection wick or ~1× ATR(1m).
Take-profit
TP1 = 1R or the 08–12 VWAP; TP2 = 2–3R or a prior consolidation.
Management
If price crosses and holds on the other side of Daily VWAP (2 closes), cut the idea.
Avoid during high-impact news or when the session is strongly trending (prefer Play A).
Quality Filters
Volatility: Ensure ATR(14, 1m) or the 09:30–09:45 range exceeds your minimum.
Spread/liquidity: Skip abnormal spreads at the open.
News: If a red-level release is imminent, wait 2–3 bars after the print.
Coherence: Prefer trades when 08–12 and Daily VWAP don’t conflict.
Risk & Trade Management
Risk per trade: 0.25%–0.5% account risk.
Daily cap: 2–3 trades; stop for the day at –1R to –1.5R.
No over-reentry: Don’t chase if price is sitting exactly on a VWAP; wait for separation.
Log your metrics: setup type (A/B), confluences, distance to VWAP at trigger, time, R multiple.
Quick Pre-Trade Checklist
Bias aligned? (price vs Daily and 08–12 VWAP)
Choose Trend or Mean-Reversion play
Clear confluence at the VWAP line?
Realistic stop (≤ ~1.5× ATR 1m)?
Any imminent news?
TP plan: TP1 = 1R → BE, TP2 = 2–3R.
Search in scripts for "tp"

ETH Short-Term VWAP+EMA/RSI (ATR Risk, <1h) (James Logan)ETH Short-Term VWAP + EMA / RSI Strategy (ATR-based Risk Control)
A short-term (< 1 hour) ETH trading system designed for intraday scalps and momentum swings on 5- to 15-minute charts.
It blends trend confirmation (EMA 50 / 200) with intrabar structure (EMA 21 pullback & VWAP filter) and RSI momentum triggers, managing exits dynamically through ATR-based stop, take-profit, and trailing stop targets.
Core logic
• Long when RSI crosses above the threshold within an up-trend (EMA 50 > EMA 200) and price is above VWAP.
• Short when RSI crosses below threshold within a down-trend (EMA 50 < EMA 200) and price is below VWAP.
• Optional pullback confirmation to the 21-EMA for cleaner entries.
• Risk defined by ATR-multiples for stop-loss, take-profit, and an adaptive trailing stop.
• Automatic flat-out exit after a set number of bars (time-based close).
Best use
• 5 min – 15 min ETH/USDT charts (Binance, Bybit, Coinbase, etc.)
• Works with both spot and perpetual data.
• Tune ATR and RSI thresholds per venue; defaults are balanced for 0.05 % per-side fees.
Key parameters
• ATR SL × 1.6 ATR TP × 2.2 ATR Trail × 2.0
• RSI 50 cross | EMA 50/200 trend filter | VWAP confirmation
• Default position sizing = USD-based (e.g. $1 000 per trade).
Notes
• All orders and exits are simulated at bar close; use 1-minute bar magnifier for finer fill modeling.
• No repainting—uses only confirmed bar data.
• Best validated with ≥ 200 trades and profit factor > 1.25 over multi-month backtests.

jinhanborasaeg bori indicator ENHello, I'm jinhanborasaeg.
This indicator was created by modifying the free indicator "Vumanchu Free Swing."
It was developed with Claude's assistance and includes
additions such as no-repaint functionality, TP/SL, and more.
For settings, you should use High instead of Close for better results.
Below is the link to an indicator I created by combining 20 different indicators,
which showed good backtesting results. If you're interested,
I'd appreciate it if you could take a look.
jinhanborasaeg.gumroad.com

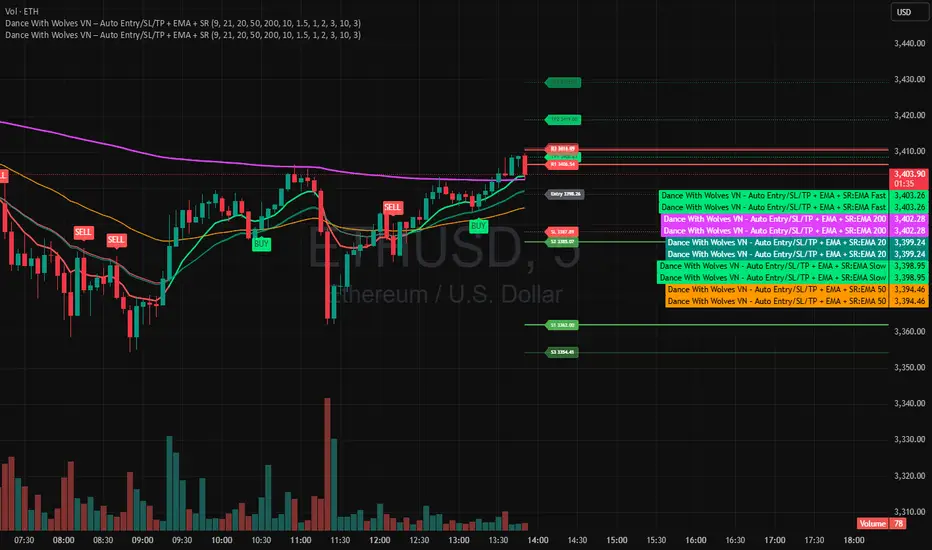
Dance With Wolves VN PublicDance With Wolves VN
Indicator kết hợp EMA 9/21 để vào lệnh nhanh, thêm EMA 20/50/200 để xem trend lớn.
Tự tạo Entry, SL, TP1, TP2, TP3 theo ATR.
Vẽ luôn 3 mức kháng cự (R1–R3) và 3 mức hỗ trợ (S1–S3) từ pivot gần nhất.
Dùng tốt cho khung 1m–15m với crypto, stock, futures.
Dance With Wolves VN — Smart EMA Strategy
This indicator combines EMA 20/50/200 trend tracking, automatic Buy/Sell signals, Take Profit & Stop Loss levels, and Support/Resistance zones.
It helps traders identify clean entries, manage risk with visual TP/SL targets, and follow market trends with clarity.
Created by Dance With Wolves VN — a community project for traders who value discipline, teamwork, and precision.
Elliott Wave Expert AdvisorElliott Wave Expert Advisor - Professional Wave Analysis Tool
OVERVIEW
--------
The Elliott Wave Expert Advisor is a comprehensive Pine Script indicator designed for TradingView that automates Elliott Wave analysis and generates high-probability trading signals. Built on Ralph Nelson Elliott's Wave Principle, this indicator identifies impulse wave patterns, validates them against strict Elliott Wave rules, and provides precise entry points with calculated risk management levels.
CORE FUNCTIONALITY
------------------
1. TREND DETECTION
- Dual Moving Average system (Fast/Slow MA)
- MACD confirmation for trend strength
- Automatic trend classification (Uptrend/Downtrend/Sideways)
- Only generates signals aligned with main trend
2. SWING POINT DETECTION
- Automatic pivot high/low identification
- Configurable sensitivity (lookback periods)
- Minimum swing size filtering to reduce noise
- ZigZag visualization connecting swing points
3. WAVE IDENTIFICATION
- 5-wave impulse pattern recognition (1-2-3-4-5)
- 3-wave corrective pattern detection (A-B-C)
- Wave labels displayed on chart
- Color-coded validation status (Blue = Valid, Orange = Pending)
4. ELLIOTT WAVE RULES VALIDATION
Strictly enforces three cardinal rules:
- Rule 1: Wave 2 never retraces more than 100% of Wave 1
- Rule 2: Wave 3 is never the shortest impulse wave
- Rule 3: Wave 4 never overlaps Wave 1 price territory
5. FIBONACCI ANALYSIS
- Automatic Fibonacci retracement calculations (23.6%, 38.2%, 50%, 61.8%, 78.6%)
- Fibonacci extension projections (100%, 161.8%, 261.8%)
- Wave 3 and Wave 5 target projections
- Fibonacci-based Take Profit levels
6. SIGNAL GENERATION
- Entry signals at Wave 2 completion (catch Wave 3)
- Entry signals at Wave 4 completion (catch Wave 5)
- Automatic Stop Loss placement below/above pivot points
- Multiple Take Profit targets (TP1 at 1.618 extension, TP2 at Wave 5 projection)
- Risk/Reward ratio calculation and filtering
- Minimum R:R threshold (default 1.5:1)
7. VISUAL ELEMENTS
- Pivot markers (H/L) showing swing highs and lows
- ZigZag lines connecting swing points
- Wave number labels (1-2-3-4-5) with validation colors
- Entry signal arrows (Green = BUY, Red = SELL)
- Stop Loss lines (Red dashed)
- Take Profit lines (Green dashed and dotted)
- Real-time status dashboard showing:
* Number of pivots detected
* Wave count progress (X/5)
* Pattern validation status
* Market trend direction
* Signal active status
* Helpful tips and guidance
OPTIMAL USAGE
-------------
• Timeframes: H1, H4, D1 (avoid M1-M5 due to noise)
• Markets: Forex majors (EUR/USD, GBP/USD), Gold (XAU/USD), Major Cryptocurrencies
• Market Conditions: Strong trending markets (avoid ranging/sideways conditions)
• Risk Management: Never risk more than 1-2% per trade
• Position Sizing: Based on calculated Stop Loss distance
CONFIGURATION PARAMETERS
------------------------
Trend Detection:
- MA Fast Period (default: 20)
- MA Slow Period (default: 50)
- MACD settings (12/26/9)
Swing Detection:
- Pivot Lookback Left/Right (default: 10/10, reduce to 5/5 for M15)
- Min Swing Size % (default: 0.1%, reduce to 0.05% for M15)
Wave Detection:
- Min Wave Size % (default: 0.5%, reduce to 0.2-0.3% for smaller timeframes)
Risk Management:
- SL Buffer % (default: 0.1%)
- TP1 Fibonacci Ratio (default: 1.618)
- Min Risk/Reward (default: 1.5)
Visualization:
- Toggle visibility for MAs, ZigZag, Wave Labels, Signals, SL/TP
- Customizable colors for all elements
- Optional trend background coloring
IMPORTANT NOTES
---------------
• Elliott Wave analysis is subjective - this indicator implements one specific interpretation
• Works best in trending markets; automatically suppresses signals in sideways conditions
• Signals are NOT repainting after pivot confirmation
• Not a "holy grail" - combine with other analysis and proper risk management
• Requires patience - quality setups are infrequent but high-probability
• Always backtest on historical data before live trading
ELLIOTT WAVE THEORY BACKGROUND
------------------------------
Elliott Wave Theory, developed by Ralph Nelson Elliott in the 1930s, proposes that market prices move in predictable wave patterns driven by investor psychology. An impulse wave consists of five sub-waves (three in the trend direction, two corrections), followed by a three-wave correction. This indicator automates the identification of these patterns and validates them against Elliott's original rules.
DISCLAIMER
----------
This indicator is for educational and informational purposes only. Past performance does not guarantee future results. Always conduct your own analysis and never trade with money you cannot afford to lose. The indicator provides signals based on technical analysis patterns and does not constitute financial advice.
VERSION
-------
v1.0 - Initial Release
Pine Script v5
Created: 2024
SUPPORT
-------
For detailed usage instructions, refer to the included documentation:
- usage_guide.md - Complete user manual with examples
- elliott_rules.md - Elliott Wave theory reference and implementation details

Adaptive CE-VWAP Breakout Framework [KedArc Quant]Description
A structured framework that unites three complementary systems into one charting engine:
Chandelier Exit (CE) – ATR-based trailing logic that defines trend direction, stop placement, and risk/reward overlays.
Swing-Anchored VWAP (SWAV) – a dynamically anchored VWAP that re-starts from each confirmed swing and adapts its smoothness to volatility.
Pivot S/R with Volume Breaks – confirmed horizontal levels with alerts when broken on expanding volume.
This script builds a single workflow for bias → trigger → managementwithout mixing unrelated indicators. Each module is internally linked rather than layered cosmetically, making it a true analytical framework—not.
Acknowledgment
Special thanks to Dynamic Swing Anchored VWAP by Zeiierman, whose swing-anchoring concept inspired a part of the SWAV module’s implementation and adaptation logic.
Support and Resistance Levels with Breaks by LuxAlgo for S/R breakout logic.
How this helps traders
Trend clarity – CE color-codes direction and provides evolving stops.
Context value – SWAV traces adaptive mean paths so traders see where price is heavy or light.
Action filter – Pivot+volume logic highlights true structural breaks, filtering false moves.
Discipline tool – Optional R:R boxes visualize risk and target zones to enforce planning.
Entry / Exit guidelines (for study purposes only)
Bias Use CE direction: green = long bias red = short bias
Entry
1. Breakout method– Trade in CE direction when a pivot level breaks on valid volume.
2. VWAP confirmation– Prefer breaks occurring around the nearest SWAV path (fair-value cross or re-test).
Exit
Stop = CE line / recent swing HL / ATR × (multiplier)
Target = R-multiple × risk (default 2 R)
Optional live update keeps SL/TP aligned with current CE state.
Core formula concepts
ATR Stop: Stop = High/Low – ATR × multiplier
VWAP calc: Σ(price × vol) / Σ(vol) anchored at swing pivot, adapted by APT (Adaptive Price Tracking) ratio ∝ ATR volatility.
Volume oscillator: 100 × (EMA₅ – EMA₁₀)/EMA₁₀; valid break when threshold %.
Input configuration (high-level)
Master Controls
Show CE / SWAV modules Theme & Fill opacity
CE Section
ATR period & multiplier Use Close for extremums
Show buy/sell labels Await bar confirmation
Risk-Reward overlay: R-multiple, Stop basis (CE/Swing/ATR×), Live update toggle
SWAV Section
Swing period Adaptive Price Tracking length Volatility bias (ATR-based adaptation) Line width
Pivot & Volume Breaks
Left/Right bar windows Volume threshold % Show Break labels and alerts
Best timeframes
Intraday: 5 m – 30 m for breakout confirmation
Swing: 1 h – 4 h for trend context
Settings scale with instrument volatility—adjust ATR period and volume threshold to match liquidity.
Glossary
ATR: Average True Range (volatility metric)
CE: Chandelier Exit (trailing stop/trend filter)
SWAV: Swing-Anchored VWAP (anchored mean price path)
Pivot H/L: Confirmed local extrema using left/right bar windows
R-multiple: Profit target as a multiple of initial risk
FAQ
Q: Does it repaint? A: No—pivots wait for confirmation and VWAP updates forward-only.
Q: Can modules be disabled? A: Yes—each section has its own toggle.
Q: Can it trade automatically? A: This is an indicator/study, not an auto-strategy.
Q: Is this financial advice? A: No—educational use only.
Disclaimer
This script is for educational and analytical purposes only.
It is not financial advice. Trading involves risk of loss. Past performance does not guarantee future results. Always apply sound risk management.

Momentum Swing 1–3 Weeks
✅ Entry (LONG) Conditions
Price above EMA9 and SMA20
SMA20 > SMA50 (trend confirmation)
MACD above the signal line
RSI between 50–65 (healthy momentum)
Volume at least 20% above the 20-day average
When all conditions align, a LONG signal is generated.
✅ Exit (SELL) Conditions
Price closes below EMA9
MACD gives a bearish crossover
Or TP/SL levels are hit
Position is closed.
✅ Multi-Stage Take Profit
TP1: ATR × 1.5 → closes 50% of the position
TP2: ATR × 3.0 → closes remaining 50%
✅ Stop Loss
ATR × 1.5 dynamic SL
✅ What This Strategy Aims For
Catching early trend continuation signals
Filtering weak / low-volume breakouts
Exiting when momentum fades
Eliminating emotional decision-making through rules
📌 Note
Backtest performance may vary by symbol and volatility. Proper risk management is strongly recommended.

Stoch PRO + Dynamic EMA (EMA cross)Stoch PRO + Dynamic EMA Documentation
Overview:
- Pine Script v6 overlay indicator combining a trend-colored EMA with a Stochastic oscillator to highlight midline momentum shifts.
- Designed for TradingView charts (Indicators → Import) as a visual aid for timing entries within trend-following setups.
- Crafted and optimized around BTCUSDT on the 4h timeframe; adapt inputs before applying to other markets or intervals.
Inputs:
- EMA Length (default 50): smoothing window for the dynamic EMA; lower values respond faster but whipsaw more.
- Stochastic K Length (20): lookback for the raw %K calculation.
- Stochastic K Smoothing (3): SMA applied to %K to reduce noise.
- Stochastic D Smoothing (3): SMA over %K to produce the companion %D line.
Visual Elements:
- EMA plotted on price with linewidth 3; teal when close > EMA, fuchsia otherwise.
- Background tinted teal/fuchsia at high transparency (≈92) to reinforce the current trend bias without obscuring price bars.
Oscillator Logic:
- %K = ta.stoch(high, low, close, kLength); smoothed with ta.sma(kRaw, kSmooth).
- %D = ta.sma(k, dSmooth).
- Focus is on the midline (50) rather than traditional 20/80 extremes to emphasize rapid momentum flips.
Signals:
- Buy: %K crossing above 50 while close > EMA (teal state). Plots tiny teal circle below the bar.
- Sell: %K crossing below 50 while close < EMA (fuchsia state). Plots tiny purple circle above the bar.
Trading Workflow Tips:
- Use EMA/background color for directional bias, then confirm with %K 50-cross to refine entries.
- Consider higher-timeframe trend filters or price-action confirmation to avoid range chop.
- Stops often sit just beyond the EMA; adjust thresholds (e.g., 55/45) if too many false positives occur.
- Always plan risk/reward upfront—define TP/SL levels that fit your strategy and backtest them thoroughly before trading live.
Alerts & Extensions:
- Wrap crossUp/crossDown in alertcondition() if TradingView alerts are needed.
- For automation/backtesting, convert logic to a strategy() script or add position management rules.

Cloud and Table - Ostinato TradingMain indicator of Ostinato Trading, the moving averages cloud and table. You can superpose various moving averages, bollinger bands and their color fill. Additionaly the table is used to plot the distance from the price to moving averages, the ATR value, the stop loss ... You can also plot a bulls eyes of SL and TP in points to visualise it on the chart.

SMC ORB vs PM ALPHADesigned to stack institutional confluences such as Smart Money Concepts, Inner Circle Trading, volatility, and market structure.
Plots pre-market high/low and 15 Opening Range.
Plots first sweep of Pre-market high/low as well as orb break/holds.
TP of Previous high/low & SL optional

Low and Preceding High (Breakout + Bullis fgv + Extending Fib)🚀 Last Low & Preceding High: Bullish Reversal Strategy
This indicator identifies high-probability long setups by confirming a Bullish Market Structure Shift (BMS) coupled with a strong momentum filter.
🧠 Indicator Logic (How It Works)
The core function of this tool is to automatically locate the key structural points that lead to a bullish bias:
Structure Identification: It first defines a Range between the two most recent Pivot Lows. Within this range, it finds the Preceding High (the highest close before the current low) and the true Low Anchor (the lowest low/tail of the pivot low).
Breakout and Momentum Filter: A valid signal requires two conditions to be met on the current bar:
Bullish Breakout: The price must close above the Preceding High.
Marubozu Confirmation: A strong Bullish Marubozu candle (minimal wicks) must be present in the impulse move from the low, filtering for institutional strength.
Fibonacci Discount Zones: Upon confirmation, the indicator calculates and plots the discount zones (0.50, 0.618, 0.786) using the true extremes (tail-to-tail anchors). These zones start extending from the breakout candle and represent high-value areas for potential entries.
🎯 Entry and Risk Management
The strategy provides clear rules for execution once the logic is confirmed:
Entry Execution:
Wait for Retracement: Enter a Long position when the price retraces back into the colored Discount Zones (0.50 to 0.786).
Risk Control:
🛑 Stop Loss (SL): Placed below the Low Line (the swing low that initiated the move).
✅ Take Profit (TP): Placed above the High Line (the high that was broken).
Final note
"Special thanks to Mr. Mazen (@dr0chart) for developing this strategy."

[Parth🇮🇳] Wall Street US30 Pro - Prop Firm Edition....Yo perfect! Here's the COMPLETE strategy in simple words:
***
## WALL STREET US30 TRADING STRATEGY - SIMPLE VERSION
### WHAT YOU'RE TRADING:
US30 (Dow Jones Index) on 1-hour chart using a professional indicator with smart money concepts.
---
### WHEN TO TRADE:
**6:30 PM - 10:00 PM IST every day** (London-NY overlap = highest volume)
***
### THE INDICATOR SHOWS YOU:
A table in top-right corner with 5 things:
1. **Signal Strength** - How confident (need 70%+)
2. **RSI** - Momentum (need OK status)
3. **MACD** - Trend direction (need UP for buys, DOWN for sells)
4. **Volume** - Real or fake move (need HIGH)
5. **Trend** - Overall direction (need UP for buys, DOWN for sells)
Plus **green arrows** (buy signals) and **red arrows** (sell signals).
---
### THE RULES:
**When GREEN ▲ arrow appears:**
- Wait for 1-hour candle to close (don't rush in)
- Check the table:
- Signal Strength 70%+ ? ✅
- Volume HIGH? ✅
- RSI okay? ✅
- MACD up? ✅
- Trend up? ✅
- If all yes = ENTER LONG (BUY)
- Set stop loss 40-50 pips below entry
- Set take profit 2x the risk (2:1 ratio)
**When RED ▼ arrow appears:**
- Wait for 1-hour candle to close (don't rush in)
- Check the table:
- Signal Strength 70%+ ? ✅
- Volume HIGH? ✅
- RSI okay? ✅
- MACD down? ✅
- Trend down? ✅
- If all yes = ENTER SHORT (SELL)
- Set stop loss 40-50 pips above entry
- Set take profit 2x the risk (2:1 ratio)
***
### REAL EXAMPLE:
**7:45 PM IST - Green arrow appears**
Table shows:
- Signal Strength: 88% 🔥
- RSI: 55 OK
- MACD: ▲ UP
- Volume: 1.8x HIGH
- Trend: 🟢 UP
All checks pass ✅
**8:00 PM - Candle closes, signal confirmed**
I check table again - still strong ✓
**I enter on prop firm:**
- BUY 0.1 lot
- Entry: 38,450
- Stop Loss: 38,400 (50 pips below)
- Take Profit: 38,550 (100 pips above)
- Risk: $50
- Reward: $100
- Ratio: 1:2 ✅
**9:30 PM - Price hits 38,550**
- Take profit triggered ✓
- +$100 profit
- Trade closes
**Done for that signal!**
***
### YOUR DAILY ROUTINE:
**6:30 PM IST** - Open TradingView + prop firm
**6:30 PM - 10 PM IST** - Watch for signals
**When signal fires** - Check table, enter if strong
**10:00 PM IST** - Close all trades, done
**Expected daily** - 1-3 signals, +$100-300 profit
***
### EXPECTED RESULTS:
**Win Rate:** 65-75% (most trades win)
**Signals per day:** 1-3
**Profit per trade:** $50-200
**Daily profit:** $100-300
**Monthly profit:** $2,000-6,000
**Monthly return:** 20-30% (on $10K account)
---
### WHAT MAKES THIS WORK:
✅ Uses 7+ professional filters (not just 1 indicator)
✅ Checks volume (real moves only)
✅ Filters overbought/oversold (avoids tops/bottoms)
✅ Aligns with 4-hour trend (higher timeframe)
✅ Only trades peak volume hours (6:30-10 PM IST)
✅ Uses support/resistance (institutional levels)
✅ Risk/reward 2:1 minimum (math works out)
***
### KEY DISCIPLINE RULES:
**DO:**
- ✅ Only trade 6:30-10 PM IST
- ✅ Wait for candle to close
- ✅ Check ALL 5 table items
- ✅ Only take 70%+ strength signals
- ✅ Always use stop loss
- ✅ Always 2:1 reward ratio
- ✅ Risk 1-2% per trade
- ✅ Close all trades by 10 PM
- ✅ Journal every trade
- ✅ Follow the plan
**DON'T:**
- ❌ Trade outside 6:30-10 PM IST
- ❌ Enter before candle closes
- ❌ Take weak signals (below 70%)
- ❌ Trade without stop loss
- ❌ Move stop loss (lock in loss)
- ❌ Hold overnight
- ❌ Revenge trade after losses
- ❌ Overleverge (more than 0.1 lot start)
- ❌ Skip journaling
- ❌ Deviate from plan
***
### THE 5-STEP ENTRY PROCESS:
**Step 1:** Arrow appears on chart ➜
**Step 2:** Wait for candle to close ➜
**Step 3:** Check table (all 5 items) ➜
**Step 4:** If all good = go to prop firm ➜
**Step 5:** Enter trade with SL & TP
Takes 30 seconds once you practice!
***
### MONEY MATH (Starting with $5,000):
**If you take 20 signals per month:**
- Win 15, Lose 5 (75% rate)
- Wins: 15 × $100 = $1,500
- Losses: 5 × $50 = -$250
- Net: +$1,250/month = 25% return
**Month 2:** $5,000 + $1,250 = $6,250 account
**Month 3:** $6,250 + $1,562 = $7,812 account
**Month 4:** $7,812 + $1,953 = $9,765 account
**Month 5:** $9,765 + $2,441 = $12,206 account
**Month 6:** $12,206 + $3,051 = $15,257 account
**In 6 months = $10,000 account → $15,000+ (50% growth)**
That's COMPOUNDING, baby! 💰
***
### START TODAY:
1. Copy indicator code
2. Add to 1-hour US30 chart on TradingView
3. Wait until 6:30 PM IST tonight (or tomorrow if late)
4. Watch for signals
5. Follow the rules
6. Trade your prop firm
**That's it! Simple as that!**
***
### FINAL WORDS:
This isn't get-rich-quick. This is build-wealth-steadily.
You follow the plan, take quality signals only, manage risk properly, you WILL make money. Not every trade wins, but the winners are bigger than losers (2:1 ratio).
Most traders fail because they:
- Trade too much (overtrading)
- Don't follow their plan (emotions)
- Risk too much per trade (blown account)
- Chase signals (FOMO)
- Don't journal (repeat mistakes)
You avoid those 5 things = you'll be ahead of 95% of traders.
**Start trading 6:30 PM IST. Let's go! 🚀**

Uptrick: Volume Weighted BandsIntroduction
This indicator, Uptrick: Volume Weighted Bands, overlays dynamic, volume-informed trend channels directly on the chart. By fusing price and volume data through volume-weighted and exponential moving averages, the script forms a core trend line with adaptive bandwidth controlled by volatility. It is designed to help traders identify trend direction, breakout entries, and extended conditions that may warrant take-profits or pullback re-entries.
Overview
The Volume Weighted Bands system is built around a trend line calculated by averaging a Volume Weighted Moving Average (VWMA) and an Exponential Moving Average (EMA), both over a configurable lookback period. This hybrid trend baseline is then smoothed further and expanded into dynamic upper and lower bands using an Average True Range (ATR) multiplier. These bands adapt with market volatility and shift color based on prevailing price action, helping traders quickly identify bullish, bearish, or neutral conditions.
Originality and Unique Features
This script introduces originality by blending both price and volume in the core trend calculation, a technique that is more responsive than traditional moving average bands. Its multi-mode visualization (cloud, single-band, or line-only), combined with selective buy/sell signals, makes it flexible for discretionary and algorithmic strategies alike. Optional modules for take-profit signals based on z-score deviation and RSI slope, as well as buy-back detection logic with cooldown filters, offer practical tools for managing trades beyond simple entries.
Explanation of Inputs
Every user input in this script is included to give the trader control over behavior and visual presentation:
Trend Length (len): Defines the lookback window for both the VWMA and EMA, controlling the sensitivity of the core trend baseline. A lower value makes the bands more reactive, while a higher value smooths out short-term noise.
Extra Smoothing (smoothLen): Applies an additional EMA to the blended VWMA/EMA average. This second-level smoothing ensures the central trend line reacts gradually to shifts in price.
Band Width (ATR Multiplier) (bandMult): Multiplies the ATR to create the width of the upper and lower bands around the trend line. Larger values widen the bands, capturing more volatility, while smaller values narrow them.
ATR Length (atrLen): Sets the length of the ATR used in calculating band width and signal offsets. Longer values produce smoother band boundaries.
Show Buy/Sell Signals (showSignals): Toggles the primary crossover/crossunder entry signals, which are labeled when the close crosses the upper or lower band.
Visual Mode (visualMode): Allows selection between three display modes:
--> Cloud: Shows both bands and the central trend line with a shaded background.
--> Single Band: Displays only the active (upper or lower) band depending on trend state, with gradient fill to price.
--> Line Only: Shows only the trend line for a minimal visual profile.
Take Profit Signals (enableTP): Enables a z-score-based profit-taking signal system. Signals occur when price deviates significantly from the trend line and RSI confirms exhaustion.
TP Z-Score Threshold (tpThreshold): Sets the z-score deviation required to trigger a take-profit signal. Higher values reduce the frequency of signals, focusing on more extreme moves.
Re-Entries (enableBuyBack): Enables logic to signal when price reverts into the band after an initial breakout, suggesting a possible re-entry or pullback setup.
Buy Back Cooldown (bars) (buyBackCooldown): Defines a minimum bar count before a new buy-back signal is allowed, preventing rapid retriggering in choppy conditions.
Buy Offset and Sell Offset: Hidden inputs used to vertically adjust the placement of the Buy ("𝓤𝓹") and Sell ("𝓓𝓸𝔀𝓷") labels relative to the bands. These use ATR units to maintain proportionality across different instruments and timeframes.
Take-Profit Signal Module
The take-profit module uses a z-score of the distance between price and the trend line to detect extended conditions. In bullish trends, a signal appears when price is well above the band and RSI indicates exhaustion; the opposite applies for bearish conditions. A boolean flag is used to prevent retriggering until RSI resets. These signals are plotted with minimalist “X” markers near recent highs or lows, based on whether the market is extended upward or downward.
Re-Entry Logic
The re-entry system identifies instances where price momentarily dips or spikes into the opposite band but closes back inside, implying a continuation of the prevailing trend. This module can be particularly useful for traders managing entries after brief pullbacks. A built-in cooldown period helps filter out noise and prevents signal overloading during fast markets. Visual markers are shown as upward or downward arrows near the relevant candle wicks.
How to Use This Indicator
The basic usage of this indicator follows a directional, signal-driven approach. When a buy signal appears, it suggests entering a long position. The recommended stop loss placement is below the lower band, allowing for some breathing space to accommodate natural volatility. As the position progresses, take partial profits—typically 10% to 15% of the position—each time a take-profit signal (marked with an "X") is shown on the chart.
An optional feature is the buy-back signal, which can be used to re-enter after partial exits or missed entries. Utilizing this can help reduce losses during false breakouts or trend reversals by scaling in more gradually. However, it also means that in strong, clean trends, the full position may not be captured from the start, potentially reducing the total return. It is up to the trader to decide whether to enter fully on the initial signal or incrementally using buy-backs.
When a sell signal appears, the strategy advises fully exiting any long positions and immediately switching to a short position. The short trade follows the same logic: place your stop loss above the upper band with some margin, and again, take partial profits at each take-profit signal.
Visual Presentation and Signal Labels
All signals are plotted with clean, minimal labels that avoid clutter, and are color-coded using a custom palette designed to remain clear across light and dark chart themes. Bullish trends are marked in teal and bearish trends in magenta. Candles and wicks are also colored accordingly to align price action with the detected trend state. Buy and sell entries are marked with "𝓤𝓹" and "𝓓𝓸𝔀𝓷" labels.
Summary
In summary, the Uptrick: Volume Weighted Bands indicator provides a versatile, visually adaptive trend and volatility tool that can serve multiple styles of trading. Through its integration of price, volume, and volatility, along with modular take-profit and buy-back signaling, it aims to provide actionable structure across a range of market conditions.
Disclaimer
This indicator is for educational purposes only. Trading involves risk, and past performance does not guarantee future results. Always test strategies before applying them in live markets.

Cora Combined Suite v1 [JopAlgo]Cora Combined Suite v1 (CCSV1)
This is an 2 in 1 indicator (Overlay & Oscillator) the Cora Combined Suite v1 .
CCSV1 combines a price-pane Overlay for structure/trend with a compact Oscillator for timing/pressure. It’s designed to be clear, beginner-friendly, and largely automatic: you pick a profile (Scalp / Intraday / Swing), choose whether to run as Overlay or Oscillator, and CCSV1 tunes itself in the background.
What’s inside — at a glance
1) Overlay (price pane)
CoRa Wave: a smooth trend line based on a compound-ratio WMA (CRWMA).
Green when the slope rises (bull bias), Red when it falls (bear bias).
Asymmetric ATR Cloud around the CoRa Wave
Width expands more up when buyer pressure dominates and more down when seller pressure dominates.
Fill is intentionally light, so candlesticks remain readable.
Chop Guard (Range-Lock Gate)
When the cloud stays very narrow versus ATR (classic “dead water”), pullback alerts are muted to avoid noise.
Visuals don’t change—only the alerting logic goes quiet.
Typical Overlay reads
Trend: Follow the CoRa color; green favors long setups, red favors shorts.
Value: Pullbacks into/through the cloud in trend direction are higher-quality than chasing breaks far outside it.
Dominance: A visibly asymmetric cloud hints which side is funding the move (buyers vs sellers).
2) Oscillator (subpane or inline preview)
Stretch-Z (columns): how far price is from the CoRa mean (mean-reversion context), clipped to ±clip.
Near 0 = equilibrium; > +2 / < −2 = stretched/extended.
Slope-Z (line): z-score of CoRa’s slope (momentum of the trend line).
Crossing 0 upward = potential bullish impulse; downward = potential bearish impulse.
VPO (stepline): a normalized Volume-Pressure read (positive = buyers funding, negative = sellers).
Rendered as a clean stepline to emphasize state changes.
Event Bands ±2 (subpane): thin reference lines to spot extension/exhaustion zones fast.
Floor/Ceiling lines (optional): quiet boundaries so the panel doesn’t feel “bottomless.”
Inline vs Subpane
Inline (overlay): the oscillator auto-anchors and scales beneath price, so it never crushes the price scale.
Subpane (raw): move to a new pane for the classic ±clip view (with ±2 bands). Recommended for systematic use.
Why traders like it
Two in one: Structure on the chart, timing in the panel—built to complement each other.
Retail-first automation: Choose Scalp / Intraday / Swing and let CCSV1 auto-tune lengths, clips, and pressure windows.
Robust statistics: On fast, spiky markets/timeframes, it prefers outlier-resistant math automatically for steadier signals.
Optional HTF gate: You can require higher-timeframe agreement for oscillator alerts without changing visuals.
Quick start (simple playbook)
Run As
Overlay for structure: assess trend direction, where value is (the cloud), and whether chop guard is active.
Oscillator for timing: move to a subpane to see Stretch-Z, Slope-Z, VPO, and ±2 bands clearly.
Profile
Scalp (1–5m), Intraday (15–60m), or Swing (4H–1D). CCSV1 adjusts length/clip/pressure windows accordingly.
Overlay entries
Trade with CoRa color.
Prefer pullbacks into/through the cloud (trend direction).
If chop guard is active, wait; let the market “breathe” before engaging.
Oscillator timing
Look for Funded Flips: Slope-Z crossing 0 in the direction of VPO (i.e., momentum + funded pressure).
Use ±2 bands to manage risk: stretched conditions can stall or revert—better to scale or wait for a clean reset.
Optional HTF gate
Enable to green-light only those oscillator alerts that align with your chosen higher timeframe.
What each signal means (plain language)
CoRa turns green/red (Overlay): trend bias shift on your chart.
Cloud width tilts asymmetrically: one side (buyers/sellers) is dominating; extensions on that side are more likely.
Stretch-Z near 0: fair value around CoRa; pullback timing zone.
Stretch-Z > +2 / < −2: extended; watch for slowing momentum or scale decisions.
Slope-Z cross up/down: new impulse starting; combine with VPO sign to avoid unfunded crosses.
VPO positive/negative: net buying/selling pressure funding the move.
Alerts included
Overlay
Pullback Long OK
Pullback Short OK
Oscillator
Funded Flip Up / Funded Flip Down (Slope-Z crosses 0 with VPO agreement)
Pullback Long Ready / Pullback Short Ready (near equilibrium with aligned momentum and pressure)
Exhaustion Risk (Long/Short) (Stretch-Z beyond ±2 with weakening momentum or pressure)
Tip: Keep chart alerts concise and use strategy rules (TP/SL/filters) in your trade plan.
Best practices
One glance workflow
Read Overlay for direction + value.
Use Oscillator for trigger + confirmation.
Pairing
Combine with S/R or your preferred execution framework (e.g., your JopAlgo setups).
The suite is neutral: it won’t force trades; it highlights context and quality.
Markets
Works on crypto, indices, FX, and commodities.
Where real volume is available, VPO is strongest; on synthetic volume, treat VPO as a soft filter.
Timeframes
Use the Profile preset closest to your style; feel free to fine-tune later.
For multi-TF trading, enable the HTF gate on the oscillator alerts only.
Inputs you’ll actually use (the rest can stay on Auto)
Run As: Overlay or Oscillator.
Profile: Scalp / Intraday / Swing.
Oscillator Render: “Subpane (raw)” for a classic panel; “Inline (overlay)” only for a quick preview.
HTF gate (optional): require higher-timeframe Slope-Z agreement for oscillator alerts.
Everything else ships with sensible defaults and auto-logic.
Limitations & tips
Not a strategy: CCSV1 is a decision support tool; you still need your entry/exit rules and risk management.
Non-repainting design: Signals finalize on bar close; intrabar graphics can adjust during the bar (Pine standard).
Very flat sessions: If price and volume are extremely quiet, expect fewer alerts; that restraint is intentional.
Who is this for?
Beginners who want one clean overlay for structure and one simple oscillator for timing—without wrestling settings.
Intermediates seeking a coherent trend/pressure framework with HTF confirmation.
Advanced users who appreciate robust stats and clean engineering behind the visuals.
Disclaimer: Educational purposes only. Not financial advice. Trading involves risk. Use at your own discretion.

ProScalper📊 ProScalper - Professional 1-Minute Scalping System
🎯 Overview
ProScalper is a sophisticated, multi-confluence scalping indicator designed specifically for 1-minute chart trading. Combining advanced technical analysis with intelligent signal filtering, it provides high-probability trade setups with clear entry, stop loss, and take profit levels.
✨ Key Features
🔺 Smart Signal Detection
Range Filter Technology: Fast-responding trend detection (25-period) optimized for 1-minute timeframe
Medium-sized triangles appear above/below candles for clear buy/sell signals
Only most recent signal shown - no chart clutter
Automatically deletes old signals when new ones appear
📋 Real-Time Signal Table
Top-center display shows complete trade breakdown
Grade system: A+, A, B+, B, C+ ratings for every setup
All confluence reasons listed with checkmarks
Score and R:R displayed for instant trade quality assessment
Color-coded: Green for LONG, Red for SHORT
📐 Multi-Confluence Analysis
ProScalper combines 10+ technical factors:
✅ EMA Trend: 4 EMAs (200, 48, 13, 8) for multi-timeframe alignment
✅ VWAP: Dynamic support/resistance
✅ Fibonacci Retracement: Golden ratio (61.8%), 50%, 38.2%, 78.6%
✅ Range Filter: Adaptive trend confirmation
✅ Pivot Points: Smart reversal detection
✅ Volume Analysis: Spike detection and volume profile
✅ Higher Timeframe: 5-minute trend confirmation
✅ HTF Support/Resistance: Key levels from higher timeframes
✅ Liquidity Sweeps: Smart money detection
✅ Opening Range Breakout: First 15-minute range
💰 Complete Trade Management
Entry Lines: Dashed green (LONG) or red (SHORT) showing exact entry
Stop Loss: Red dashed line with price label
Take Profit: Blue dashed line with price label and R:R
Partial Exits: 1R level marked with orange dashed line
All lines extend 10 bars for clean alignment with Fibonacci levels
📊 Dynamic Risk/Reward
Adaptive R:R calculation based on market volatility
Targets adjusted for pivot distances
Minimum 1.2:1 to maximum 3.5:1 for scalping
Position sizing based on account risk percentage
🎨 Professional Visualization
Clean chart layout - no clutter, only essential information
Custom EMA colors: Red (200), Aqua (48), Green (13), White (8)
Gold VWAP line for key support/resistance
Color-coded Fibonacci: Bright yellow (61.8%), white (50%), orange (38.2%), fuchsia (78.6%)
No shaded zones - pure price action focus
📈 Performance Tracking
Real-time statistics table (optional)
Win rate, total trades, P&L tracking
Average R:R and win/loss ratios
Setup-specific performance metrics
⚙️ Settings & Customization
Risk Management
Adjustable account risk per trade (default: 0.5%)
ATR-based stop loss multiplier (default: 0.8 for tight scalping)
Dynamic position sizing
Signal Sensitivity
Confluence Score Threshold: 40-100 (default: 55 for balanced signals)
Range Filter Period: 25 bars (fast signals for 1-min)
Range Filter Multiplier: 2.2 (tighter bands for more signals)
Visual Controls
Toggle signal table on/off
Show/hide Fibonacci levels
Control EMA visibility
Adjust table text size
Partial Exits
1R: 50% (default)
2R: 30% (default)
3R: 20% (default)
Fully customizable percentages
Trailing Stops
ATR-Based (best for scalping)
Pivot-Based
EMA-Based
Breakeven trigger at 0.8R
🎯 Best Use Cases
Ideal For:
✅ 1-minute scalping on liquid instruments
✅ Day traders looking for quick 2-8 minute trades
✅ High-frequency trading with 8-15 signals per session
✅ Trending markets where Range Filter excels
✅ Crypto, Forex, Futures - works on all liquid assets
Trading Style:
Timeframe: 1-minute (can work on 3-5 min with adjusted settings)
Hold Time: 3-8 minutes average
Target: 1.2-3R per trade
Frequency: 8-15 signals per day
Win Rate: 45-55% (with proper risk management)
📋 How to Use
Step 1: Wait for Signal
Watch for green triangle (BUY) or red triangle (SELL)
Signal table appears at top center automatically
Step 2: Review Confluence
Check grade (prefer A+, A, B+ for best quality)
Review all reasons listed in table
Confirm score is above your threshold (55+ recommended)
Note the R:R ratio
Step 3: Enter Trade
Enter at current market price
Set stop loss at red dashed line
Set take profit at blue dashed line
Mark 1R level (orange line) for partial exit
Step 4: Manage Trade
Exit 50% at 1R (orange line)
Move to breakeven after 0.8R
Trail remaining position using your chosen method
Exit fully at TP or opposite signal
🎨 Chart Setup Recommendations
Optimal Display:
Timeframe: 1-minute
Chart Type: Candles or Heikin Ashi
Background: Dark theme for best color visibility
Volume: Enable volume bars below chart
Complementary Indicators (optional):
Order flow/Delta for institutional confirmation
Market profile for key levels
Economic calendar for news avoidance
⚠️ Important Notes
Risk Disclaimer:
Not financial advice - for educational purposes only
Always use proper risk management (0.5-1% per trade max)
Past performance doesn't guarantee future results
Test on demo account before live trading
Best Practices:
✅ Trade during high liquidity hours (9:30-11 AM, 2-4 PM EST)
✅ Avoid news events and market open/close (first/last 2 minutes)
✅ Use tight stops (0.8-1.0 ATR) for 1-minute scalping
✅ Take partial profits quickly (1R = 50% off)
✅ Respect max daily loss limits (3% recommended)
✅ Focus on A and B grade setups for consistency
What Makes This Different:
🎯 Complete system - not just signals, but full trade management
📊 Multi-confluence - 10+ factors analyzed per trade
🎨 Professional visualization - clean, focused chart design
⚡ Optimized for 1-min - settings specifically tuned for fast scalping
📋 Transparent reasoning - see exactly why each trade was taken
🏆 Grade system - instantly know trade quality
🔧 Technical Details
Pine Script Version: 5
Overlay: Yes (plots on price chart)
Max Lines: 500
Max Labels: 100
Non-repainting: All signals confirmed on bar close
Alerts: Compatible with TradingView alerts
📞 Support & Updates
This indicator is actively maintained and optimized for 1-minute scalping. Settings can be adjusted for different timeframes and trading styles, but default configuration is specifically tuned for high-frequency 1-minute scalping.
🚀 Get Started
Add ProScalper to your 1-minute chart
Adjust settings to your risk tolerance
Wait for signals (green/red triangles)
Follow the signal table guidance
Manage trades using provided levels
Track performance with stats table
Happy Scalping! 📊⚡💰

Forex Dynamic Lot Size CalculatorForex Dynamic Lot Size Calculator for Forex. Works on USD Base and USD Quote pairs. Provides real-time data based on stop-loss location. Allows you to know in real-time how the number of lots you need to purchase to match your risk %.
Number of Lots is calculated based on total risk. Total risk is calculated based on Stop-Loss + Commission + Spread Fees + Slippage measured in pips. Also includes data such as break-even pips, net take profit, margin required, buying power used, and a few others. All are real-time and anchored to the current price.
The intention of creating this indicator is to help with risk management. You know exactly how many lots you need to get this very moment to have your total risk at lets say $250, which includes commission fees, spread fees, and slippage.
To put it simply, if I was to enter the trade right now and willing to risk exactly $250, how many lots will I need to get right this second?
---
- To use adjust Account Settings along with other variables.
- Stop Loss Mode can be Manual or Dynamic. If you select Dynamic, then you will have to adjust Stop Loss Level to where you can see the reference line on the screen. It is at 1.1 by default. Just enter current price and the line will appear. Adjust it by dragging it to where you want your stop loss to be.
- Take Profit Mode can also be Manual or Dynamic. I just keep my TP at Manual and use Quick Access to set Quick RR levels.
- Adjust Spreads and Slippage to your liking. I tried to have TV calculate current spread, but it seem like it doesn't have access to real-life data for me like MT5 does. I just use average instead. Both are optional, depending on your broker and type of account you use.
- Pip Value for the current pair, Return on Margin, and Break-even line can be turned on and off, based on your needs. I just get the Break-even value in pips from the pannel and use that as reference where I need to relocate my stop loss to break-ever (commission + spreds + slippage).
- Panel is fully customizable based on your liking. Important fields are highlighted along with reference lines.

XAUUSD 5m — CET 13:00→01:00 Supertrend + RSI (1:2 RR) — $240KThis strategy is designed for XAUUSD (Gold) on the 5-minute chart, optimized for trading during the most active hours (13:00–01:00 CET).
It combines a Supertrend direction filter with RSI crossovers for precise entries, and applies a 1:2 risk–reward ratio for consistent risk management.
🧠 Logic Overview:
Buy Signal: RSI crosses above 55 while Supertrend is bullish
Sell Signal: RSI crosses below 45 while Supertrend is bearish
Trading Hours: 13:00 → 01:00 CET (corresponding to 07:00 → 19:00 New York time)
Risk Management: Fixed 1:2 RR (TP = 2× SL distance from Supertrend line)
Session Management: Automatically closes all trades after 01:00 CET
Order Size: $240,000 notional exposure per position
💡 Best used for:
Scalping or intraday trading on XAUUSD during high-volatility hours.
The setup works best when combined with strong price action or volume confirmation.
⚠️ Disclaimer:
This script is for educational and testing purposes only.
Past performance does not guarantee future results.
Always test on demo before using live funds.

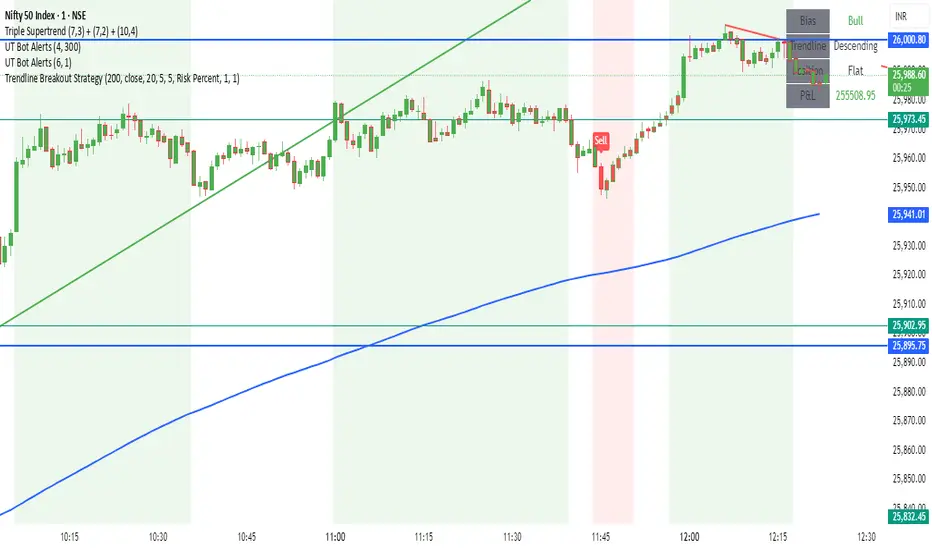
Trendline Breakout Strategy Strategy should place entries & exits so that it can be backtested (use strategy.entry and strategy.exit with explicit stop and limit prices). Include an option for fixed percent position sizing and an option for fixed contract size. Draw the trendline on the chart (with option to hide/show) and add labels that show: bias (Bull/Bear), trendline slope, entry price, SL, TP and the reason (e.g., "Trendline Breakout"). Provide user inputs for: EMA length (default 200), lookback for pivot detection, pivot sensitivity (left/right bars), quantity mode (percent / contracts), risk percent or fixed size, enable/disable backtest prints, and enable alerts. Avoid repainting: use confirmed pivot logic (pivot detection must use completed bars) and only take entry after breakout confirmed on close. Document any limitations (for example, trendline using two highest/highest bars inside lookback is approximate). Add clear comments, helpful variable names, and include example alertcondition lines for entry and exit signals.
Zero Lag Trend Signals (MTF) [Quant Trading] V7Overview
The Zero Lag Trend Signals (MTF) V7 is a comprehensive trend-following strategy that combines Zero Lag Exponential Moving Average (ZLEMA) with volatility-based bands to identify high-probability trade entries and exits. This strategy is designed to reduce lag inherent in traditional moving averages while incorporating dynamic risk management through ATR-based stops and multiple exit mechanisms.
This is a longer term horizon strategy that takes limited trades. It is not a high frequency trading and therefore will also have limited data and not > 100 trades.
How It Works
Core Signal Generation:
The strategy uses a Zero Lag EMA (ZLEMA) calculated by applying an EMA to price data that has been adjusted for lag:
Calculate lag period: floor((length - 1) / 2)
Apply lag correction: src + (src - src )
Calculate ZLEMA: EMA of lag-corrected price
Volatility bands are created using the highest ATR over a lookback period multiplied by a band multiplier. These bands are added to and subtracted from the ZLEMA line to create upper and lower boundaries.
Trend Detection:
The strategy maintains a trend variable that switches between bullish (1) and bearish (-1):
Long Signal: Triggers when price crosses above ZLEMA + volatility band
Short Signal: Triggers when price crosses below ZLEMA - volatility band
Optional ZLEMA Trend Confirmation:
When enabled, this filter requires ZLEMA to show directional momentum before entry:
Bullish Confirmation: ZLEMA must increase for 4 consecutive bars
Bearish Confirmation: ZLEMA must decrease for 4 consecutive bars
This additional filter helps avoid false signals in choppy or ranging markets.
Risk Management Features:
The strategy includes multiple stop-loss and take-profit mechanisms:
Volatility-Based Stops: Default stop-loss is placed at ZLEMA ± volatility band
ATR-Based Stops: Dynamic stop-loss calculated as entry price ± (ATR × multiplier)
ATR Trailing Stop: Ratcheting stop-loss that follows price but never moves against position
Risk-Reward Profit Target: Take-profit level set as a multiple of stop distance
Break-Even Stop: Moves stop to entry price after reaching specified R:R ratio
Trend-Based Exit: Closes position when price crosses EMA in opposite direction
Performance Tracking:
The strategy includes optional features for monitoring and analyzing trades:
Floating Statistics Table: Displays key metrics including win rate, GOA (Gain on Account), net P&L, and max drawdown
Trade Log Labels: Shows entry/exit prices, P&L, bars held, and exit reason for each closed trade
CSV Export Fields: Outputs trade data for external analysis
Default Strategy Settings
Commission & Slippage:
Commission: 0.1% per trade
Slippage: 3 ticks
Initial Capital: $1,000
Position Size: 100% of equity per trade
Main Calculation Parameters:
Length: 70 (range: 70-7000) - Controls ZLEMA calculation period
Band Multiplier: 1.2 - Adjusts width of volatility bands
Entry Conditions (All Disabled by Default):
Use ZLEMA Trend Confirmation: OFF - Requires ZLEMA directional momentum
Re-Enter on Long Trend: OFF - Allows multiple entries during sustained trends
Short Trades:
Allow Short Trades: OFF - Strategy is long-only by default
Performance Settings (All Disabled by Default):
Use Profit Target: OFF
Profit Target Risk-Reward Ratio: 2.0 (when enabled)
Dynamic TP/SL (All Disabled by Default):
Use ATR-Based Stop-Loss & Take-Profit: OFF
ATR Length: 14
Stop-Loss ATR Multiplier: 1.5
Profit Target ATR Multiplier: 2.5
Use ATR Trailing Stop: OFF
Trailing Stop ATR Multiplier: 1.5
Use Break-Even Stop-Loss: OFF
Move SL to Break-Even After RR: 1.5
Use Trend-Based Take Profit: OFF
EMA Exit Length: 9
Trade Data Display (All Disabled by Default):
Show Floating Stats Table: OFF
Show Trade Log Labels: OFF
Enable CSV Export: OFF
Trade Label Vertical Offset: 0.5
Backtesting Date Range:
Start Date: January 1, 2018
End Date: December 31, 2069
Important Usage Notes
Default Configuration: The strategy operates in its most basic form with default settings - using only ZLEMA crossovers with volatility bands and volatility-based stop-losses. All advanced features must be manually enabled.
Stop-Loss Priority: If multiple stop-loss methods are enabled simultaneously, the strategy will use whichever condition is hit first. ATR-based stops override volatility-based stops when enabled.
Long-Only by Default: Short trading is disabled by default. Enable "Allow Short Trades" to trade both directions.
Performance Monitoring: Enable the floating stats table and trade log labels to visualize strategy performance during backtesting.
Exit Mechanisms: The strategy can exit trades through multiple methods: stop-loss hit, take-profit reached, trend reversal, or trailing stop activation. The trade log identifies which exit method was used.
Re-Entry Logic: When "Re-Enter on Long Trend" is enabled with ZLEMA trend confirmation, the strategy can take multiple long positions during extended uptrends as long as all entry conditions remain valid.
Capital Efficiency: Default setting uses 100% of equity per trade. Adjust "default_qty_value" to manage position sizing based on risk tolerance.
Realistic Backtesting: Strategy includes commission (0.1%) and slippage (3 ticks) to provide realistic performance expectations. These values should be adjusted based on your broker and market conditions.
Recommended Use Cases
Trending Markets: Best suited for markets with clear directional moves where trend-following strategies excel
Medium to Long-Term Trading: The default length of 70 makes this strategy more appropriate for swing trading rather than scalping
Risk-Conscious Traders: Multiple stop-loss options allow traders to customize risk management to their comfort level
Backtesting & Optimization: Comprehensive performance tracking features make this strategy ideal for testing different parameter combinations
Limitations & Considerations
Like all trend-following strategies, performance may suffer in choppy or ranging markets
Default 100% position sizing means full capital exposure per trade - consider reducing for conservative risk management
Higher length values (70+) reduce signal frequency but may improve signal quality
Multiple simultaneous risk management features may create conflicting exit signals
Past performance shown in backtests does not guarantee future results
Customization Tips
For more aggressive trading:
Reduce length parameter (minimum 70)
Decrease band multiplier for tighter bands
Enable short trades
Use lower profit target R:R ratios
For more conservative trading:
Increase length parameter
Enable ZLEMA trend confirmation
Use wider ATR stop-loss multipliers
Enable break-even stop-loss
Reduce position size from 100% default
For optimal choppy market performance:
Enable ZLEMA trend confirmation
Increase band multiplier
Use tighter profit targets
Avoid re-entry on trend continuation
Visual Elements
The strategy plots several elements on the chart:
ZLEMA line (color-coded by trend direction)
Upper and lower volatility bands
Long entry markers (green triangles)
Short entry markers (red triangles, when enabled)
Stop-loss levels (when positions are open)
Take-profit levels (when enabled and positions are open)
Trailing stop lines (when enabled and positions are open)
Optional ZLEMA trend markers (triangles at highs/lows)
Optional trade log labels showing complete trade information
Exit Reason Codes (for CSV Export)
When CSV export is enabled, exit reasons are coded as:
0 = Manual/Other
1 = Trailing Stop-Loss
2 = Profit Target
3 = ATR Stop-Loss
4 = Trend Change
Conclusion
Zero Lag Trend Signals V7 provides a robust framework for trend-following with extensive customization options. The strategy balances simplicity in its core logic with sophisticated risk management features, making it suitable for both beginner and advanced traders. By reducing moving average lag while incorporating volatility-based signals, it aims to capture trends earlier while managing risk through multiple configurable exit mechanisms.
The modular design allows traders to start with basic trend-following and progressively add complexity through ZLEMA confirmation, multiple stop-loss methods, and advanced exit strategies. Comprehensive performance tracking and export capabilities make this strategy an excellent tool for systematic testing and optimization.
Note: This strategy is provided for educational and backtesting purposes. All trading involves risk. Past performance does not guarantee future results. Always test thoroughly with paper trading before risking real capital, and adjust position sizing and risk parameters according to your risk tolerance and account size.
================================================================================
TAGS:
================================================================================
trend following, ZLEMA, zero lag, volatility bands, ATR stops, risk management, swing trading, momentum, trend confirmation, backtesting
================================================================================
CATEGORY:
================================================================================
Strategies
================================================================================
CHART SETUP RECOMMENDATIONS:
================================================================================
For optimal visualization when publishing:
Use a clean chart with no other indicators overlaid
Select a timeframe that shows multiple trade signals (4H or Daily recommended)
Choose a trending asset (crypto, forex major pairs, or trending stocks work well)
Show at least 6-12 months of data to demonstrate strategy across different market conditions
Enable the floating stats table to display key performance metrics
Ensure all indicator lines (ZLEMA, bands, stops) are clearly visible
Use the default chart type (candlesticks) - avoid Heikin Ashi, Renko, etc.
Make sure symbol information and timeframe are clearly visible
================================================================================
COMPLIANCE NOTES:
================================================================================
✅ Open-source publication with complete code visibility
✅ English-only title and description
✅ Detailed explanation of methodology and calculations
✅ Realistic commission (0.1%) and slippage (3 ticks) included
✅ All default parameters clearly documented
✅ Performance limitations and risks disclosed
✅ No unrealistic claims about performance
✅ No guaranteed results promised
✅ Appropriate for public library (original trend-following implementation with ZLEMA)
✅ Educational disclaimers included
✅ All features explained in detail
================================================================================

NOVA Breakout Signals v2.2 (TF M30)A clean, rules-based breakout signal tool for 30-minute charts.
It detects Dow swing breakouts and filters them with RSI, MACD and Volume so you only see the higher-quality entries. The script does not place trades and does not calculate SL/TP – it only prints clear LONG/SHORT labels at the entry price.
⸻
How it works
1. Timeframe enforcement – Signals are generated only on M30. On other timeframes the script shows a notice and stays silent.
2. Breakout engine (Dow swings) – The last confirmed swing high/low (pivots) is tracked.
• Breakout Up: bar closes above the last swing high by a small buffer.
• Breakout Down: bar closes below the last swing low by a small buffer.
3. Quality filters (all must be true):
• RSI (default length 30):
• Long: RSI > threshold and rising.
• Short: RSI < threshold and falling.
• MACD (12/26/9):
• Long: histogram > 0 and line > signal.
• Short: histogram < 0 and line < signal.
• Volume: current volume > SMA(volume, 20) × multiplier.
4. Debounce / anti-spam
• Cooldown of 4 hours (8 M30 bars) after any signal.
• Minimum price distance from the previous signal to avoid clustered labels.
Signals appear once the bar closes (barstate.isconfirmed). No swing lines are drawn to keep the chart clean; only entry labels are shown.
⸻
Inputs (key)
• RSI length & thresholds for Long/Short confirmation.
• MACD uses 12/26/9 (fixed).
• Volume multiplier (relative to SMA 20).
• Breakout buffer %, Cooldown hours, Min distance %.
• Show labels (on/off).
⸻
Usage tips
• Start with gold/major FX/indices on M30; use “Once per bar close” if you attach alerts.
• Increase the breakout buffer and volume multiplier in choppy markets.
• Tighten RSI thresholds (e.g., 55/45) if you want fewer but stronger signals.
⸻
Notes & limitations
• Pivots confirm after a few bars by definition; signals themselves are printed only on confirmed bar close and do not repaint once shown.
• This is a signal indicator, not investment advice. Always manage risk.

KD-10-20 Cross No Chop ChopThis strategy avoids 80% of the choppy trades. Take entry when it gives a buy signal and put TP and SL as per your convenience. Happy Trading!

Liquidity Sniper V3 (ANTI-FAKEOUT)An advanced institutional trading indicator combining liquidity pool targeting, smart money concepts, and momentum-based entries with comprehensive risk management.
🎯 CORE FEATURES:
- Liquidity Sniper Module: Identifies and targets major liquidity pools (PDH/PDL, PWH/PWL, Equal Highs/Lows, HVN/LVN edges)
- Anti-Fakeout Stack: 10-layer confirmation system including VWAP reclaim, micro BOS, displacement, relative volume, and mitigation entries
- Momentum Engulf Add-On: Catches high-velocity impulsive moves with engulfing candles, volume spikes, and volatility breakouts
- GARCH Volatility Filter: Dynamic volatility analysis to avoid choppy conditions
- Multi-Timeframe Confirmation: Ensures alignment across timeframes before entries
📊 SIGNAL CLASSIFICATION:
- BEST (Green): Highest probability setups with all confirmations aligned - 6.0+ score
- BETTER (Medium Green): Strong setups with most confirmations - 4.5-6.0 score
- GOOD (Light Green): Valid setups with basic confirmations - 3.0-4.5 score
🔍 TRADE SCENARIOS:
S1: Liquidity Reversal - Sweeps + reversals at key levels with displacement
S2: Continuation - Trend following with VWAP mean reversion
S3: Mean Reversion - Extreme deviations (2σ+) with Fibonacci exhaustion
S4: Deep Sweep - 3σ sweeps at major liquidity with high confluence
⚡ MOMENTUM TRIGGERS:
- MET (Momentum Engulf): Bullish/bearish engulfing with 1.5x+ volume spike and ATR impulse
- VBT (Volatility Breakout): Range breakouts with sigma bursts and participation
🛡️ RISK MANAGEMENT:
- Dynamic TP/SL based on ATR, VWAP bands, and liquidity pools
- 3-tier targets (T1: VWAP, T2: Nearest pool, T3: 5R extension)
- Early invalidation tracking (0.5R movement monitoring)
- Minimum 2:1 RR requirement with cooldown periods
- RTH session filters and anti-spam protection
📈 TECHNICAL EDGE:
- SMT Divergence detection vs ES correlation
- CVD (Cumulative Volume Delta) divergence confirmation
- FVG (Fair Value Gap) and Order Block mitigation entries
- Equal highs/lows clustering analysis
- Volume profile HVN/LVN identification
⚙️ FULLY CUSTOMIZABLE:
All parameters adjustable including cooldowns, proximity thresholds, ATR multipliers, RR floors, and scenario weights.
Perfect for: ES/NQ futures, forex majors, and liquid stocks. Works on 1-15 min timeframes. Best results during NY session (9:35-11:00 AM & 1:30-3:30 PM ET).
Created for serious traders seeking institutional-grade edge with quantifiable risk/reward and high-probability setups

DAMMU AUTOMATICAL AI ENRTY AND TARGET AND EXITMain Components
Supertrend System –
Detects market trend direction (Buy/Sell zones).
→ Green = Uptrend (Buy)
→ Red = Downtrend (Sell)
SMA Filter –
Uses 50 & 200 moving averages to confirm overall trend.
→ Price above both → Bullish
→ Price below both → Bearish
Buy/Sell Signals –
Generated when Supertrend flips direction and SMA confirms.
→ Triangle up = Buy
→ Triangle down = Sell
Take Profit / Stop Loss Levels –
Automatically calculated after Buy/Sell entry.
→ TP1, TP2, SL shown on chart
ADX (Sideways Zone Filter) –
If ADX < 25 → Market sideways → Avoid trades
Shows “No Trade Zone” area
Smart Money Concepts (SMC) Tools –
🔹 Market structure (HH, HL, LH, LL)
🔹 Order blocks (OB)
🔹 Equal highs/lows
🔹 Fair Value Gaps (FVG)
🔹 Premium & Discount zones
Helps find institutional entry points
Visual Display –
Color-coded background (trend zones)
Labels for buy/sell/structure
Optional FVG and order block boxes
Risk Management –
Input-based position sizing, SL & TP management
(to calculate profit levels and minimize loss)
