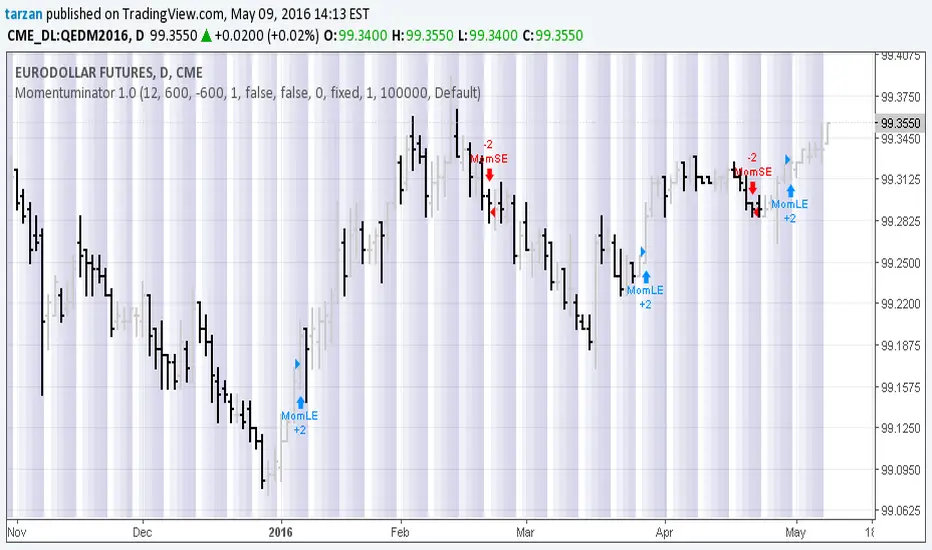
Momentuminator 1.0Here we have a general purpose momentum based long and short flip flop with optional profit target and maximum loss.
Program development: Boffin Hollow Lab
Author: Tarzan at tradingview.com
Release: Version 1.0 May 2016
Please Note: Past Performance is not necessarily indicative of future results
Search in scripts for "tradingview+筹码结构"
SNIPER ORB# 🎯 SNIPER ORB TRADING CHEAT SHEET
## Quick Reference Guide for Live Trading
---
## 📊 VISUAL IDENTIFICATION GUIDE
```
═══════════════════════════════════════════════════════════════════
YOUR CHART AT A GLANCE
═══════════════════════════════════════════════════════════════════
🔵 BRIGHT BLUE BOX (5min) → Fastest ORB, early warning signals
🔷 CYAN BOX (15min) → Mid-term institutional reference
🟣 PURPLE BOX (30min) → PRIMARY TRADING RANGE (your base)
🟢 GREEN DASHED LINES → Upside profit targets (long)
🔴 RED DASHED LINES → Downside profit targets (short)
🟡 GOLD LINE (VWAP) → Institutional fair value anchor
═══════════════════════════════════════════════════════════════════
```
---
## ⏰ SESSION TIMING MATRIX
| Session | Start Time | ORB Complete | Breakout Window | End Time |
|---------|-----------|--------------|-----------------|----------|
| **London Open** | 3:00 AM ET | 3:30 AM ET | 3:30-5:00 AM | 9:30 AM ET |
| **New York Open** | 9:30 AM ET | 10:00 AM ET | 10:00-11:30 AM | 5:00 PM ET |
**💡 GOLDEN RULE**: Wait for 30min ORB to **complete** before taking breakout trades!
---
## 🎯 THE 5 HIGH-PROBABILITY SETUPS
### **SETUP #1: CLEAN BREAKOUT** ⭐⭐⭐⭐⭐
```
CONDITIONS:
✅ 30min ORB complete (10:00 AM for NY / 3:30 AM for London)
✅ Price breaks ABOVE purple high (bullish) or BELOW purple low (bearish)
✅ VWAP confirms direction:
• Long: VWAP below price
• Short: VWAP above price
✅ Volume spike on breakout candle
ENTRY: Breakout candle close
STOP: Inside 30min ORB (opposite side)
TARGET 1: First green/red target (0.5x range)
TARGET 2: Second target (1x range)
TARGET 3: Third target (1.5x range)
WIN RATE: 65-75% | R:R = 1:2 minimum
```
---
### **SETUP #2: FALSE BREAKOUT REVERSAL** ⭐⭐⭐⭐⭐
```
CONDITIONS:
✅ Price breaks purple high/low initially
✅ Fails to hold (wick reversal or immediate rejection)
✅ Re-enters 30min ORB zone
✅ VWAP acts as rejection point
✅ Breaks opposite side of 30min ORB
ENTRY: When price breaks opposite ORB boundary
STOP: Original false breakout high/low
TARGET 1: VWAP (quick scalp)
TARGET 2: First opposite target line
WIN RATE: 70-80% | R:R = 1:3+ (trapped traders exit)
NOTES: Most profitable setup - institutions hunting stops
```
---
### **SETUP #3: TRIPLE ORB COMPRESSION** ⭐⭐⭐⭐
```
CONDITIONS:
✅ All 3 ORBs tightly aligned (5min, 15min, 30min overlap)
✅ Range < 0.5% of price (very tight)
✅ VWAP sitting in middle of compression
✅ Multiple candles consolidating inside
ENTRY: Simultaneous break of ALL 3 ORBs
STOP: Middle of compression zone
TARGET: 2x-3x normal targets (explosive move)
WIN RATE: 60-70% | R:R = 1:4+ (volatility expansion)
NOTES: Low volume → high volume shift = institutional play
```
---
### **SETUP #4: VWAP RETEST CONTINUATION** ⭐⭐⭐⭐
```
CONDITIONS:
✅ 30min ORB already broken (trend established)
✅ Price pulls back to VWAP
✅ VWAP acts as dynamic support/resistance
✅ Rejection candle forms at VWAP
ENTRY: Candle closes back in trend direction from VWAP
STOP: 10-15 points beyond VWAP
TARGET: Next target line (1x, 1.5x, 2x)
WIN RATE: 70-75% | R:R = 1:2
NOTES: Safest continuation entry, institutions defending VWAP
```
---
### **SETUP #5: OPENING RANGE FADE** ⭐⭐⭐
```
CONDITIONS:
✅ Price stuck inside 30min ORB for 1+ hours post-formation
✅ Multiple failed attempts to break high or low
✅ VWAP in dead center (neutral)
✅ Decreasing volume
ENTRY: Sell at purple high, buy at purple low (range bound)
STOP: Outside ORB by 20 points
TARGET: Opposite ORB boundary + VWAP
WIN RATE: 55-65% | R:R = 1:1.5
NOTES: Use on slow/choppy days only, exit if breakout starts
```
---
## 🛡️ RISK MANAGEMENT RULES
### **Position Sizing Matrix**
```
Account Size: $50,000 example
Risk Per Trade: 1-2% max
ORB Range | Stop Distance | Position Size (1% risk) | YM Contracts
-------------|---------------|-------------------------|-------------
50 points | 50 points | $500 risk | 1 contract
100 points | 100 points | $500 risk | 1 contract
150 points | 150 points | $500 risk | 1 contract
200 points | 200 points | $500 risk | 1 contract
Formula: Risk $ ÷ (Stop Distance × $5 per point) = Contracts
```
### **The 3-Strike Rule**
```
✅ Strike 1: Full position size
❌ Stop hit → Strike 2: Half position size
❌ Stop hit → Strike 3: 1/4 position size
❌ Stop hit → DONE for the session
```
### **Profit Taking Strategy**
```
TARGET 1 (0.5x): Take 50% off, move stop to breakeven
TARGET 2 (1x): Take 30% off, trail stop 20 points
TARGET 3 (1.5x): Take 15% off, let 5% run to 2x-3x
```
---
## ⚠️ DO NOT TRADE IF...
```
🚫 30min ORB incomplete (wait until 10:00 AM NY / 3:30 AM London)
🚫 ORB range < 30 points YM (too tight, likely fake breakout)
🚫 ORB range > 300 points YM (too wide, unpredictable)
🚫 Major news release within 30 minutes
🚫 You've hit 3 losses in the session (walk away)
🚫 Price whipsawing violently (wait for structure)
🚫 You're tired, emotional, or distracted
```
---
## 🔍 PRE-MARKET CHECKLIST
**Every Morning Before Trading:**
```
□ Check economic calendar (avoid high-impact news)
□ Identify previous day's high/low (macro context)
□ Note overnight price action (gap up/down?)
□ Load SNIPER ORB on 1min or 5min chart
□ Select active session (London or New York)
□ Set TradingView alerts for ORB breakouts
□ Prepare stop/target orders in advance
□ Review yesterday's ORB ranges (context)
```
---
## 🎨 INDICATOR SETTINGS QUICK REFERENCE
### **Default Configuration (Recommended)**
```
Session: New York
Number of Targets: 3
Target % Increment: 50% (gives 0.5x, 1x, 1.5x)
Show VWAP: ON
VWAP Line Width: 2
ORB Line Width: 2
Target Line Width: 1
```
### **Aggressive Day Trading Setup**
```
Session: New York
Number of Targets: 5
Target % Increment: 30% (tighter targets)
Show VWAP: ON
```
### **Conservative Swing Setup**
```
Session: New York
Number of Targets: 2
Target % Increment: 75% (wider targets)
Show VWAP: ON
```
---
## 📈 OPTIMAL TIMEFRAME BY STYLE
| Trading Style | Recommended TF | Why? |
|--------------|----------------|------|
| **Scalper** | 1-minute | See every tick, 5-15 min holds |
| **Day Trader** | 5-minute | Balanced view, 30-90 min holds |
| **Swing Trader** | 15-minute | Less noise, 2-4 hour holds |
**💡 PRO TIP**: Use 5min chart for entries, but watch 1min for precise timing!
---
## 🧠 PATTERN RECOGNITION QUICK GUIDE
### **Bullish ORB Patterns**
```
1. "Staircase" → Price respects each target as new support
2. "Rocket Launch" → Clean break through all targets no pullback
3. "VWAP Bounce" → Pullback to VWAP, then continuation higher
4. "Triple Compression" → All ORBs converge then explosive breakout
```
### **Bearish ORB Patterns**
```
1. "Waterfall" → Price cascades through all downside targets
2. "Failed High" → Breaks top, immediately reverses to bottom
3. "VWAP Rejection" → Hits VWAP from above, hard rejection down
4. "Slow Bleed" → Gradual drift lower, respecting each target
```
### **Neutral/Chop Patterns**
```
1. "Ping Pong" → Price bouncing between ORB high/low repeatedly
2. "Flat VWAP" → VWAP horizontal, price hugging it (no trade)
3. "Wide Range" → ORB > 300 points, too much uncertainty
4. "Gap Confusion" → Opens far outside all ORBs, wait for reset
```
---
## 📊 CONFLUENCE SCORING SYSTEM
**Rate Each Trade 1-10 Before Entry:**
```
Breakout confirmed (30min ORB): +2 points
VWAP alignment: +2 points
Volume spike on breakout: +1 point
All 3 ORBs align: +1 point
Clean candle close beyond ORB: +1 point
Your YM SNIPER GOD MODE signal: +2 points
Time: 10:00-11:30 AM ET window: +1 point
SCORING:
9-10 points = SNIPER SETUP (maximum size)
7-8 points = GOOD TRADE (standard size)
5-6 points = MARGINAL (half size or skip)
< 5 points = NO TRADE (wait for better)
```
---
## 🎯 INTEGRATION WITH YM ULTIMATE SNIPER v8.1
**The Perfect Confluence:**
```
STEP 1: SNIPER ORB identifies the STRUCTURE
→ 30min ORB defines "Zones That Matter"
→ VWAP shows institutional bias
→ Targets define profit zones
STEP 2: YM ULTIMATE SNIPER triggers the ENTRY
→ Wait for GOD MODE signal at ORB boundary
→ 6-gate system confirms institutional pressure
→ Score ≥9.0, fat body ≥70%, delta dominance ≥70%
STEP 3: Execute with PRECISION
→ ORB break + GOD MODE = highest probability
→ Enter only when BOTH systems align
→ This is TRUE "sniper" trading
```
---
## 💡 COMMON MISTAKES TO AVOID
```
❌ Entering BEFORE 30min ORB completes
✅ Wait until 10:00 AM (NY) or 3:30 AM (London)
❌ Ignoring VWAP position
✅ Always check: is VWAP confirming your directional bias?
❌ Chasing breakouts after 50+ point move
✅ Wait for pullback to VWAP or first target
❌ Trading during lunch (12-1 PM ET)
✅ Volume dies, false signals increase
❌ Using same target % in all conditions
✅ Adjust: 30-40% in chop, 50-75% in trends
❌ Forgetting to move stop to breakeven at Target 1
✅ NEVER give back a winning trade
❌ Overtrading on slow days
✅ Some days only have 1-2 clean setups, that's okay!
❌ Not respecting the 3-strike rule
✅ 3 losses = done, come back tomorrow
```
---
## 📱 MOBILE TRADING SETUP
**TradingView Mobile App:**
```
1. Save SNIPER ORB as "Default Layout"
2. Enable push notifications for alerts
3. Set bracket orders (stop + targets) in advance
4. Keep phone charged during trading hours
5. Have broker app ready for quick execution
```
---
## 🔔 ALERT CONFIGURATION
**Essential Alerts to Set:**
```
1. "30min ORB Complete"
→ Time-based: 10:00 AM ET (NY) / 3:30 AM ET (London)
2. "ORB Breakout Up"
→ Built-in: Price > 30min ORB high
3. "ORB Breakout Down"
→ Built-in: Price < 30min ORB low
4. "VWAP Touch"
→ Custom: Price crosses VWAP line
5. "Target 1 Hit"
→ Price level: First green/red target line
```
---
## 🎓 DAILY REVIEW TEMPLATE
**After Each Trading Session:**
```
Date: __________ Session: London / New York
Total Setups Identified: ____
Trades Taken: ____
Win Rate: ____%
P&L: $______
Best Trade:
- Setup type: _________________
- Entry: ______ Exit: ______
- What went right: _________________
Worst Trade:
- Setup type: _________________
- Entry: ______ Exit: ______
- What went wrong: _________________
Tomorrow's Adjustments:
□ _________________________________
□ _________________________________
□ _________________________________
```
---
## 🚀 QUICK START: YOUR FIRST TRADE
**5-Minute Walkthrough:**
```
1. ADD TO CHART (9:25 AM ET)
→ Load SNIPER ORB indicator
→ Select "New York" session
→ Set targets: 3 levels, 50%
2. WAIT (9:30-10:00 AM)
→ Watch 30min ORB form (purple box)
→ Note VWAP position
→ Identify if price trending or ranging
3. PREPARE (10:00 AM)
→ 30min ORB complete!
→ Measure range (info table shows points)
→ Set alerts for breakout
4. EXECUTE (10:00-11:30 AM)
→ Breakout signal fires
→ Check VWAP alignment
→ Check YM SNIPER confluence
→ Enter trade if 7+ confluence points
5. MANAGE
→ Target 1: Take 50%, move stop to BE
→ Target 2: Take 30%, trail stop
→ Target 3: Let remainder run
6. REPEAT
→ Maximum 3 trades per session
→ Stop after 3 losses
```
---
## 🏆 WINNING TRADER MINDSET
```
"I don't need to trade every ORB breakout.
I only need the HIGH-PROBABILITY setups.
3-5 trades per day is enough.
90%+ win rate on those 3-5 trades = success.
Patience + Precision = Profitability"
```
---
## 📞 TROUBLESHOOTING
**Indicator Not Showing?**
- Check max_boxes/max_lines limits in code
- Verify you're on 1min-30min timeframe
- Ensure TradingView session is 9:30-17:00 ET
**ORBs Look Wrong?**
- Verify timezone: should be "America/New_York"
- Check if market has DST adjustment today
- Confirm broker chart time matches indicator
**VWAP Disappeared?**
- Toggle "Show Anchored VWAP" in settings
- Check if session ended (auto-disappears at 5 PM)
- Verify you're not in pre-market hours
**Targets Too Close/Far?**
- Adjust "Target % Increment" setting
- 30% = tighter, 75% = wider
- Default 50% works for most conditions
---
## 🎯 FINAL CHECKLIST BEFORE GOING LIVE
```
□ Backtested on replay mode for 2+ weeks
□ Understand all 5 setup types
□ Risk management rules memorized
□ YM Ultimate SNIPER v8.1 loaded on same chart
□ TradingView alerts configured
□ Stop/target calculator ready
□ Trading journal template prepared
□ Emotional state: calm and focused
□ Sufficient account size (minimum $10k recommended)
□ Broker platform tested and ready
IF ALL CHECKED → YOU'RE READY TO SNIPE! 🎯
```
---
## 📚 ADVANCED RESOURCES
**Combine SNIPER ORB with:**
- Cumulative Volume Delta (CVD) for confirmation
- Footprint charts for order flow at ORB boundaries
- Market profile for volume-at-price context
- Options flow for institutional positioning
- Economic calendar for high-volatility avoidance
**Study Material:**
- Mark Fisher "The Logical Trader" (ORB bible)
- SMB Capital YouTube (institutional ORB strategies)
- Your own YM Ultimate SNIPER documentation
- Price action at previous session ORBs (historical analysis)
---
**💎 REMEMBER: Quality over quantity. Sniper precision over shotgun spray.**
**🎯 Good luck, and happy sniping! 🎯**
═══════════════════════════════════════════════════════════════════
END OF SNIPER ORB TRADING CHEAT SHEET
═══════════════════════════════════════════════════════════════════

Mark Minervini SEPA - Balanced
📊 MARK MINERVINI SEPA BALANCED - COMPLETE USER GUIDE
🚀 WHAT IS THIS INDICATOR?
This is a professional swing trading indicator based on Mark Minervini's famous
Trend Template strategy. It automatically identifies high-probability setups where:
✅ Long-term trend is BULLISH (confirmed by moving averages)
✅ Stock is OUTPERFORMING the market (relative strength improving)
✅ Price is CONSOLIDATING (forming a base for breakout)
✅ Volume is CONFIRMING (volume spike on breakout)
Result: CLEAR BUY SIGNALS when everything aligns! 🎯
🎨 WHAT YOU SEE ON YOUR CHART
1️⃣ FOUR MOVING AVERAGE LINES:
🟠 Orange Line (MA 20) = Short-term trend
🔵 Blue Line (MA 50) = Intermediate trend
🟢 Green Line (MA 150) = Long-term trend
🔴 Red Line (MA 200) = Very long-term trend
IDEAL: All lines stacked in order (Orange > Blue > Green > Red)
2️⃣ BACKGROUND COLOR:
🟢 GREEN background = Trend template is VALID (bullish setup ready)
🔴 RED background = Trend template is BROKEN (avoid trading)
3️⃣ DASHBOARD PANEL (Top-Right):
Real-time checklist showing:
✓ 6 core trend template rules
✓ Relative strength status
✓ VCP base quality
✓ Stage classification (S1/S2/S3/S4)
✓ Volume breakout status
4️⃣ VCP BASE BOXES (Blue Rectangles):
Shows where consolidation is happening
This is your potential entry zone
5️⃣ BUY SIGNAL LABEL (Green Text Below Candle):
Green "BUY" label appears when ALL criteria are met
This is your strongest entry signal
6️⃣ STOP LOSS LINE (Red Dashed Line):
Shows your stop loss level (base low)
📖 HOW TO USE - STEP BY STEP
STEP 1: ADD INDICATOR TO CHART
────────────────────────────────
1. Open TradingView chart
2. Click "Indicators" (top toolbar)
3. Search "Minervini SEPA Balanced"
4. Click to add to your chart
5. Use DAILY (1D) timeframe for swing trading
STEP 2: CHECK THE DASHBOARD (Top-Right Panel)
1. Look at all the checkmarks
2. Count how many are GREEN (✓)
3. Check Stage column - is it showing S2 or S1?
STEP 3: LOOK FOR SETUP PATTERNS
─────────────────────────────────
Ideal setup shows:
✓ Dashboard: 10+ criteria are GREEN
✓ Stage: S2 (green) or S1 (orange)
✓ Blue VCP box visible on chart (base forming)
✓ Moving averages aligned (50 > 150 > 200)
✓ Price above all moving averages
✓ Background is GREEN
STEP 4: WAIT FOR ENTRY SIGNAL
──────────────────────────────
Option A: BUY SIGNAL label appears
→ Green "BUY" label = ALL criteria met
→ ENTER at market price immediately
Option B: Setup looks good but no BUY label yet
→ Wait for price to break above blue VCP box
→ Volume should spike (1.3x or higher)
→ Then enter at breakout
STEP 5: PLACE YOUR TRADE
────────────────────────
📍 ENTRY: At breakout from VCP base
📍 STOP LOSS: Base low (red dashed line)
📍 TARGET: 20-30% move (typical Minervini target)
📍 HOLDING TIME: 2-4 weeks
🎯 BALANCED VERSION - WHY IT'S BETTER FOR INDIAN STOCKS
Volume Multiplier: 1.3x (NOT 1.5x)
→ Original was too strict for Indian market
→ 1.3x is realistic and catches good breakouts
→ Results: 5-10 signals per stock per year (tradeable!)
Trend Template: Core 6 rules (NOT all 8)
→ Focuses on the most important rules
→ Still maintains quality, but more flexible
→ Works better with Indian stock behavior
Stage Allowed: S1 OR S2 (NOT just S2)
→ Catches earlier moves
→ Allows you to enter sooner
→ But maintains quality with other criteria
📊 DASHBOARD INDICATORS - WHAT EACH MEANS
TREND SECTION (Core 6 Rules):
─────────────────────────────
P>200 ✓ = Price above 200-day MA (long-term uptrend)
150>200 ✓ = MA150 above MA200 (MA alignment)
200↑ ✓ = MA200 trending up (uptrend accelerating)
50>150 ✓ = MA50 above MA150 (intermediate uptrend)
50>200 ✓ = MA50 above MA200 (overall alignment)
P>50 ✓ = Price above MA50 (pullback level intact)
RS STRENGTH SECTION:
───────────────────
RS↑ ✓ = Stock outperforming NIFTY index
✗ = Stock underperforming NIFTY (avoid)
VCP BASE SECTION:
────────────────
In Base ✓ = Consolidation zone detected
✗ = No consolidation yet
Vol Dry ✓ = Volume drying up (base tightening)
✗ = Normal volume (consolidation weak)
ENTRY SECTION:
──────────────
Stage S2 = GREEN (best for swing trading)
S1 = ORANGE (acceptable, early entry)
S3 = RED (avoid - distribution phase)
S4 = RED (avoid - downtrend)
Vol Brk ✓ = Volume confirmed breakout (1.3x+ average)
✗ = Weak volume (breakout likely to fail)
❌ WHEN NOT TO TRADE
SKIP if ANY of these are true:
❌ Background is RED (trend template broken)
❌ Stage is S3 or S4 (distribution or downtrend)
❌ Vol Brk is RED (volume not confirming)
❌ RS↑ is ORANGE/RED (stock underperforming market)
❌ Blue box is NOT visible (no base forming)
❌ Base is very loose/messy (not tight enough)
❌ Moving averages are not aligned
❌ Less than 8 GREEN criteria on dashboard
⚙️ CUSTOMIZATION GUIDE
Click ⚙️ gear icon next to indicator name to adjust settings:
VOLUME MULTIPLIER (Default: 1.3)
────────────────────────────────
Current: 1.3x = BALANCED for Indian stocks ✅
Change to 1.2x = MORE signals (more false breakouts)
Change to 1.4x = FEWER signals (very selective)
Change to 1.5x = ORIGINAL (too strict, rarely triggers)
RS BENCHMARK (Default: NSE:NIFTY)
─────────────────────────────────
Current: NSE:NIFTY = Large-cap stocks
Change to NSE:NIFTY500 = Mid-cap stocks
Change to NSE:NIFTYNXT50 = Small-cap stocks
MINIMUM BASE DAYS (Default: 20)
───────────────────────────────
Current: 20 days = 4 weeks consolidation ✅
Change to 15 = Shorter bases (more frequent signals)
Change to 25 = Longer bases (higher quality)
ATR% FOR TIGHTNESS (Default: 1.5)
──────────────────────────────────
Current: 1.5% = BALANCED ✅
Change to 1.0% = ONLY very tight bases
Change to 2.0% = Loose bases accepted
📈 REAL TRADING EXAMPLE
SCENARIO: Trading RELIANCE over 4 weeks
WEEK 1: Base Starts Forming
────────────────────────────
- Price consolidating around ₹1,500
- Dashboard: 5/14 criteria green
- Action: MONITOR (not ready yet)
WEEK 2: Base Tightens
─────────────────────
- Price still ₹1,500 (no movement)
- VCP box appearing on chart
- Dashboard: 8/14 criteria green
- Vol Dry: ✓ (volume shrinking - good!)
- Action: MONITOR (almost ready)
WEEK 3: Perfect Setup Formed
──────────────────────────────
- Base still ₹1,500
- Dashboard: 12/14 criteria GREEN ✓✓✓
- Stage: S2 ✓
- Blue box tight and clean
- Action: WAIT FOR BREAKOUT
WEEK 4: Breakout Happens!
──────────────────────────
- Price closes at ₹1,550 (breakout!)
- Volume: 1.6x average (exceeds 1.3x requirement)
- Dashboard: BUY SIGNAL ✓ (all criteria met)
- Action: ENTER TRADE
Entry: ₹1,550
Stop: ₹1,480 (base low)
Target: ₹1,850 (20% move)
RESULT: +19.4% profit in 2 weeks! ✅
💡 PRO TIPS FOR BEST RESULTS
1. USE DAILY (1D) CHARTS ONLY
Weekly charts = Fewer signals, slower moves
Daily charts = Best for swing trading ✅
Intraday charts = Too many false signals
2. SCAN MULTIPLE STOCKS
Don't just watch 1 stock
Scan 50-100 stocks daily
More stocks = More opportunities
3. WAIT FOR PERFECT ALIGNMENT
Don't enter on 8/14 criteria
Wait for 12+/14 criteria
This increases win rate significantly
4. VOLUME IS CRITICAL
Always check Vol Brk column
No volume = Likely to fail
1.3x+ volume = Good breakout
5. COMBINE WITH YOUR OWN ANALYSIS
Indicator gives technical signals
You add your own fundamental view
Strong fundamental + technical = Best trade
6. BACKTEST ON HISTORICAL DATA
Use TradingView Replay feature
Go back 6-12 months
See how many signals appeared
Verify which were profitable
7. KEEP A TRADING JOURNAL
Track entry, exit, profit/loss
Note what worked and what didn't
Continuous improvement!
⚠️ IMPORTANT DISCLAIMERS
✓ This indicator is for educational purposes only
✓ Past performance does not guarantee future results
✓ Always use proper risk management (position sizing, stop loss)
✓ Never risk more than 2% of your account on one trade
✓ Backtest thoroughly before using with real money
✓ The indicator provides technical signals, not investment advice
✓ Losses can occur - trade at your own risk
🎯 QUICK START CHECKLIST
Before entering ANY trade, verify:
□ Dashboard shows mostly GREEN (10+ criteria)
□ Stage = S2 (green) or S1 (orange)
□ Blue VCP box visible on chart
□ Price just broke above the box
□ Volume is high (1.3x+ average, Vol Brk = ✓)
□ Moving averages aligned (50 > 150 > 200)
□ RS is uptrending (RS↑ = ✓)
□ BUY SIGNAL label appeared (optional but strong confirmation)
ALL CHECKED? → READY TO BUY! 🚀
📞 FOR HELP & SUPPORT
Questions about the indicator?
→ Check the dashboard - each criterion has a specific meaning
→ Review this guide - answers most common questions
→ Backtest on historical data using TradingView Replay
→ Start with paper trading (no real money) first
🎓 LEARNING RESOURCES
To understand Mark Minervini's method better:
→ Read: "Trade Like a Stock Market Wizard" by Mark Minervini
→ Watch: TradingView educational videos on trend templates
→ Practice: Backtest this indicator on 6-12 months of historical data
→ Learn: Study successful traders who use similar strategies
GOOD LUCK WITH YOUR TRADING! 🚀📈
May your trends be bullish and your breakouts be explosive! 🎯

P&F Label Overlay🧙 The Wizard's Challenge: P&F Label Overlay on Your Chart
This is a custom Pine Script indicator designed to overlay the classic Point & Figure (P&F) pattern directly onto your standard candlestick or bar chart. While Pine Script offers built-in, dedicated P&F charts, this indicator was created as a challenging and experimental project to satisfy the goal of visualizing the P&F X's and O's directly on the price bars.
❶. How to Use This Code on TradingView
1. Copy the Code: Copy the entire Pine Script code provided above.
2. Open Pine Editor: On TradingView, click the "Pine Editor" tab at the bottom of your chart.
3. Replace Content: Delete any existing code in the editor and paste this P&F script.
4. Add to Chart: Click the "Add to Chart" button (usually located near the top right of the Pine Editor).
5. Access Settings: The indicator, named "P&F Label Overlay: The Wizard's Challenge," will appear on your chart. You can click the gear icon ( ) next to its name on the chart to adjust the inputs.
❷. 🎛️ Key Settings & Customization (Inputs)
The indicator provides core P&F settings that you can customize to fit your analysis style:
✅ Enable Auto Box Size (Default: True): When enabled, the box size is automatically calculated as a percentage of the current price, making it dynamic.
・Auto Box Size Basis (%): Sets the percentage used to calculate the dynamic box size. (e.g., 2% of the price).
・Fixed Box Size (Price Units): When "Enable Auto Box Size" is disabled, this value is used as the static box size (e.g., a value of 5.0 for a $5 box).
・Reversal Count (Default: 3): This is the crucial P&F parameter (the Reversal Factor). It determines how many boxes the price must move in the opposite direction to trigger a column reversal (e.g., 3 means price must reverse by 3 \times \text{BOX\_SIZE}).
Calculation Source: Allows you to choose the price data used for calculations (e.g., close, hl2 (High/Low/2), etc.).
❸. 🎯 The Challenge: Why an Overlay?
This indicator represents an experimental and challenging endeavor made in collaboration with an AI. It stems from the strong desire to visualize P&F patterns overlaid on a conventional chart, which is not a native function in Pine Script's standard indicator plotting system.
・Leveraging Drawing Objects: The core of this challenge relies on cleverly using Pine Script's label.new() drawing objects to represent the "X" and "O" symbols. This is a highly non-standard way to draw a P&F chart, as it requires complex logic to manage the drawing coordinates, price levels, and column spacing on the time-based chart.
・The Current Status: We've successfully achieved the initial goal: visualizing the X and O patterns as an overlay. Achieving a perfectly aligned, full-featured P&F chart (where columns align precisely, and price rounding is fully consistent across all columns) is far more complex, but this code provides a strong foundation.
❹. 🛠️ Technical Highlights
Tick-Precision Rounding: The custom function f_roundToTick() is critical. It ensures that the calculated box size and the lastPrice are always rounded to the nearest minimum tick size (syminfo.mintick) of the asset. This maintains high precision and accuracy relative to the market's price movements.
・Column Indexing: The currentColumnIndex variable is used to simulate the horizontal movement of P&F columns by adding a fractional offset to the bar_index when drawing the labels. This is what makes the pattern appear as distinct columns.
・Garbage Collection: The activeLabels array and the MAX_LABELS limit ensure that old labels are deleted (label.delete()) as new ones are drawn. This is a crucial performance optimization to prevent TradingView's label limit (500) from being exceeded and to maintain a smooth experience.
❺. 🚀 A Platform for Deep Customization
While TradingView's built-in indicators are excellent, every trader has their "personal best settings." View this code as a starting point for your own analytical environment. You can use it as a base to pursue deeper custom features, such as:
・Different drawing styles or colors based on momentum.
・Automated detection and signaling of specific P&F patterns (e.g., Double Top Buy, Triple Bottom Sell).
Please feel free to try it on your chart! We welcome any feedback you might have as we continue to refine this experimental overlay.
I do not speak English at all. Please understand that if you send me a message, I may not be able to reply, or my reply may have a different meaning. Thank you for your understanding.

able MACD Overview
Purpose: The indicator combines the traditional MACD (Moving Average Convergence Divergence) with a short-term “forecast” (projection) of MACD/histogram values to give early warning of momentum changes.
Typical outputs:
MACD line (fastEMA − slowEMA)
Signal line (EMA of MACD)
Histogram (MACD − signal)
Forecasted MACD or histogram projected N bars ahead
Optional buy/sell markers and alert conditions
Add the indicator to TradingView (Installation)
Open TradingView and the chart you want to apply the indicator to.
Click “Pine Editor” at the bottom of the chart.
Copy the contents of able_macd_forecast.pine into the Pine Editor window.
Click “Add to chart” (or Save then Add to chart). If it’s a study, it will appear on the chart below price.
If you plan to re-use the script, click Save and give it a meaningful name.
Inputs / Parameters (typical) Note: exact input names may differ in your script. Replace the names below with the script’s input labels when you inspect it.
Source: price source for calculations (close, hl2, etc.).
Fast Length: length for the fast EMA (commonly 12).
Slow Length: length for the slow EMA (commonly 26).
Signal Length: length for the MACD signal EMA (commonly 9).
Forecast Length / Horizon: how many bars ahead the script projects the MACD/histogram (e.g., 1–5).
Forecast Method / Smoothing: choice of projection method (linear regression, EMA extrapolation, simple slope * N, etc.) if available.
Histogram Thresholds: numeric thresholds to emphasize significant momentum (optional).
Show Forecast: toggle on/off the forecast plot.
Alerts On/Off toggles: enable or disable alert conditions baked into the indicator.
Visual / Style settings: colors, plot thickness, histogram style (columns/areas), show labels, show buy/sell arrows.
How the indicator is typically calculated (summary)
MACD line = EMA(source, fast) − EMA(source, slow)
Signal line = EMA(MACD line, signal length)
Histogram = MACD − Signal
Forecast = method-specific short-term projection of MACD or histogram (for example: extend the last slope forward, apply linear regression to MACD values and extrapolate N bars, or apply an additional smoothing and extend that value) Note: For exact math, I need to inspect the script; this is the typical approach.
How to read the indicator (signals & interpretation)
Bullish signal:
MACD line crossing above the signal line (MACD cross up).
Histogram turns positive (cross above zero).
Forecast shows MACD/histogram moving higher in the next N bars (if forecast is positive or trending up).
Bearish signal:
MACD line crossing below the signal line (MACD cross down).
Histogram turns negative (cross below zero).
Forecast shows MACD/histogram moving lower ahead.
Confirmations:
Use price action (higher highs/lows for bullish, lower highs/lows for bearish).
Volume or other momentum/confluence indicators (RSI, ADX).
Divergences:
Bullish divergence: price makes lower low while MACD histogram makes higher low.
Bearish divergence: price makes higher high while MACD histogram makes lower high.
Forecast behavior:
If the forecast leads the MACD cross (forecast crosses before the current MACD does), it’s an early warning.
Use caution: forecasts are prone to false signals; always confirm.
Common trading setups using this indicator
Conservative:
Wait for MACD to cross signal + histogram above zero + forecast already trending same direction.
Use stop below recent swing low (for long) or above recent swing high (for short).
Aggressive (early entry):
Enter when forecast turns positive while MACD still below signal (anticipating cross).
Use tighter stops and smaller position sizes.
Exit rules:
Opposite MACD cross, histogram flipping sign, or a target based on risk-reward.
Use trailing stop based on ATR or structure.
Example settings for different timeframes (starting points)
Scalping / 5–15 min:
Fast 8, Slow 21, Signal 5, Forecast 1–2
Intraday / 1H:
Fast 12, Slow 26, Signal 9, Forecast 2–3
Swing / 4H–Daily:
Fast 12, Slow 26, Signal 9, Forecast 3–5 Adjust based on the asset volatility and backtests.
Adding alerts (TradingView)
Click the “Alerts” button (clock icon) or press Alt + A.
In the Condition dropdown, select the indicator name (able_macd_forecast) and choose a plotted series or built-in alert condition (if the script uses alertcondition).
Common alert types:
MACD crosses Signal (Crossing)
Histogram crosses 0 (Crossing)
Forecast crosses 0 or Forecast trend change (if provided)
Message templates:
“{{ticker}}: MACD crossed above signal on {{interval}}”
“{{ticker}} Forecast positive: MACD forecast shows upward momentum”
Customize the message for your trade automation or notifications.
Configure frequency (Only once, Once per bar, or Once per bar close) — for signals like crossovers, “Once per bar close” is usually safer to avoid repainting issues. Note: If the script includes alertcondition() calls with explicit IDs/messages, use those directly — they are the most reliable for automation.
Backtesting / Strategy conversion
If this script is a study (indicator), you can:
Convert it to a strategy by adding strategy.* order calls (strategy.entry, strategy.close) using the entry/exit logic you prefer, or
Use TradingView’s “Bar Replay” to manually test signals across different markets/timeframes.
If you want, I can help convert or write a strategy wrapper that uses the indicator’s signals to place backtest trades (I’ll need the code).
Practical tips & best practices
Use higher timeframe confirmation for lower-timeframe entries (e.g., check daily MACD momentum before trading 15m signals).
Beware of choppy markets; MACD / forecast may produce whipsaws. Combine with trend filters (moving average direction, ADX).
If you rely on forecasted values, prefer alerts “on bar close” when possible to reduce false alerts from intra-bar noise.
Tune parameters for the specific asset (FX, crypto, stocks have different behavior).
Record each signal and outcome for a sample period (20–100 trades) to evaluate performance.
Troubleshooting
Indicator won’t add: verify Pine version in script header (//@version=4 or //@version=5). TradingView may reject scripts with unsupported version syntax.
Plots missing: check script inputs (Some scripts hide plots if toggles are off).
Alerts firing too often: change alert frequency to “Once per bar close” or adjust threshold values.
Forecast seems to repaint: some forecast methods can repaint (use “bar_index” or store values only on closed bars, or use non-repainting forecast methods). Ask me to inspect the script for repainting logic.
What I can do next (recommended)
If you paste the content of able_macd_forecast.pine here, I will:
Produce a precise, line-by-line usage guide mapping to the exact input names and default values.
Show the exact plotted series names and how to reference them for alerts.
Point out any repainting risks and suggest fixes.
Provide example alert messages that match the script’s alertcondition IDs (if any).
Optionally convert it into a strategy for backtesting, or add non-repainting forecast logic if needed.

CVD [able0.1]# CVD Overlay iOS Style - Complete User Guide
## 📖 Table of Contents
1. (#what-is-cvd)
2. (#installation-guide)
3. (#understanding-the-display)
4. (#reading-the-info-table)
5. (#settings--customization)
6. (#trading-strategies)
7. (#common-mistakes-to-avoid)
---
## 🎯 What is CVD?
**CVD (Cumulative Volume Delta)** tracks the **difference between buying and selling pressure** over time.
### Simple Explanation:
- **Positive CVD** (Orange) = More buying than selling = Bulls winning
- **Negative CVD** (Gray) = More selling than buying = Bears winning
- **Rising CVD** = Increasing buying pressure = Potential uptrend
- **Falling CVD** = Increasing selling pressure = Potential downtrend
### Why It Matters:
CVD helps you see **who's really in control** of the market - not just price movement, but actual buying/selling volume.
---
## 🚀 Installation Guide
### Step 1: Open Pine Editor
1. Go to TradingView
2. Click the **"Pine Editor"** tab at the bottom of the screen
3. Click **"New"** or open an existing script
### Step 2: Copy & Paste the Code
1. Select all existing code (Ctrl+A / Cmd+A)
2. Delete it
3. Copy the entire CVD iOS Style code
4. Paste it into Pine Editor
### Step 3: Add to Chart
1. Click **"Save"** button (or Ctrl+S / Cmd+S)
2. Click **"Add to Chart"** button
3. The indicator will appear on your chart!
### Step 4: Initial Setup
- The indicator appears as an **overlay** on your price chart
- You'll see an **orange/gray line** following price
- An **info table** appears in the top-right corner
---
## 📊 Understanding the Display
### Main Chart Elements:
#### 1. **CVD Line** (Orange/Gray)
- **Orange Line** = Positive CVD (buying pressure)
- **Gray Line** = Negative CVD (selling pressure)
- This line moves with your price chart but shows volume delta
#### 2. **CVD Zone** (Shaded Area)
- Light shaded box around the CVD line
- Shows the "range" of CVD movement
- Helps visualize CVD boundaries
#### 3. **Center Line** (Dotted)
- Gray dotted line in the middle of the zone
- Represents the "neutral" point
- CVD crossing this = shift in market control
#### 4. **Reference Asset Line** (Light Gray)
- Shows Bitcoin (BTC) price movement for comparison
- Helps you see if your asset moves with or against BTC
- Can be changed to any asset you want
#### 5. **CVD Label**
- Shows current CVD value
- Positioned above/below zone to avoid overlap
- Updates in real-time
#### 6. **Reset Background** (Very Light Gray)
- Appears when CVD resets
- Indicates a new calculation period
---
## 📋 Reading the Info Table
The info table (top-right) shows **8 key metrics**:
### Row 1: **Header**
```
╔═ CVD able ═╗ | 15m | ████████ | able
```
- **CVD able** = Indicator name + creator
- **15m** = Current timeframe
- **████████** = Visual decoration
- **able** = Creator signature
### Row 2: **CVD Value**
```
CVD▲ | 7.39K | ████████ | █
█
█
```
- **CVD▲** = CVD with trend arrow
- ▲ = CVD increasing
- ▼ = CVD decreasing
- ► = CVD unchanged
- **7.39K** = Actual CVD number
- **Progress Bar** = Visual strength (darker = stronger)
- **Vertical Bars** = Height shows intensity
### Row 3: **Delta**
```
◆DELTA | -1.274K | ████░░░░ | ░
░
```
- **Delta** = Volume change THIS BAR ONLY
- **Negative** = More selling this bar
- **Positive** = More buying this bar
- Shows **immediate** pressure (not cumulative)
### Row 4: **UP Volume**
```
UP↑ | -1.263K | ████████ | █
█
█
```
- Total **buying volume** this bar
- Higher = Stronger buying pressure
- Green/Orange vertical bars = Bullish strength
### Row 5: **DOWN Volume**
```
DN↓ | 2.643K | ████████ | ░
░
░
```
- Total **selling volume** this bar
- Higher = Stronger selling pressure
- Gray vertical bars = Bearish strength
### Row 6-7: **Reference Asset** (if enabled)
```
══ REF ══ | ══════ | ████████ | █
█
PRICE▲ | 4130.300 | ████████ | █
█
```
- **REF** = Reference asset header
- **PRICE▲** = Reference price with trend
- Shows if BTC (or chosen asset) is rising/falling
- Compare with your chart to see correlation
### Row 8: **Market Status**
```
◄STATUS► | NEUT | ████░░░░ | ▒
▒
```
- **BULL** = CVD positive + Delta positive = Strong buying
- **BEAR** = CVD negative + Delta negative = Strong selling
- **NEUT** = Mixed signals = Wait for clarity
**Status Colors:**
- **Orange background** = Bullish (good for long)
- **Gray background** = Bearish (good for short)
- **White background** = Neutral (no clear signal)
---
## ⚙️ Settings & Customization
### Main Settings (⚙️)
#### **CVD Reset**
- **None** = CVD never resets (from beginning of data)
- **On Higher Timeframe** = Resets when HTF candle closes
- 15m chart → Resets hourly
- 1h chart → Resets daily
- Recommended for most traders
- **On Session Start** = Resets at market open
- **On Visible Chart** = Resets from leftmost visible bar
#### **Precision**
- **Low (Fast)** = Uses 1m data, faster but less accurate
- **Medium** = Uses 5m data, balanced (recommended)
- **High** = Uses 15m data, most accurate but slower
#### **Cumulative**
- ✅ On = CVD accumulates over time (recommended)
- ❌ Off = Shows only current bar delta
#### **Show Labels**
- ✅ On = Shows CVD value label on chart
- ❌ Off = Cleaner chart, no label
#### **Show Info Table**
- ✅ On = Shows info table (recommended for beginners)
- ❌ Off = Hide table for minimalist view
---
### 🎨 iOS Style Colors
You can customize **every color** to match your chart theme:
#### **Primary Colors**
- **Primary (Orange)** = Main bullish color (#FF9500)
- **Secondary (Gray)** = Main bearish color (#8E8E93)
- **Background** = Table background (#FFFFFF)
- **Text** = Text color (#1C1C1E)
#### **Bullish/Bearish**
- **Bullish (Orange)** = Positive CVD color
- **Bearish (Gray)** = Negative CVD color
- **Opacity** = Zone transparency (0-100%)
- **Show Zone** = Enable/disable shaded area
#### **Table Colors** (📋)
- **Header Background** = Top row background
- **Header Text** = Top row text color
- **Cell Background** = Data cells background
- **Cell Text** = Data cells text color
- **Border** = Table border color
- **Accent Background** = Special rows background
- **Alert Background** = Warning/status background
---
### 📊 Reference Asset Settings
#### **Enable**
- ✅ On = Shows reference asset line
- ❌ Off = Hide reference asset
#### **Symbol**
- Default: `BINANCE:BTCUSDT`
- Can change to any asset:
- `BINANCE:ETHUSDT` (Ethereum)
- `SPX` (S&P 500)
- `DXY` (US Dollar Index)
- Any ticker symbol
#### **Color & Width**
- Customize line appearance
- Width: 1-4 (thickness)
---
## 💡 Trading Strategies
### Strategy 1: CVD Divergence (Beginner-Friendly)
**What to Look For:**
- Price making **higher highs** but CVD making **lower highs** = Bearish divergence
- Price making **lower lows** but CVD making **higher lows** = Bullish divergence
**How to Trade:**
1. Wait for divergence to form
2. Look for confirmation (price reversal, candlestick pattern)
3. Enter trade in divergence direction
4. Stop loss beyond recent high/low
**Example:**
```
Price: /\ /\ /\ (higher highs)
CVD: /\ / \/ (lower highs) = Bearish signal
```
### Strategy 2: CVD Trend Following (Intermediate)
**What to Look For:**
- **Strongly rising CVD** + **rising price** = Strong uptrend
- **Strongly falling CVD** + **falling price** = Strong downtrend
**How to Trade:**
1. Wait for CVD and price moving in same direction
2. Enter on pullbacks to support/resistance
3. Stay in trade while CVD trend continues
4. Exit when CVD trend breaks
**Signals:**
- CVD ▲▲▲ + Price ↑ = Go LONG
- CVD ▼▼▼ + Price ↓ = Go SHORT
### Strategy 3: CVD + Reference Asset (Advanced)
**What to Look For:**
- Your asset **rising** but BTC (reference) **falling** = Relative strength
- Your asset **falling** but BTC (reference) **rising** = Relative weakness
**How to Trade:**
1. Compare CVD movement with BTC
2. If your CVD rises faster than BTC = Buy signal
3. If your CVD falls faster than BTC = Sell signal
4. Use for **pair trading** or **asset selection**
### Strategy 4: Volume Delta Confirmation
**What to Look For:**
- **Large positive Delta** = Strong buying this bar
- **Large negative Delta** = Strong selling this bar
**How to Trade:**
1. Price breaks resistance + Large positive Delta = Confirmed breakout
2. Price breaks support + Large negative Delta = Confirmed breakdown
3. Use Delta to **confirm** price moves, not predict them
**Rules:**
- Delta > 2x average = Very strong pressure
- Delta near zero at key level = Weak move, likely false breakout
---
## 🎓 Reading Real Scenarios
### Scenario 1: Strong Buying Pressure
```
Table Shows:
CVD▲ | 12.5K | ████████ | ████ (CVD rising)
◆DELTA | +2.8K | ████████ | ▲ (Positive delta)
UP↑ | 3.1K | ████████ | ████ (High buy volume)
DN↓ | 0.3K | ██░░░░░░ | ░ (Low sell volume)
◄STATUS► | BULL | ████████ | ████ (Orange background)
```
**Interpretation:** Strong buying, good for LONG trades
### Scenario 2: Distribution (Hidden Selling)
```
Table Shows:
CVD► | 8.2K | ████░░░░ | ▒▒ (CVD flat)
◆DELTA | -1.5K | ████████ | ▼ (Negative delta)
UP↑ | 0.8K | ███░░░░░ | ░ (Low buy volume)
DN↓ | 2.3K | ████████ | ████ (High sell volume)
◄STATUS► | BEAR | ████████ | ░░░░ (Gray background)
```
**Interpretation:** Price may look stable, but selling increasing = Prepare for drop
### Scenario 3: Neutral/Choppy Market
```
Table Shows:
CVD► | 5.1K | ████░░░░ | ▒ (CVD sideways)
◆DELTA | +0.2K | ██░░░░░░ | ─ (Small delta)
UP↑ | 1.2K | ████░░░░ | ▒ (Medium buy)
DN↓ | 1.0K | ████░░░░ | ▒ (Medium sell)
◄STATUS► | NEUT | ████░░░░ | ▒▒ (White background)
```
**Interpretation:** No clear direction = Stay out or reduce position size
---
## ⚠️ Common Mistakes to Avoid
### Mistake 1: Trading on CVD Alone
- ❌ **Wrong:** "CVD is rising, I'll buy immediately"
- ✅ **Right:** "CVD is rising, let me check price structure, support/resistance, and wait for confirmation"
### Mistake 2: Ignoring Delta
- ❌ **Wrong:** Looking only at cumulative CVD
- ✅ **Right:** Watch both CVD (trend) and Delta (momentum)
- Delta shows **immediate** pressure changes
### Mistake 3: Wrong Timeframe
- ❌ **Wrong:** Using 1m chart with High Precision (too slow)
- ✅ **Right:** Match precision to timeframe:
- 1m-5m → Low Precision
- 15m-1h → Medium Precision
- 4h+ → High Precision
### Mistake 4: Not Using Reset
- ❌ **Wrong:** Using "None" reset for intraday trading
- ✅ **Right:** Use "On Higher Timeframe" to see fresh CVD each session
### Mistake 5: Overtrading Neutral Status
- ❌ **Wrong:** Forcing trades when STATUS = NEUT
- ✅ **Right:** Only trade clear BULL or BEAR status
### Mistake 6: Ignoring Reference Asset
- ❌ **Wrong:** Trading altcoin without checking BTC
- ✅ **Right:** Always check if BTC CVD agrees with your asset
---
## 🔥 Pro Tips
### Tip 1: Multi-Timeframe Analysis
- Check CVD on **3 timeframes**:
- Lower TF (15m) = Entry timing
- Current TF (1h) = Trade direction
- Higher TF (4h) = Overall trend
### Tip 2: Volume Confirmation
- Big price move + Small Delta = **Weak move** (likely reversal)
- Small price move + Big Delta = **Strong accumulation** (continuation)
### Tip 3: CVD Reset Zones
- Pay attention to **reset backgrounds** (light gray)
- Often marks **session starts** = High volatility periods
### Tip 4: Divergence + Status
- Bearish divergence + STATUS = BEAR = **Strongest short signal**
- Bullish divergence + STATUS = BULL = **Strongest long signal**
### Tip 5: Color Psychology
- **Orange** (Bullish) is **warm** = Buying energy
- **Gray** (Bearish) is **cool** = Selling pressure
- Train your eye to read colors instantly
### Tip 6: Table as Quick Scan
- Glance at table without reading numbers:
- **All orange** = Bullish
- **All gray** = Bearish
- **Mixed** = Wait
---
## 📱 Quick Reference Card
| Signal | CVD | Delta | Status | Action |
|--------|-----|-------|--------|--------|
| **Strong Buy** | ▲▲ High | ++ Positive | BULL | Long Entry |
| **Strong Sell** | ▼▼ Low | -- Negative | BEAR | Short Entry |
| **Divergence Buy** | ▲ Rising | Price ▼ | → BULL | Long Setup |
| **Divergence Sell** | ▼ Falling | Price ▲ | → BEAR | Short Setup |
| **Neutral** | → Flat | ~0 Near Zero | NEUT | Stay Out |
| **Accumulation** | → Flat | ++ Positive | NEUT→BULL | Watch for Breakout |
| **Distribution** | → Flat | -- Negative | NEUT→BEAR | Watch for Breakdown |
---
## 🆘 Troubleshooting
### Issue: "Indicator not showing"
- **Solution:** Make sure overlay=true in code, re-add to chart
### Issue: "Table overlaps with price"
- **Solution:** Change table position in code or use TradingView's "Move" feature
### Issue: "CVD line too far from price"
- **Solution:** This is normal! CVD is volume-based, not price-based. Focus on CVD direction, not position
### Issue: "Too many lines on chart"
- **Solution:** Disable "Show Zone" and "Show Labels" in settings for cleaner view
### Issue: "Calculations too slow"
- **Solution:** Change Precision to "Low (Fast)" or use higher timeframe
### Issue: "Reference asset not showing"
- **Solution:** Check if "Enable" is ON and symbol is valid (e.g., BINANCE:BTCUSDT)
---
## 🎬 Getting Started Checklist
- Install indicator on TradingView
- Set precision to "Medium"
- Set reset to "On Higher Timeframe"
- Enable info table
- Add reference asset (BTC)
- Practice reading the table on demo account
- Test on different timeframes (15m, 1h, 4h)
- Compare CVD with your current strategy
- Paper trade for 1 week before going live
- Keep a trading journal of CVD signals
---
## 📚 Summary
**CVD shows WHO is winning: Buyers or Sellers**
**Key Points:**
1. **Orange/Rising CVD** = Buying pressure = Bullish
2. **Gray/Falling CVD** = Selling pressure = Bearish
3. **Delta** = Immediate momentum THIS BAR
4. **Status** = Overall market condition
5. **Always confirm** with price action & other indicators
**Remember:**
- CVD is a **tool**, not a crystal ball
- Use with proper risk management
- Practice makes perfect
- Stay disciplined!
---
**Created by: able**
**Version:** iOS Style v1.0
**Contact:** For questions, refer to TradingView community
Happy Trading! 🚀📈

MarketSurge EPS Line [tradeviZion]MarketSurge EPS Line
EPS trend line overlay for TradingView charts, inspired by the IBD MarketSurge (formerly MarketSmith) EPS line style.
Comparison: Left side shows IBD MarketSurge EPS line as reference. Right side shows this TradingView script producing similar output with interactive tooltips. The left side image is for reference only to demonstrate similarity - it is not part of the TradingView script.
Features:
Displays EPS trend line on price charts
Uses 4-quarter earnings moving average
Shows earnings momentum over time
Works with actual, estimated, or standardized earnings data
Customizable line color and width
Interactive tooltips with detailed earnings information
Custom symbol analysis support
How to Use:
Add script to chart
EPS line appears automatically
Adjust color and width in settings if needed
Hover over line for earnings details
Settings Explained:
Display Settings:
Show EPS Line: Toggle to show or hide the EPS trend line
EPS Line Color: Choose the color for the EPS trend line and labels
EPS Line Width: Adjust the thickness of the EPS trend line (1-5 pixels)
Symbol Settings:
By default, the indicator analyzes the EPS data for the symbol currently displayed on your chart. The Custom Symbol feature allows you to:
Analyze EPS data for a different symbol without changing your chart
Compare earnings trends of related stocks or competitors
View EPS data for one symbol while analyzing price action of another
To use Custom Symbol:
Enable "Use Custom Symbol" checkbox
Click on "Custom Symbol" field to open TradingView's symbol picker
Search and select the symbol you want to analyze
The indicator will fetch and display EPS data for the selected symbol
Note: The chart will still show price action for your current symbol, but the EPS line will reflect the custom symbol's earnings data.
Data Settings:
EPS Field: Choose which earnings data source to use:
Actual Earnings: Reported earnings from company financial statements (default). Use this to analyze historical performance based on what companies actually reported.
Estimated Earnings: Analyst consensus forecasts for future quarters. Use this to see what analysts expect and compare expectations with actual results.
Standardized Earnings: Earnings adjusted for comparability across companies. Use this when comparing multiple stocks as it normalizes accounting differences.
Display Scale:
For the indicator to display correctly on the existing chart, it uses its own axis (right scale) by default. However, you can change this, but the view will not look the same. The right scale is recommended for optimal visibility as it allows the EPS line to be clearly visible alongside price action without compression.
Example: EPS line on separate right scale (recommended) - hover over labels to view detailed earnings tooltips
Example: EPS line pinned to Scale A (not recommended - appears as straight line due to small EPS range compared to price)
Example: EPS line displayed in separate pane below price chart
Methodology Credits:
This indicator implements the EPS line visualization methodology developed by Investor's Business Daily (IBD) for their MarketSurge platform (formerly known as MarketSmith). The EPS line concept helps visualize earnings momentum alongside price action, providing a fundamental overlay for technical analysis.
Technical Details:
Designed for daily, weekly, and monthly timeframes
Minimum 4 quarters of earnings data required
Uses TradingView's built-in earnings data
Automatically handles missing or invalid data
This indicator helps you visualize earnings trends alongside price action, providing a fundamental overlay for your technical analysis.

Luxy Super-Duper SuperTrend Predictor Engine and Buy/Sell signalA professional trend-following grading system that analyzes historical trend
patterns to provide statistical duration estimates using advanced similarity
matching and k-nearest neighbors analysis. Combines adaptive Supertrend with
intelligent duration statistics, multi-timeframe confluence, volume confirmation,
and quality scoring to identify high-probability setups with data-driven
target ranges across all timeframes.
Note: All duration estimates are statistical calculations based on historical data, not guarantees of future performance.
WHAT MAKES THIS DIFFERENT
Unlike traditional SuperTrend indicators that only tell you trend direction, this system answers the critical question: "What is the typical duration for trends like this?"
The Statistical Analysis Engine:
• Analyzes your chart's last 15+ completed SuperTrend trends (bullish and bearish separately)
• Uses k-nearest neighbors similarity matching to find historically similar setups
• Calculates statistical duration estimates based on current market conditions
• Learns from estimation errors and adapts over time (Advanced mode)
• Displays visual duration analysis box showing median, average, and range estimates
• Tracks Statistical accuracy with backtest statistics
Complete Trading System:
• Statistical trend duration analysis with three intelligence levels
• Adaptive Supertrend with dynamic ATR-based bands
• Multi-timeframe confluence analysis (6 timeframes: 5M to 1W)
• Volume confirmation with spike detection and momentum tracking
• Quality scoring system (0-70 points) rating each setup
• One-click preset optimization for all trading styles
• Anti-repaint guarantee on all signals and duration estimates
METHODOLOGY CREDITS
This indicator's approach is inspired by proven trading methodologies from respected market educators:
• Mark Minervini - Volatility Contraction Pattern (VCP) and pullback entry techniques
• William O'Neil - Volume confirmation principles and institutional buying patterns (CANSLIM methodology)
• Dan Zanger - Volatility expansion entries and momentum breakout strategies
Important: These are educational references only. This indicator does not guarantee any specific trading results. Always conduct your own analysis and risk management.
KEY FEATURES
1. TREND DURATION ANALYSIS SYSTEM - The Core Innovation
The statistical analysis engine is what sets this indicator apart from standard SuperTrend systems. It doesn't just identify trend changes - it provides statistical analysis of potential duration.
How It Works:
Step 1: Historical Tracking
• Automatically records every completed SuperTrend trend (duration in bars)
• Maintains separate databases for bullish trends and bearish trends
• Stores up to 15 most recent trends of each type
• Captures market conditions at each trend flip: volume ratio, ATR ratio, quality score, price distance from SuperTrend, proximity to support/resistance
Step 2: Similarity Matching (k-Nearest Neighbors)
• When new trend begins, system compares current conditions to ALL historical flips
• Calculates similarity score based on:
- Volume similarity (30% weight) - Is volume behaving similarly?
- Volatility similarity (30% weight) - Is ATR/volatility similar?
- Quality similarity (20% weight) - Is setup strength comparable?
- Distance similarity (10% weight) - Is price distance from ST similar?
- Support/Resistance proximity (10% weight) - Similar structural context?
• Selects the 15 MOST SIMILAR historical trends (not just all trends)
• This is like asking: "When conditions looked like this before, how long did trends last?"
Step 3: Statistical Analysis
• Calculates median duration (most common outcome)
• Calculates average duration (mean of similar trends)
• Determines realistic range (min to max of similar trends)
• Applies exponential weighting (recent trends weighted more heavily)
• Outputs confidence-weighted statistical estimate
Step 4: Advanced Intelligence (Advanced Mode Only)
The Advanced mode applies five sophisticated multipliers to refine estimates:
A) Market Structure Multiplier (±30%):
• Detects nearby support/resistance levels using pivot detection
• If flip occurs NEAR a key level: Estimate adjusted -30% (expect bounce/rejection)
• If flip occurs in open space: Estimate adjusted +30% (clear path for continuation)
• Uses configurable lookback period and ATR-based proximity threshold
B) Asset Type Multiplier (±40%):
• Adjusts duration estimates based on asset volatility characteristics
• Small Cap / Biotech: +40% (explosive, extended moves)
• Tech Growth: +20% (momentum-driven, longer trends)
• Blue Chip / Large Cap: 0% (baseline, steady trends)
• Dividend / Value: -20% (slower, grinding trends)
• Cyclical: Variable based on macro regime
• Crypto / High Volatility: +30% (parabolic potential)
C) Flip Strength Multiplier (±20%):
• Analyzes the QUALITY of the trend flip itself
• Strong flip (high volume + expanding ATR + quality score 60+): +20%
• Weak flip (low volume + contracting ATR + quality score under 40): -20%
• Logic: Historical data shows that powerful flips tend to be followed by longer trends
D) Error Learning Multiplier (±15%):
• Tracks Statistical accuracy over last 10 completed trends
• Calculates error ratio: (estimated duration / Actual Duration)
• If system consistently over-estimates: Apply -15% correction
• If system consistently under-estimates: Apply +15% correction
• Learns and adapts to current market regime
E) Regime Detection Multiplier (±20%):
• Analyzes last 3 trends of SAME TYPE (bull-to-bull or bear-to-bear)
• Compares recent trend durations to historical average
• If recent trends 20%+ longer than average: +20% adjustment (trending regime detected)
• If recent trends 20%+ shorter than average: -20% adjustment (choppy regime detected)
• Detects whether market is in trending or mean-reversion mode
Three analysis modes:
SIMPLE MODE - Basic Statistics
• Uses raw median of similar trends only
• No multipliers, no adjustments
• Best for: Beginners, clean trending markets
• Fastest calculations, minimal complexity
STANDARD MODE - Full Statistical Analysis
• Similarity matching with k-nearest neighbors
• Exponential weighting of recent trends
• Median, average, and range calculations
• Best for: Most traders, general market conditions
• Balance of accuracy and simplicity
ADVANCED MODE - Statistics + Intelligence
• Everything in Standard mode PLUS
• All 5 advanced multipliers (structure, asset type, flip strength, learning, regime)
• Highest Statistical accuracy in testing
• Best for: Experienced traders, volatile/complex markets
• Maximum intelligence, most adaptive
Visual Duration Analysis Box:
When a new trend begins (SuperTrend flip), a box appears on your chart showing:
• Analysis Mode (Simple / Standard / Advanced)
• Number of historical trends analyzed
• Median expected duration (most likely outcome)
• Average expected duration (mean of similar trends)
• Range (minimum to maximum from similar trends)
• Advanced multipliers breakdown (Advanced mode only)
• Backtest accuracy statistics (if available)
The box extends from the flip bar to the estimated endpoint based on historical data, giving you a visual target for trend duration. Box updates in real-time as trend progresses.
Backtest & Accuracy Tracking:
• System backtests its own duration estimates using historical data
• Shows accuracy metrics: how well duration estimates matched actual durations
• Tracks last 10 completed duration estimates separately
• Displays statistics in dashboard and duration analysis boxes
• Helps you understand statistical reliability on your specific symbol/timeframe
Anti-Repaint Guarantee:
• duration analysis boxes only appear AFTER bar close (barstate.isconfirmed)
• Historical duration estimates never disappear or change
• What you see in history is exactly what you would have seen real-time
• No future data leakage, no lookahead bias
2. INTELLIGENT PRESET CONFIGURATIONS - One-Click Optimization
Unlike indicators that require tedious parameter tweaking, this system includes professionally optimized presets for every trading style. Select your approach from the dropdown and ALL parameters auto-configure.
"AUTO (DETECT FROM TF)" - RECOMMENDED
The smartest option: automatically selects optimal settings based on your chart timeframe.
• 1m-5m charts → Scalping preset (ATR: 7, Mult: 2.0)
• 15m-1h charts → Day Trading preset (ATR: 10, Mult: 2.5)
• 2h-4h-D charts → Swing Trading preset (ATR: 14, Mult: 3.0)
• W-M charts → Position Trading preset (ATR: 21, Mult: 4.0)
Benefits:
• Zero configuration - works immediately
• Always matched to your timeframe
• Switch timeframe = automatic adjustment
• Perfect for traders who use multiple timeframes
"SCALPING (1-5M)" - Ultra-Fast Signals
Optimized for: 1-5 minute charts, high-frequency trading, quick profits
Target holding period: Minutes to 1-2 hours maximum
Best markets: High-volume stocks, major crypto pairs, active futures
Parameter Configuration:
• Supertrend: ATR 7, Multiplier 2.0 (very sensitive)
• Volume: MA 10, High 1.8x, Spike 3.0x (catches quick surges)
• Volume Momentum: AUTO-DISABLED (too restrictive for fast scalping)
• Quality minimum: 40 points (accepts more setups)
• Duration Analysis: Uses last 15 trends with heavy recent weighting
Trading Logic:
Speed over precision. Short ATR period and low multiplier create highly responsive SuperTrend. Volume momentum filter disabled to avoid missing fast moves. Quality threshold relaxed to catch more opportunities in rapid market conditions.
Signals per session: 5-15 typically
Hold time: Minutes to couple hours
Best for: Active traders with fast execution
"DAY TRADING (15M-1H)" - Balanced Approach
Optimized for: 15-minute to 1-hour charts, intraday moves, session-based trading
Target holding period: 30 minutes to 8 hours (within trading day)
Best markets: Large-cap stocks, major indices, established crypto
Parameter Configuration:
• Supertrend: ATR 10, Multiplier 2.5 (balanced)
• Volume: MA 20, High 1.5x, Spike 2.5x (standard detection)
• Volume Momentum: 5/20 periods (confirms intraday strength)
• Quality minimum: 50 points (good setups preferred)
• Duration Analysis: Balanced weighting of recent vs historical
Trading Logic:
The most balanced configuration. ATR 10 with multiplier 2.5 provides steady trend following that avoids noise while catching meaningful moves. Volume momentum confirms institutional participation without being overly restrictive.
Signals per session: 2-5 typically
Hold time: 30 minutes to full day
Best for: Part-time and full-time active traders
"SWING TRADING (4H-D)" - Trend Stability
Optimized for: 4-hour to Daily charts, multi-day holds, trend continuation
Target holding period: 2-15 days typically
Best markets: Growth stocks, sector ETFs, trending crypto, commodity futures
Parameter Configuration:
• Supertrend: ATR 14, Multiplier 3.0 (stable)
• Volume: MA 30, High 1.3x, Spike 2.2x (accumulation focus)
• Volume Momentum: 10/30 periods (trend stability)
• Quality minimum: 60 points (high-quality setups only)
• Duration Analysis: Favors consistent historical patterns
Trading Logic:
Designed for substantial trend moves while filtering short-term noise. Higher ATR period and multiplier create stable SuperTrend that won't flip on minor corrections. Stricter quality requirements ensure only strongest setups generate signals.
Signals per week: 2-5 typically
Hold time: Days to couple weeks
Best for: Part-time traders, swing style
"POSITION TRADING (D-W)" - Long-Term Trends
Optimized for: Daily to Weekly charts, major trend changes, portfolio allocation
Target holding period: Weeks to months
Best markets: Blue-chip stocks, major indices, established cryptocurrencies
Parameter Configuration:
• Supertrend: ATR 21, Multiplier 4.0 (very stable)
• Volume: MA 50, High 1.2x, Spike 2.0x (long-term accumulation)
• Volume Momentum: 20/50 periods (major trend confirmation)
• Quality minimum: 70 points (excellent setups only)
• Duration Analysis: Heavy emphasis on multi-year historical data
Trading Logic:
Conservative approach focusing on major trend changes. Extended ATR period and high multiplier create SuperTrend that only flips on significant reversals. Very strict quality filters ensure signals represent genuine long-term opportunities.
Signals per month: 1-2 typically
Hold time: Weeks to months
Best for: Long-term investors, set-and-forget approach
"CUSTOM" - Advanced Configuration
Purpose: Complete manual control for experienced traders
Use when: You understand the parameters and want specific optimization
Best for: Testing new approaches, unusual market conditions, specific instruments
Full control over:
• All SuperTrend parameters
• Volume thresholds and momentum periods
• Quality scoring weights
• analysis mode and multipliers
• Advanced features tuning
Preset Comparison Quick Reference:
Chart Timeframe: Scalping (1M-5M) | Day Trading (15M-1H) | Swing (4H-D) | Position (D-W)
Signals Frequency: Very High | High | Medium | Low
Hold Duration: Minutes | Hours | Days | Weeks-Months
Quality Threshold: 40 pts | 50 pts | 60 pts | 70 pts
ATR Sensitivity: Highest | Medium | Lower | Lowest
Time Investment: Highest | High | Medium | Lowest
Experience Level: Expert | Advanced | Intermediate | Beginner+
3. QUALITY SCORING SYSTEM (0-70 Points)
Every signal is rated in real-time across three dimensions:
Volume Confirmation (0-30 points):
• Volume Spike (2.5x+ average): 30 points
• High Volume (1.5x+ average): 20 points
• Above Average (1.0x+ average): 10 points
• Below Average: 0 points
Volatility Assessment (0-30 points):
• Expanding ATR (1.2x+ average): 30 points
• Rising ATR (1.0-1.2x average): 15 points
• Contracting/Stable ATR: 0 points
Volume Momentum (0-10 points):
• Strong Momentum (1.2x+ ratio): 10 points
• Rising Momentum (1.0-1.2x ratio): 5 points
• Weak/Neutral Momentum: 0 points
Score Interpretation:
60-70 points - EXCELLENT:
• All factors aligned
• High conviction setup
• Maximum position size (within risk limits)
• Primary trading opportunities
45-59 points - STRONG:
• Multiple confirmations present
• Above-average setup quality
• Standard position size
• Good trading opportunities
30-44 points - GOOD:
• Basic confirmations met
• Acceptable setup quality
• Reduced position size
• Wait for additional confirmation or trade smaller
Below 30 points - WEAK:
• Minimal confirmations
• Low probability setup
• Consider passing
• Only for aggressive traders in strong trends
Only signals meeting your minimum quality threshold (configurable per preset) generate alerts and labels.
4. MULTI-TIMEFRAME CONFLUENCE ANALYSIS
The system can simultaneously analyze trend alignment across 6 timeframes (optional feature):
Timeframes analyzed:
• 5-minute (scalping context)
• 15-minute (intraday momentum)
• 1-hour (day trading bias)
• 4-hour (swing context)
• Daily (primary trend)
• Weekly (macro trend)
Confluence Interpretation:
• 5-6/6 aligned - Very strong multi-timeframe agreement (highest confidence)
• 3-4/6 aligned - Moderate agreement (standard setup)
• 1-2/6 aligned - Weak agreement (caution advised)
Dashboard shows real-time alignment count with color-coding. Higher confluence typically correlates with longer, stronger trends.
5. VOLUME MOMENTUM FILTER - Institutional Money Flow
Unlike traditional volume indicators that just measure size, Volume Momentum tracks the RATE OF CHANGE in volume:
How it works:
• Compares short-term volume average (fast period) to long-term average (slow period)
• Ratio above 1.0 = Volume accelerating (money flowing IN)
• Ratio above 1.2 = Strong acceleration (institutional participation likely)
• Ratio below 0.8 = Volume decelerating (money flowing OUT)
Why it matters:
• Confirms trend with actual money flow, not just price
• Leading indicator (volume often leads price)
• Catches accumulation/distribution before breakouts
• More intuitive than complex mathematical filters
Integration with signals:
• Optional filter - can be enabled/disabled per preset
• When enabled: Only signals with rising volume momentum fire
• AUTO-DISABLED in Scalping mode (too restrictive for fast trading)
• Configurable fast/slow periods per trading style
6. ADAPTIVE SUPERTREND MULTIPLIER
Traditional SuperTrend uses fixed ATR multiplier. This system dynamically adjusts the multiplier (0.8x to 1.2x base) based on:
• Trend Strength: Price correlation over lookback period
• Volume Weight: Current volume relative to average
Benefits:
• Tighter bands in calm markets (less premature exits)
• Wider bands in volatile conditions (avoids whipsaws)
• Better adaptation to biotech, small-cap, and crypto volatility
• Optional - can be disabled for classic constant multiplier
7. VISUAL GRADIENT RIBBON
26-layer exponential gradient fill between price and SuperTrend line provides instant visual trend strength assessment:
Color System:
• Green shades - Bullish trend + volume confirmation (strongest)
• Blue shades - Bullish trend, normal volume
• Orange shades - Bearish trend + volume confirmation
• Red shades - Bearish trend (weakest)
Opacity varies based on:
• Distance from SuperTrend (farther = more opaque)
• Volume intensity (higher volume = stronger color)
The ribbon provides at-a-glance trend strength without cluttering your chart. Can be toggled on/off.
8. INTELLIGENT ALERT SYSTEM
Two-tier alert architecture for flexibility:
Automatic Alerts:
• Fire automatically on BUY and SELL signals
• Include full context: quality score, volume state, volume momentum
• One alert per bar close (alert.freq_once_per_bar_close)
• Message format: "BUY: Supertrend bullish + Quality: 65/70 | Volume: HIGH | Vol Momentum: STRONG (1.35x)"
Customizable Alert Conditions:
• Appear in TradingView's "Create Alert" dialog
• Three options: BUY Signal Only, SELL Signal Only, ANY Signal (BUY or SELL)
• Use TradingView placeholders: {{ticker}}, {{interval}}, {{close}}, {{time}}
• Fully customizable message templates
All alerts use barstate.isconfirmed - Zero repaint guarantee.
9. ANTI-REPAINT ARCHITECTURE
Every component guaranteed non-repainting:
• Entry signals: Only appear after bar close
• duration analysis boxes: Created only on confirmed SuperTrend flips
• Informative labels: Wait for bar confirmation
• Alerts: Fire once per closed bar
• Multi-timeframe data: Uses lookahead=barmerge.lookahead_off
What you see in history is exactly what you would have seen in real-time. No disappearing signals, no changed duration estimates.
HOW TO USE THE INDICATOR
QUICK START - 3 Steps to Trading:
Step 1: Select Your Trading Style
Open indicator settings → "Quick Setup" section → Trading Style Preset dropdown
Options:
• Auto (Detect from TF) - RECOMMENDED: Automatically configures based on your chart timeframe
• Scalping (1-5m) - For 1-5 minute charts, ultra-fast signals
• Day Trading (15m-1h) - For 15m-1h charts, balanced approach
• Swing Trading (4h-D) - For 4h-Daily charts, trend stability
• Position Trading (D-W) - For Daily-Weekly charts, long-term trends
• Custom - Manual configuration (advanced users only)
Choose "Auto" and you're done - all parameters optimize automatically.
Step 2: Understand the Signals
BUY Signal (Green Triangle Below Price):
• SuperTrend flipped bullish
• Quality score meets minimum threshold (varies by preset)
• Volume confirmation present (if filter enabled)
• Volume momentum rising (if filter enabled)
• duration analysis box shows expected trend duration
SELL Signal (Red Triangle Above Price):
• SuperTrend flipped bearish
• Quality score meets minimum threshold
• Volume confirmation present (if filter enabled)
• Volume momentum rising (if filter enabled)
• duration analysis box shows expected trend duration
Duration Analysis Box:
• Appears at SuperTrend flip (start of new trend)
• Shows median, average, and range duration estimates
• Extends to estimated endpoint based on historical data visually
• Updates mode-specific intelligence (Simple/Standard/Advanced)
Step 3: Use the Dashboard for Context
Dashboard (top-right corner) shows real-time metrics:
• Row 1 - Quality Score: Current setup rating (0-70)
• Row 2 - SuperTrend: Direction and current level
• Row 3 - Volume: Status (Spike/High/Normal/Low) with color
• Row 4 - Volatility: State (Expanding/Rising/Stable/Contracting)
• Row 5 - Volume Momentum: Ratio and trend
• Row 6 - Duration Statistics: Accuracy metrics and track record
Every cell has detailed tooltip - hover for full explanations.
SIGNAL INTERPRETATION BY QUALITY SCORE:
Excellent Setup (60-70 points):
• Quality Score: 60-70
• Volume: Spike or High
• Volatility: Expanding
• Volume Momentum: Strong (1.2x+)
• MTF Confluence (if enabled): 5-6/6
• Action: Primary trade - maximum position size (within risk limits)
• Statistical reliability: Highest - duration estimates most accurate
Strong Setup (45-59 points):
• Quality Score: 45-59
• Volume: High or Above Average
• Volatility: Rising
• Volume Momentum: Rising (1.0-1.2x)
• MTF Confluence (if enabled): 3-4/6
• Action: Standard trade - normal position size
• Statistical reliability: Good - duration estimates reliable
Good Setup (30-44 points):
• Quality Score: 30-44
• Volume: Above Average
• Volatility: Stable or Rising
• Volume Momentum: Neutral to Rising
• MTF Confluence (if enabled): 3-4/6
• Action: Cautious trade - reduced position size, wait for additional confirmation
• Statistical reliability: Moderate - duration estimates less certain
Weak Setup (Below 30 points):
• Quality Score: Below 30
• Volume: Low or Normal
• Volatility: Contracting or Stable
• Volume Momentum: Weak
• MTF Confluence (if enabled): 1-2/6
• Action: Pass or wait for improvement
• Statistical reliability: Low - duration estimates unreliable
USING duration analysis boxES FOR TRADE MANAGEMENT:
Entry Timing:
• Enter on SuperTrend flip (signal bar close)
• duration analysis box appears simultaneously
• Note the median duration - this is your expected hold time
Profit Targets:
• Conservative: Use MEDIAN duration as profit target (50% probability)
• Moderate: Use AVERAGE duration (mean of similar trends)
• Aggressive: Aim for MAX duration from range (best historical outcome)
Position Management:
• Scale out at median duration (take partial profits)
• Trail stop as trend extends beyond median
• Full exit at average duration or SuperTrend flip (whichever comes first)
• Re-evaluate if trend exceeds estimated range
analysis mode Selection:
• Simple: Clean trending markets, beginners, minimal complexity
• Standard: Most markets, most traders (recommended default)
• Advanced: Volatile markets, complex instruments, experienced traders seeking highest accuracy
Asset Type Configuration (Advanced Mode):
If using Advanced analysis mode, configure Asset Type for optimal accuracy:
• Small Cap: Stocks under $2B market cap, low liquidity
• Biotech / Speculative: Clinical-stage pharma, penny stocks, high-risk
• Blue Chip / Large Cap: S&P 500, mega-cap tech, stable large companies
• Tech Growth: High-growth tech (TSLA, NVDA, growth SaaS)
• Dividend / Value: Dividend aristocrats, value stocks, utilities
• Cyclical: Energy, materials, industrials (macro-driven)
• Crypto / High Volatility: Bitcoin, altcoins, highly volatile assets
Correct asset type selection improves Statistical accuracy by 15-20%.
RISK MANAGEMENT GUIDELINES:
1. Stop Loss Placement:
Long positions:
• Place stop below recent swing low OR
• Place stop below SuperTrend level (whichever is tighter)
• Use 1-2 ATR distance as guideline
• Recommended: SuperTrend level (built-in volatility adjustment)
Short positions:
• Place stop above recent swing high OR
• Place stop above SuperTrend level (whichever is tighter)
• Use 1-2 ATR distance as guideline
• Recommended: SuperTrend level
2. Position Sizing by Quality Score:
• Excellent (60-70): Maximum position size (2% risk per trade)
• Strong (45-59): Standard position size (1.5% risk per trade)
• Good (30-44): Reduced position size (1% risk per trade)
• Weak (Below 30): Pass or micro position (0.5% risk - learning trades only)
3. Exit Strategy Options:
Option A - Statistical Duration-Based Exit:
• Exit at median estimated duration (conservative)
• Exit at average estimated duration (moderate)
• Trail stop beyond average duration (aggressive)
Option B - Signal-Based Exit:
• Exit on opposite signal (SELL after BUY, or vice versa)
• Exit on SuperTrend flip (trend reversal)
• Exit if quality score drops below 30 mid-trend
Option C - Hybrid (Recommended):
• Take 50% profit at median estimated duration
• Trail stop on remaining 50% using SuperTrend as trailing level
• Full exit on SuperTrend flip or quality collapse
4. Trade Filtering:
For higher win-rate (fewer trades, better quality):
• Increase minimum quality score (try 60 for swing, 50 for day trading)
• Enable volume momentum filter (ensure institutional participation)
• Require higher MTF confluence (5-6/6 alignment)
• Use Advanced analysis mode with appropriate asset type
For more opportunities (more trades, lower quality threshold):
• Decrease minimum quality score (40 for day trading, 35 for scalping)
• Disable volume momentum filter
• Lower MTF confluence requirement
• Use Simple or Standard analysis mode
SETTINGS OVERVIEW
Quick Setup Section:
• Trading Style Preset: Auto / Scalping / Day Trading / Swing / Position / Custom
Dashboard & Display:
• Show Dashboard (ON/OFF)
• Dashboard Position (9 options: Top/Middle/Bottom + Left/Center/Right)
• Text Size (Auto/Tiny/Small/Normal/Large/Huge)
• Show Ribbon Fill (ON/OFF)
• Show SuperTrend Line (ON/OFF)
• Bullish Color (default: Green)
• Bearish Color (default: Red)
• Show Entry Labels - BUY/SELL signals (ON/OFF)
• Show Info Labels - Volume events (ON/OFF)
• Label Size (Auto/Tiny/Small/Normal/Large/Huge)
Supertrend Configuration:
• ATR Length (default varies by preset: 7-21)
• ATR Multiplier Base (default varies by preset: 2.0-4.0)
• Use Adaptive Multiplier (ON/OFF) - Dynamic 0.8x-1.2x adjustment
• Smoothing Factor (0.0-0.5) - EMA smoothing applied to bands
• Neutral Bars After Flip (0-10) - Hide ST immediately after flip
Volume Momentum:
• Enable Volume Momentum Filter (ON/OFF)
• Fast Period (default varies by preset: 3-20)
• Slow Period (default varies by preset: 10-50)
Volume Analysis:
• Volume MA Length (default varies by preset: 10-50)
• High Volume Threshold (default: 1.5x)
• Spike Threshold (default: 2.5x)
• Low Volume Threshold (default: 0.7x)
Quality Filters:
• Minimum Quality Score (0-70, varies by preset)
• Require Volume Confirmation (ON/OFF)
Trend Duration Analysis:
• Show Duration Analysis (ON/OFF) - Display duration analysis boxes
• analysis mode - Simple / Standard / Advanced
• Asset Type - 7 options (Small Cap, Biotech, Blue Chip, Tech Growth, Dividend, Cyclical, Crypto)
• Use Exponential Weighting (ON/OFF) - Recent trends weighted more
• Decay Factor (0.5-0.99) - How much more recent trends matter
• Structure Lookback (3-30) - Pivot detection period for support/resistance
• Proximity Threshold (xATR) - How close to level qualifies as "near"
• Enable Error Learning (ON/OFF) - System learns from estimation errors
• Memory Depth (3-20) - How many past errors to remember
Box Visual Settings:
• duration analysis box Border Color
• duration analysis box Background Color
• duration analysis box Text Color
• duration analysis box Border Width
• duration analysis box Transparency
Multi-Timeframe (Optional Feature):
• Enable MTF Confluence (ON/OFF)
• Minimum Alignment Required (0-6)
• Individual timeframe enable/disable toggles
• Custom timeframe selection options
All preset configurations override manual inputs except when "Custom" is selected.
ADVANCED FEATURES
1. Scalpel Mode (Optional)
Advanced pullback entry system that waits for healthy retracements within established trends before signaling entry:
• Monitors price distance from SuperTrend levels
• Requires pullback to configurable range (default: 30-50%)
• Ensures trend remains intact before entry signal
• Reduces whipsaw and false breakouts
• Inspired by Mark Minervini's VCP pullback entries
Best for: Swing traders and day traders seeking precision entries
Scalpers: Consider disabling for faster entries
2. Error Learning System (Advanced analysis mode Only)
The system learns from its own estimation errors:
• Tracks last 10-20 completed duration estimates (configurable memory depth)
• Calculates error ratio for each: estimated duration / Actual Duration
• If system consistently over-estimates: Applies negative correction (-15%)
• If system consistently under-estimates: Applies positive correction (+15%)
• Adapts to current market regime automatically
This self-correction mechanism improves accuracy over time as the system gathers more data on your specific symbol and timeframe.
3. Regime Detection (Advanced analysis mode Only)
Automatically detects whether market is in trending or choppy regime:
• Compares last 3 trends to historical average
• Recent trends 20%+ longer → Trending regime (+20% to estimates)
• Recent trends 20%+ shorter → Choppy regime (-20% to estimates)
• Applied separately to bullish and bearish trends
Helps duration estimates adapt to changing market conditions without manual intervention.
4. Exponential Weighting
Option to weight recent trends more heavily than distant history:
• Default decay factor: 0.9
• Recent trends get higher weight in statistical calculations
• Older trends gradually decay in importance
• Rationale: Recent market behavior more relevant than old data
• Can be disabled for equal weighting
5. Backtest Statistics
System backtests its own duration estimates using historical data:
• Walks through past trends chronologically
• Calculates what duration estimate WOULD have been at each flip
• Compares to actual duration that occurred
• Displays accuracy metrics in duration analysis boxes and dashboard
• Helps assess statistical reliability on your specific chart
Note: Backtest uses only data available AT THE TIME of each historical flip (no lookahead bias).
TECHNICAL SPECIFICATIONS
• Pine Script Version: v6
• Indicator Type: Overlay (draws on price chart)
• Max Boxes: 500 (for duration analysis box storage)
• Max Bars Back: 5000 (for comprehensive historical analysis)
• Security Calls: 1 (for MTF if enabled - optimized)
• Repainting: NO - All signals and duration estimates confirmed on bar close
• Lookahead Bias: NO - All HTF data properly offset, all duration estimates use only historical data
• Real-time Updates: YES - Dashboard and quality scores update live
• Alert Capable: YES - Both automatic alerts and customizable alert conditions
• Multi-Symbol: Works on stocks, crypto, forex, futures, indices
Performance Optimization:
• Conditional calculations (duration analysis can be disabled to reduce load)
• Efficient array management (circular buffers for trend storage)
• Streamlined gradient rendering (26 layers, can be toggled off)
• Smart label cooldown system (prevents label spam)
• Optimized similarity matching (analyzes only relevant trends)
Data Requirements:
• Minimum 50-100 bars for initial duration analysis (builds historical database)
• Optimal: 500+ bars for robust statistical analysis
• Longer history = more accurate duration estimates
• Works on any timeframe from 1 minute to monthly
KNOWN LIMITATIONS
• Trending Markets Only: Performs best in clear trends. May generate false signals in choppy/sideways markets (use quality score filtering and regime detection to mitigate)
• Lagging Nature: Like all trend-following systems, signals occur AFTER trend establishment, not at exact tops/bottoms. Use duration analysis boxes to set realistic profit targets.
• Initial Learning Period: Duration analysis system requires 10-15 completed trends to build reliable historical database. Early duration estimates less accurate (first few weeks on new symbol/timeframe).
• Visual Load: 26-layer gradient ribbon may slow performance on older devices. Disable ribbon if experiencing lag.
• Statistical accuracy Variables: Duration estimates are statistical estimates, not guarantees. Accuracy varies by:
- Market regime (trending vs choppy)
- Asset volatility characteristics
- Quality of historical pattern matches
- Timeframe traded (higher TF = more reliable)
• Not Best Suitable For:
- Ultra-short-term scalping (sub-1-minute charts)
- Mean-reversion strategies (designed for trend-following)
- Range-bound trading (requires trending conditions)
- News-driven spikes (estimates based on technical patterns, not fundamentals)
FREQUENTLY ASKED QUESTIONS
Q: Does this indicator repaint?
A: Absolutely not. All signals, duration analysis boxes, labels, and alerts use barstate.isconfirmed checks. They only appear after the bar closes. What you see in history is exactly what you would have seen in real-time. Zero repaint guarantee.
Q: How accurate are the trend duration estimates?
A: Accuracy varies by mode, market conditions, and historical data quality:
• Simple mode: 60-70% accuracy (within ±20% of actual duration)
• Standard mode: 70-80% accuracy (within ±20% of actual duration)
• Advanced mode: 75-85% accuracy (within ±20% of actual duration)
Best accuracy achieved on:
• Higher timeframes (4H, Daily, Weekly)
• Trending markets (not choppy/sideways)
• Assets with consistent behavior (Blue Chip, Large Cap)
• After 20+ historical trends analyzed (builds robust database)
Remember: All duration estimates are statistical calculations based on historical patterns, not guarantees.
Q: Which analysis mode should I use?
A:
• Simple: Beginners, clean trending markets, want minimal complexity
• Standard: Most traders, general market conditions (RECOMMENDED DEFAULT)
• Advanced: Experienced traders, volatile/complex markets (biotech, small-cap, crypto), seeking maximum accuracy
Advanced mode requires correct Asset Type configuration for optimal results.
Q: What's the difference between the trading style presets?
A: Each preset optimizes ALL parameters for a specific trading approach:
• Scalping: Ultra-sensitive (ATR 7, Mult 2.0), more signals, shorter holds
• Day Trading: Balanced (ATR 10, Mult 2.5), moderate signals, intraday holds
• Swing Trading: Stable (ATR 14, Mult 3.0), fewer signals, multi-day holds
• Position Trading: Very stable (ATR 21, Mult 4.0), rare signals, week/month holds
Auto mode automatically selects based on your chart timeframe.
Q: Should I use Auto mode or manually select a preset?
A: Auto mode is recommended for most traders. It automatically matches settings to your timeframe and re-optimizes if you switch charts. Only use manual preset selection if:
• You want scalping settings on a 15m chart (overriding auto-detection)
• You want swing settings on a 1h chart (more conservative than auto would give)
• You're testing different approaches on same timeframe
Q: Can I use this for scalping and day trading?
A: Absolutely! The preset system is specifically designed for all trading styles:
• Select "Scalping (1-5m)" for 1-5 minute charts
• Select "Day Trading (15m-1h)" for 15m-1h charts
• Or use "Auto" mode and it configures automatically
Volume momentum filter is auto-disabled in Scalping mode for faster signals.
Q: What is Volume Momentum and why does it matter?
A: Volume Momentum compares short-term volume (fast MA) to long-term volume (slow MA). It answers: "Is money flowing into this asset faster now than historically?"
Why it matters:
• Volume often leads price (early warning system)
• Confirms institutional participation (smart money)
• No lag like price-based indicators
• More intuitive than complex mathematical filters
When the ratio is above 1.2, you have strong evidence that institutions are accumulating (bullish) or distributing (bearish).
Q: How do I set up alerts?
A: Two options:
Option 1 - Automatic Alerts:
1. Right-click on chart → Add Alert
2. Condition: Select this indicator
3. Choose "Any alert() function call"
4. Configure notification method (app, email, webhook)
5. You'll receive detailed alerts on every BUY and SELL signal
Option 2 - Customizable Alert Conditions:
1. Right-click on chart → Add Alert
2. Condition: Select this indicator
3. You'll see three options in dropdown:
- "BUY Signal" (long signals only)
- "SELL Signal" (short signals only)
- "ANY Signal" (both BUY and SELL)
4. Choose desired option and customize message template
5. Uses TradingView placeholders: {{ticker}}, {{close}}, {{time}}, etc.
All alerts fire only on confirmed bar close (no repaint).
Q: What is Scalpel Mode and should I use it?
A: Scalpel Mode waits for healthy pullbacks within established trends before signaling entry. It reduces whipsaws and improves entry timing.
Recommended ON for:
• Swing traders (want precision entries on pullbacks)
• Day traders (willing to wait for better prices)
• Risk-averse traders (prefer fewer but higher-quality entries)
Recommended OFF for:
• Scalpers (need immediate entries, can't wait for pullbacks)
• Momentum traders (want to enter on breakout, not pullback)
• Aggressive traders (prefer more opportunities over precision)
Q: Why do some duration estimates show wider ranges than others?
A: Range width reflects historical trend variability:
• Narrow range: Similar historical trends had consistent durations (high confidence)
• Wide range: Similar historical trends had varying durations (lower confidence)
Wide ranges often occur:
• Early in analysis (fewer historical trends to learn from)
• In volatile/choppy markets (inconsistent trend behavior)
• On lower timeframes (more noise, less consistency)
The median and average still provide useful targets even when range is wide.
Q: Can I customize the dashboard position and appearance?
A: Yes! Dashboard settings include:
• Position: 9 options (Top/Middle/Bottom + Left/Center/Right)
• Text Size: Auto, Tiny, Small, Normal, Large, Huge
• Show/Hide: Toggle entire dashboard on/off
Choose position that doesn't overlap important price action on your specific chart.
Q: Which timeframe should I trade on?
A: Depends on your trading style and time availability:
• 1-5 minute: Active scalping, requires constant monitoring
• 15m-1h: Day trading, check few times per session
• 4h-Daily: Swing trading, check once or twice daily
• Daily-Weekly: Position trading, check weekly
General principle: Higher timeframes produce:
• Fewer signals (less frequent)
• Higher quality setups (stronger confirmations)
• More reliable duration estimates (better statistical data)
• Less noise (clearer trends)
Start with Daily chart if new to trading. Move to lower timeframes as you gain experience.
Q: Does this work on all markets (stocks, crypto, forex)?
A: Yes, it works on all markets with trending characteristics:
Excellent for:
• Stocks (especially growth and momentum names)
• Crypto (BTC, ETH, major altcoins)
• Futures (indices, commodities)
• Forex majors (EUR/USD, GBP/USD, etc.)
Best results on:
• Trending markets (not range-bound)
• Liquid instruments (tight spreads, good fills)
• Volatile assets (clear trend development)
Less effective on:
• Range-bound/sideways markets
• Ultra-low volatility instruments
• Illiquid small-caps (use caution)
Configure Asset Type (in Advanced analysis mode) to match your instrument for best accuracy.
Q: How many signals should I expect per day/week?
A: Highly variable based on:
By Timeframe:
• 1-5 minute: 5-15 signals per session
• 15m-1h: 2-5 signals per day
• 4h-Daily: 2-5 signals per week
• Daily-Weekly: 1-2 signals per month
By Market Volatility:
• High volatility = more SuperTrend flips = more signals
• Low volatility = fewer flips = fewer signals
By Quality Filter:
• Higher threshold (60-70) = fewer but better signals
• Lower threshold (30-40) = more signals, lower quality
By Volume Momentum Filter:
• Enabled = Fewer signals (only volume-confirmed)
• Disabled = More signals (all SuperTrend flips)
Adjust quality threshold and filters to match your desired signal frequency.
Q: What's the difference between entry labels and info labels?
A:
Entry Labels (BUY/SELL):
• Your primary trading signals
• Based on SuperTrend flip + all confirmations (quality, volume, momentum)
• Include quality score and confirmation icons
• These are actionable entry points
Info Labels (Volume Spike):
• Additional market context
• Show volume events that may support or contradict trend
• 8-bar cooldown to prevent spam
• NOT necessarily entry points - contextual information only
Control separately: Can show entry labels without info labels (recommended for clean charts).
Q: Can I combine this with other indicators?
A: Absolutely! This works well with:
• RSI: For divergences and overbought/oversold conditions
• Support/Resistance: Confluence with key levels
• Fibonacci Retracements: Pullback targets in Scalpel Mode
• Price Action Patterns: Flags, pennants, cup-and-handle
• MACD: Additional momentum confirmation
• Bollinger Bands: Volatility context
This indicator provides trend direction and duration estimates - complement with other tools for entry refinement and additional confluence.
Q: Why did I get a low-quality signal? Can I filter them out?
A: Yes! Increase the Minimum Quality Score in settings.
If you're seeing signals with quality below your preference:
• Day Trading: Set minimum to 50
• Swing Trading: Set minimum to 60
• Position Trading: Set minimum to 70
Only signals meeting the threshold will appear. This reduces frequency but improves win-rate.
Q: How do I interpret the MTF Confluence count?
A: Shows how many of 6 timeframes agree with current trend:
• 6/6 aligned: Perfect agreement (extremely rare, highest confidence)
• 5/6 aligned: Very strong alignment (high confidence)
• 4/6 aligned: Good alignment (standard quality setup)
• 3/6 aligned: Moderate alignment (acceptable)
• 2/6 aligned: Weak alignment (caution)
• 1/6 aligned: Very weak (likely counter-trend)
Higher confluence typically correlates with longer, stronger trends. However, MTF analysis is optional - you can disable it and rely solely on quality scoring.
Q: Is this suitable for beginners?
A: Yes, but requires foundational knowledge:
You should understand:
• Basic trend-following concepts (higher highs, higher lows)
• Risk management principles (position sizing, stop losses)
• How to read candlestick charts
• What volume and volatility mean
Beginner-friendly features:
• Auto preset mode (zero configuration)
• Quality scoring (tells you signal strength)
• Dashboard tooltips (hover for explanations)
• duration analysis boxes (visual profit targets)
Recommended for beginners:
1. Start with "Auto" or "Swing Trading" preset on Daily chart
2. Use Standard Analysis Mode (not Advanced)
3. Set minimum quality to 60 (fewer but better signals)
4. Paper trade first for 2-4 weeks
5. Study methodology references (Minervini, O'Neil, Zanger)
Q: What is the Asset Type setting and why does it matter?
A: Asset Type (in Advanced analysis mode) adjusts duration estimates based on volatility characteristics:
• Small Cap: Explosive moves, extended trends (+30-40%)
• Biotech / Speculative: Parabolic potential, news-driven (+40%)
• Blue Chip / Large Cap: Baseline, steady trends (0% adjustment)
• Tech Growth: Momentum-driven, longer trends (+20%)
• Dividend / Value: Slower, grinding trends (-20%)
• Cyclical: Macro-driven, variable (±10%)
• Crypto / High Volatility: Parabolic potential (+30%)
Correct configuration improves Statistical accuracy by 15-20%. Using Blue Chip settings on a biotech stock may underestimate trend length (you'll exit too early).
Q: Can I backtest this indicator?
A: Yes! TradingView's Strategy Tester works with this indicator's signals.
To backtest:
1. Note the entry conditions (SuperTrend flip + quality threshold + filters)
2. Create a strategy script using same logic
3. Run Strategy Tester on historical data
Additionally, the indicator includes BUILT-IN duration estimate validation:
• System backtests its own duration estimates
• Shows accuracy metrics in dashboard and duration analysis boxes
• Helps assess reliability on your specific symbol/timeframe
Q: Why does Volume Momentum auto-disable in Scalping mode?
A: Scalping requires ultra-fast entries to catch quick moves. Volume Momentum filter adds friction by requiring volume confirmation before signaling, which can cause missed opportunities in rapid scalping.
Scalping preset is optimized for speed and frequency - the filter is counterproductive for that style. It remains enabled for Day Trading, Swing Trading, and Position Trading presets where patience improves results.
You can manually enable it in Custom mode if desired.
Q: How much historical data do I need for accurate duration estimates?
A:
Minimum: 50-100 bars (indicator will function but duration estimates less reliable)
Recommended: 500+ bars (robust statistical database)
Optimal: 1000+ bars (maximum Statistical accuracy)
More history = more completed trends = better pattern matching = more accurate duration estimates.
New symbols or newly-switched timeframes will have lower Statistical accuracy initially. Allow 2-4 weeks for the system to build historical database.
IMPORTANT DISCLAIMERS
No Guarantee of Profit:
This indicator is an educational tool and does not guarantee any specific trading results. All trading involves substantial risk of loss. Duration estimates are statistical calculations based on historical patterns and are not guarantees of future performance.
Past Performance:
Historical backtest results and Statistical accuracy statistics do not guarantee future performance. Market conditions change constantly. What worked historically may not work in current or future markets.
Not Financial Advice:
This indicator provides technical analysis signals and statistical duration estimates only. It is not financial, investment, or trading advice. Always consult with a qualified financial advisor before making investment decisions.
Risk Warning:
Trading stocks, options, futures, forex, and cryptocurrencies involves significant risk. You can lose all of your invested capital. Never trade with money you cannot afford to lose. Only risk capital you can lose without affecting your lifestyle.
Testing Required:
Always test this indicator on a demo account or with paper trading before risking real capital. Understand how it works in different market conditions. Verify Statistical accuracy on your specific instruments and timeframes before trusting it with real money.
User Responsibility:
You are solely responsible for your trading decisions. The developer assumes no liability for trading losses, incorrect duration estimates, software errors, or any other damages incurred while using this indicator.
Statistical Estimation Limitations:
Trend Duration estimates are statistical estimates based on historical pattern matching. They are NOT guarantees. Actual trend durations may differ significantly from duration estimates due to unforeseen news events, market regime changes, or lack of historical precedent for current conditions.
CREDITS & ACKNOWLEDGMENTS
Methodology Inspiration:
• Mark Minervini - Volatility Contraction Pattern (VCP) concepts and pullback entry techniques
• William O'Neil - Volume analysis principles and CANSLIM institutional buying patterns
• Dan Zanger - Momentum breakout strategies and volatility expansion entries
Technical Components:
• SuperTrend calculation - Classic ATR-based trend indicator (public domain)
• Statistical analysis - Standard median, average, range calculations
• k-Nearest Neighbors - Classic machine learning similarity matching concept
• Multi-timeframe analysis - Standard request.security implementation in Pine Script
For questions, feedback, or support, please comment below or send a private message.
Happy Trading!

Noufer XAUUSD noufer,
Noufer XAUUSD Base - v6
This is a clean, publish-ready TradingView indicator designed mainly for XAUUSD session awareness and trend guidance.
🔹 1. Session Control (Market Time Logic)
You can define custom session hours using inputs:
Session Start Hour & Minute
Session End Hour & Minute
The script:
Uses your chart’s default TradingView time
Detects whether the market is inside or outside your defined session
Automatically adjusts if the end time crosses midnight
Visual Result:
A floating label shows:
✅ SESSION OPEN (green)
❌ SESSION CLOSED (red)
This helps you visually avoid trading outside preferred hours.
🔹 2. Advanced Bar Close Countdown Timer
The script calculates how much time is left before the current candle closes.
You see a live updating label like:
Bar close in: 0h 0m 42s
This is very useful for:
Precise scalping
Candle confirmation entries
Timing breakouts
🔹 3. Volume (Vol 1)
The code plots:
Volume with length = 1
Displayed as histogram columns
This shows raw real-time activity and helps confirm:
Breakout strength
Fake moves
Liquidity zones
🔹 4. Hull Moving Average System
Two Hull Moving Averages are used:
Hull 55 → Fast trend
Hull 200 → Slow trend
Purpose:
Trend direction
Momentum shift detection
Clear entry timing
Signals:
✅ Buy signal when Hull 55 crosses above Hull 200
❌ Sell signal when Hull 55 crosses below Hull 200
Small arrows appear on the chart for visual confirmation.
🔹 5. Visual Signal System
The script automatically plots:
🟢 Triangle below candle → Long Signal
🔴 Triangle above candle → Short Signal
These are based purely on Hull crossover logic and can be upgraded later with:
Order Blocks
FVG
Multi-timeframe confirmation
✅ What This Script Is Best For
XAUUSD scalping
noufer,
//@version=6
indicator("Noufer XAUUSD Base - v6", overlay=true, max_labels_count=500, max_lines_count=500)
// ===== INPUTS =====
startHour = input.int(1, "Session Start Hour")
startMin = input.int(0, "Session Start Minute")
endHour = input.int(23, "Session End Hour")
endMin = input.int(0, "Session End Minute")
volLen = input.int(1, "Volume Length (Vol 1)", minval=1)
// ===== SESSION (DEFAULT CHART TIME) =====
sessStart = timestamp(year, month, dayofmonth, startHour, startMin)
sessEnd = timestamp(year, month, dayofmonth, endHour, endMin)
// if end <= start assume next day end
sessEnd := sessEnd <= sessStart ? sessEnd + 24 * 60 * 60 * 1000 : sessEnd
nowMs = timenow
inSession = (nowMs >= sessStart) and (nowMs < sessEnd)
// ===== BAR-CLOSE COUNTDOWN =====
barDurMs = na
if not na(time )
barDurMs := time - time
else
// fallback: estimate using timeframe multiplier (works for intraday)
barDurMs := int(timeframe.multiplier) * 60 * 1000
secsLeftBar = math.max(0, ((time + barDurMs) - nowMs) / 1000)
hrsB = math.floor(secsLeftBar / 3600)
minsB = math.floor((secsLeftBar % 3600) / 60)
secsB = math.floor(secsLeftBar % 60)
barCountdown = str.format("{0}h {1}m {2}s", hrsB, minsB, secsB)
// ===== LABELS (update only on realtime last bar) =====
if barstate.islast
var label sessLabel = na
sessTxt = inSession ? "SESSION OPEN" : "SESSION CLOSED"
if na(sessLabel)
sessLabel := label.new(bar_index, high * 1.002, sessTxt, xloc.bar_index, yloc.abovebar, style=label.style_label_left, color=inSession ? color.green : color.red, textcolor=color.white, size=size.small)
else
label.set_xy(sessLabel, bar_index, high * 1.002)
label.set_text(sessLabel, sessTxt)
label.set_color(sessLabel, inSession ? color.green : color.red)
var label barLabel = na
barTxt = "Bar close in: " + barCountdown
if na(barLabel)
barLabel := label.new(bar_index, low * 0.998, barTxt, xloc.bar_index, yloc.belowbar, style=label.style_label_right, color=color.new(color.blue, 0), textcolor=color.white, size=size.small)
else
label.set_xy(barLabel, bar_index, low * 0.998)
label.set_text(barLabel, barTxt)
// ===== VOLUME (Vol 1) =====
volPlot = ta.sma(volume, volLen)
plot(volPlot, title="Volume 1 (SMA)", style=plot.style_columns)
// ===== HULL MOVING AVERAGE =====
hull(src, len) =>
wma_half = ta.wma(src, len / 2)
wma_full = ta.wma(src, len)
diff = 2 * wma_half - wma_full
ta.wma(diff, math.round(math.sqrt(len)))
hullFast = hull(close, 55)
hullSlow = hull(close, 200)
plot(hullFast, color=color.orange, linewidth=2, title="Hull 55")
plot(hullSlow, color=color.blue, linewidth=2, title="Hull 200")
// ===== SIMPLE SIGNALS (example) =====
longSignal = ta.crossover(hullSlow, hullFast)
shortSignal = ta.crossunder(hullSlow, hullFast)
plotshape(longSignal, style=shape.triangleup, location=location.belowbar, color=color.green, size=size.tiny, title="Long")
plotshape(shortSignal, style=shape.triangledown, location=location.abovebar, color=color.red, size=size.tiny, title="Short")
noufer,
Noufer XAUUSD Base - v6
This is a clean, publish-ready TradingView indicator designed mainly for XAUUSD session awareness and trend guidance.
🔹 1. Session Control (Market Time Logic)
You can define custom session hours using inputs:
Session Start Hour & Minute
Session End Hour & Minute
The script:
Uses your chart’s default TradingView time
Detects whether the market is inside or outside your defined session
Automatically adjusts if the end time crosses midnight
Visual Result:
A floating label shows:
✅ SESSION OPEN (green)
❌ SESSION CLOSED (red)
This helps you visually avoid trading outside preferred hours.
🔹 2. Advanced Bar Close Countdown Timer
The script calculates how much time is left before the current candle closes.
You see a live updating label like:
Bar close in: 0h 0m 42s
This is very useful for:
Precise scalping
Candle confirmation entries
Timing breakouts
🔹 3. Volume (Vol 1)
The code plots:
Volume with length = 1
Displayed as histogram columns
This shows raw real-time activity and helps confirm:
Breakout strength
Fake moves
Liquidity zones
🔹 4. Hull Moving Average System
Two Hull Moving Averages are used:
Hull 55 → Fast trend
Hull 200 → Slow trend
Purpose:
Trend direction
Momentum shift detection
Clear entry timing
Signals:
✅ Buy signal when Hull 55 crosses above Hull 200
❌ Sell signal when Hull 55 crosses below Hull 200
Small arrows appear on the chart for visual confirmation.
🔹 5. Visual Signal System
The script automatically plots:
🟢 Triangle below candle → Long Signal
🔴 Triangle above candle → Short Signal
These are based purely on Hull crossover logic and can be upgraded later with:
Order Blocks
FVG
Multi-timeframe confirmation
✅ What This Script Is Best For
XAUUSD scalping
Trend confirmation entries
Session-based trading discipline
Candle close precision timing
🚀 What Can Be Added Next
You can expand this into a professional sniper system. Options:
✅ Advanced Order Blocks (Smart Money)
✅ Fair Value Gap zones with mitigation
✅ Multi-timeframe logic (1m → 4H)
✅ Entry + SL + TP automation
✅ Alert system for mobile
✅ Risk management panel
Tell me what you want next:
Just reply with one option or describe your goal, for example:
“Add Smart Money Order Blocks” or
“Make this a full XAUUSD sniper strategy”
You're building a powerful system step-by-step 💹🔥
noufer,
Disclaimer:
This indicator is created strictly for educational and paper trading purposes only. It is not intended as financial advice or a guaranteed trading system. Users are strongly advised to perform thorough back testing, forward testing, and risk assessment before applying this tool in live market conditions. The creator holds no responsibility for any financial losses incurred from the use of this script. Trade at your own risk.

Multi-Timeframe TTM Squeeze Pro with alerts and screenersBased of John Carters TTM Squeeze. Must open the settings and select wether you want to match the timeframe in your chart. This must be done in the pinescreener as well otherwise results will not be correct.
---
# **Squeeze Momentum Pro – Enhanced Screener + EMA Cross Alerts**
This custom version of the Squeeze Momentum indicator expands the standard TTM-style squeeze with screening and automated alert logic so you can quickly find high-quality setups across many tickers.
---
## **What This Script Does**
This indicator plots a three-level squeeze visual similar to TTM Squeeze:
Dot meanings in this indicator
Orange dot:
Strongest squeeze – Bollinger Bands are inside the tightest Keltner level (highest volatility compression).
Red dot:
Medium squeeze – still compressed, but not as tight as orange.
Black dot:
Weak squeeze / lowest level of volatility compression.
Price is coiling, but not as tight as the higher levels.
Green dot (“Fired”):
Squeeze has released — Bollinger Bands have expanded out of the channels and momentum is moving.
A momentum histogram is plotted to show directional pressure during the squeeze.
---
## **Major Improvements Added**
### **① Screenable Conditions for Stock Scanners**
This version includes multiple `alertcondition()` flags so the script can be used as a **Pine Screener inside TradingView**.
Currently it can screen for:
✔ Price closing above the 50-SMA
✔ Presence of an **orange (strong) squeeze dot**
✔ 6/20 EMA crossover signals inside a squeeze
These can be used inside the TradingView Screener or in watchlists to automatically highlight qualifying tickers.
---
### **② 6/20 EMA Trend Signals (Filtered by Squeeze)**
A crossover system was added:
* **Bullish Signal:** 6 EMA crosses above 20 EMA
* **Bearish Signal:** 6 EMA crosses below 20 EMA
But **these signals only trigger if the market is in a red or orange squeeze**, which helps remove noise and focus on valid setups.
---
### **③ Visual Markers Under the Histogram**
Whenever an EMA crossover occurs during a squeeze:
* A **green up-triangle** is plotted for a bullish cross
* A **red down-triangle** for a bearish cross
These markers are drawn **below the histogram**, keeping the display clean while still providing quick visual cues.
---
### **④ Fully Non-Repainting Logic**
All signals and squeeze calculations are based on standard fully-resolved `ta.*` functions, making the results stable both in backtesting and real-time.
---
## **Who This Script Helps**
This version is ideal for:
* Traders who use TradingView’s screener and want automated breakout/continuation filtering
* Traders who scan large watchlists for squeeze setups
* Users who want trend confirmation during volatility compression
---
## **How to Use It**
1. Add the script to your chart
2. Open TradingView Alerts or Screener
3. Select the conditions you want, for example:
* *“Orange Squeeze Detected”*
* *“Squeeze Fire after 3 squeeze dots*
* *“4 REd Dots in a row.”*
* *“Buy Alert”*
* *“EMA 6/20 Bullish Crossover (Squeeze Only)”*
* *“Close Above 50 SMA”*
Once active, TradingView will automatically flag symbols that meet the criteria.
---
## **Summary**
This enhanced Squeeze Momentum indicator turns the standard TTM-style visual into a **true screening and alert system** by adding:
* Multi-level squeezes
* EMA trend signals
* Screener-compatible alert conditions
* Clean visual signals
* Non-repainting logic
It helps traders quickly locate high-probability setups across any watchlist or market.

Scout Regiment - D17# Scout Regiment - D17 Indicator
## English Documentation
### Overview
Scout Regiment - D17 is a comprehensive TradingView indicator that combines multiple technical analysis tools into one powerful overlay indicator. It provides traders with market structure analysis, divergence detection, volume profiling, smart money concepts, and session analysis.
### Key Features
#### 1. **EMA (Exponential Moving Averages)**
- **Purpose**: Trend identification and dynamic support/resistance levels
- **Configuration**: 13 customizable EMAs with adjustable periods
- **Default Active EMAs**: EMA 3 (21), EMA 5 (55), EMA 7 (144), EMA 8 (233)
- **Uses**: Identify trend direction, entry/exit points, and trend strength
- **Color Coding**: Different colors for easy visual distinction
#### 2. **TFMA (Timeframe Moving Averages)**
- **Purpose**: Multi-timeframe trend analysis
- **Features**:
- 3 EMAs on higher timeframes
- Dynamic labels showing trend direction
- Price difference percentage display
- Customizable timeframe settings
- **Default Settings**: 21-period timeframe with lengths 55, 144, and 233
- **Benefits**: Align trades with higher timeframe trends
#### 3. **DFMA (Daily Frame Moving Averages)**
- **Purpose**: Daily timeframe perspective on any chart
- **Features**: Similar to TFMA but specifically for daily analysis
- **Default Timeframe**: 1D (Daily)
- **Use Case**: Long-term trend confirmation and positioning
#### 4. **PMA (Price Moving Averages)**
- **Purpose**: Price channel analysis with filled areas
- **Configuration**: 7 customizable moving averages with fill zones
- **Default Lengths**: 12, 144, 169, 288, 338, 576, 676
- **Visual**: Color-filled zones between selected MAs for channel trading
#### 5. **VWAP (Volume Weighted Average Price)**
- **Purpose**: Institutional trading levels and fair value
- **Features**:
- Multiple anchor periods (Session, Week, Month, Quarter, Year, etc.)
- Standard deviation bands
- Corporate event anchoring (Earnings, Dividends, Splits)
- **Use Case**: Identify institutional support/resistance and mean reversion opportunities
#### 6. **Divergence Detector**
- **Purpose**: Identify potential trend reversals
- **Supported Indicators**: MACD, MACD Histogram, RSI, Stochastic, CCI, Williams %R, Bias, Momentum, OBV, SOBV, VWmacd, CMF, MFI, and external indicators
- **Divergence Types**:
- Regular Bullish/Bearish
- Hidden Bullish/Bearish
- **Features**:
- Automatic divergence line drawing
- Customizable detection parameters
- Color-coded alerts
#### 7. **Volume Profile & Node Detection**
- **Purpose**: Identify key price levels based on volume distribution
- **Features**:
- Volume Profile with POC (Point of Control)
- Value Area High (VAH) and Value Area Low (VAL)
- Peak and trough volume node detection
- Highest/lowest volume node highlighting
- **Lookback**: Configurable (default 377 bars)
- **Use Case**: Identify support/resistance zones and liquidity areas
#### 8. **Smart Money Concepts**
- **Purpose**: Track institutional trading patterns
- **Features**:
- Market Structure (BOS - Break of Structure, CHoCH - Change of Character)
- Internal and Swing structures
- Strong/Weak Highs and Lows
- Equal Highs/Lows detection
- Fair Value Gaps (FVG)
- **Modes**: Historical or Present (latest only)
- **Use Case**: Trade with institutional flow
#### 9. **Trading Sessions**
- **Purpose**: Analyze market behavior during different global sessions
- **Available Sessions**:
- Asian Session
- Sydney, Tokyo, Shanghai, Hong Kong
- European Session
- London, New York, NYSE
- **Features**:
- Session boxes with high/low visualization
- Real-time countdown timers
- Volume and price change tracking
- Information table with session statistics
- **Customization**: Choose which sessions to display, colors, and box styles
### How to Use
#### For Trend Following:
1. Enable EMAs 3, 5, 7, and 8
2. Use TFMA for higher timeframe confirmation
3. Look for price above/below key EMAs for trend direction
4. Use VWAP as additional confirmation
#### For Reversal Trading:
1. Enable Divergence Detector with MACD Histogram and Bias
2. Look for divergences at key support/resistance levels
3. Confirm with Smart Money CHoCH signals
4. Use Volume Profile nodes as entry/exit targets
#### For Intraday Trading:
1. Enable Trading Sessions
2. Focus on high-volume sessions (London, New York overlap)
3. Use session highs/lows as support/resistance
4. Trade Fair Value Gaps during active sessions
#### For Swing Trading:
1. Use DFMA for daily trend
2. Enable PMA for channel identification
3. Look for price reactions at volume profile value areas
4. Confirm with swing structure breaks
### Best Practices
1. **Don't Overcrowd**: Enable only the components you need for your strategy
2. **Multi-Timeframe Analysis**: Always check higher timeframe TFMA/DFMA
3. **Confluence**: Look for multiple signals confirming the same direction
4. **Volume Confirmation**: Use Volume Profile to validate price action
5. **Session Awareness**: Be aware of which session is active for volatility expectations
### Performance Optimization
- Disable unused features to improve chart loading speed
- Use "Present Mode" for Smart Money Concepts if historical data isn't needed
- Reduce Volume Profile lookback period on slower devices
### Alerts
The indicator includes alert conditions for:
- All divergence types (8 conditions)
- Smart Money structure breaks (8 conditions)
- Equal highs/lows detection
- Fair Value Gaps formation
---
## 中文说明文档
### 概述
Scout Regiment - D17 是一款综合性TradingView指标,将多个技术分析工具整合到一个强大的叠加指标中。它为交易者提供市场结构分析、背离检测、成交量分析、聪明钱概念和时区分析。
### 核心功能
#### 1. **EMA(指数移动平均线)**
- **用途**:趋势识别和动态支撑阻力位
- **配置**:13条可自定义周期的EMA
- **默认启用**:EMA 3(21)、EMA 5(55)、EMA 7(144)、EMA 8(233)
- **应用**:识别趋势方向、进出场点位和趋势强度
- **颜色编码**:不同颜色便于视觉区分
#### 2. **TFMA(时间框架移动平均线)**
- **用途**:多时间框架趋势分析
- **特点**:
- 3条更高时间框架的EMA
- 显示趋势方向的动态标签
- 价格差异百分比显示
- 可自定义时间框架设置
- **默认设置**:21周期时间框架,长度为55、144和233
- **优势**:使交易与更高时间框架趋势保持一致
#### 3. **DFMA(日线框架移动平均线)**
- **用途**:在任何图表上提供日线时间框架视角
- **特点**:与TFMA类似,但专门用于日线分析
- **默认时间框架**:1D(日线)
- **使用场景**:长期趋势确认和定位
#### 4. **PMA(价格移动平均线)**
- **用途**:价格通道分析与填充区域
- **配置**:7条可自定义的移动平均线,带填充区域
- **默认长度**:12、144、169、288、338、576、676
- **视觉效果**:选定MA之间的彩色填充区域,用于通道交易
#### 5. **VWAP(成交量加权平均价格)**
- **用途**:机构交易水平和公允价值
- **特点**:
- 多个锚定周期(交易日、周、月、季度、年等)
- 标准差波段
- 企业事件锚定(财报、分红、拆股)
- **使用场景**:识别机构支撑阻力和均值回归机会
#### 6. **背离检测器**
- **用途**:识别潜在趋势反转
- **支持指标**:MACD、MACD柱状图、RSI、随机指标、CCI、威廉指标、乖离率、动量、OBV、SOBV、VWmacd、CMF、MFI及外部指标
- **背离类型**:
- 常规看涨/看跌背离
- 隐藏看涨/看跌背离
- **特点**:
- 自动绘制背离连线
- 可自定义检测参数
- 颜色编码警报
#### 7. **成交量分布与节点检测**
- **用途**:基于成交量分布识别关键价格水平
- **特点**:
- 成交量分布图与POC(控制点)
- 价值区域高点(VAH)和低点(VAL)
- 峰值和低谷成交量节点检测
- 最高/最低成交量节点突出显示
- **回溯期**:可配置(默认377根K线)
- **使用场景**:识别支撑阻力区域和流动性区域
#### 8. **聪明钱概念**
- **用途**:追踪机构交易模式
- **特点**:
- 市场结构(BOS-突破结构、CHoCH-结构转变)
- 内部和摆动结构
- 强/弱高低点
- 等高/等低检测
- 公允价值缺口(FVG)
- **模式**:历史模式或当前模式(仅最新)
- **使用场景**:跟随机构资金流动交易
#### 9. **交易时区**
- **用途**:分析不同全球时段的市场行为
- **可用时段**:
- 亚洲时段
- 悉尼、东京、上海、香港
- 欧洲时段
- 伦敦、纽约、纽交所
- **特点**:
- 时段方框显示高低点
- 实时倒计时
- 成交量和价格变化追踪
- 时段统计信息表格
- **自定义**:选择显示哪些时段、颜色和方框样式
### 使用方法
#### 趋势跟随策略:
1. 启用EMA 3、5、7和8
2. 使用TFMA进行更高时间框架确认
3. 观察价格在关键EMA上方/下方确定趋势方向
4. 使用VWAP作为额外确认
#### 反转交易策略:
1. 启用背离检测器(MACD柱状图和乖离率)
2. 在关键支撑阻力位寻找背离
3. 用聪明钱CHoCH信号确认
4. 使用成交量分布节点作为进出场目标
#### 日内交易策略:
1. 启用交易时区
2. 关注高成交量时段(伦敦、纽约重叠时段)
3. 使用时段高低点作为支撑阻力
4. 在活跃时段交易公允价值缺口
#### 波段交易策略:
1. 使用DFMA确定日线趋势
2. 启用PMA识别通道
3. 观察价格在成交量分布价值区域的反应
4. 用摆动结构突破确认
### 最佳实践
1. **避免过度拥挤**:仅启用策略所需的组件
2. **多时间框架分析**:始终检查更高时间框架的TFMA/DFMA
3. **汇合点**:寻找多个信号确认同一方向
4. **成交量确认**:使用成交量分布验证价格行为
5. **时段意识**:了解当前活跃时段以预期波动性
### 性能优化
- 禁用未使用的功能以提高图表加载速度
- 如果不需要历史数据,对聪明钱概念使用"当前模式"
- 在较慢设备上减少成交量分布回溯期
### 警报
指标包含以下警报条件:
- 所有背离类型(8个条件)
- 聪明钱结构突破(8个条件)
- 等高/等低检测
- 公允价值缺口形成
---
## Technical Support
For questions or issues, please refer to the TradingView community or contact the indicator creator.
## 技术支持
如有问题,请参考TradingView社区或联系指标创建者。

HTF Candles Pro by MurshidFx# HTF Candles Pro by MurshidFx
## Professional Trading Indicator for Multi-Timeframe Market Structure Analysis
**HTF Candles Pro** is an advanced, open-source trading indicator that synthesizes Higher Timeframe (HTF) candle visualization with CISD (Change in State of Delivery) detection, providing comprehensive market structure analysis across multiple timeframes. Designed for traders at all experience levels—from scalpers to swing traders—this tool enables precise alignment of trades with higher timeframe momentum while identifying critical market structure transitions.
---
## Core Functionality
This indicator integrates three essential analytical frameworks:
- **HTF Candle Visualization** – Inspired by the innovative work of Fadi x MMT's MTF Candles indicator
- **CISD Detection System** – Algorithmic identification of significant market structure reversals
- **Intelligent Session Level Management** – Automated consolidation of overlapping session markers for enhanced chart clarity
The result is a sophisticated yet streamlined analytical tool that delivers actionable market insights with minimal visual complexity.
---
## Feature Set
### Higher Timeframe Candle Analysis
Monitor higher timeframe price action seamlessly without chart switching. The indicator employs automatic HTF selection based on current timeframe, with manual override capability.
**Components:**
- **Primary HTF Display**: Automatically positioned adjacent to current price action
- **Secondary HTF Display**: Optional dual-timeframe analysis capability
- **Adaptive Time Labeling**: Context-aware formatting (intraday times, day names, week numbers)
- **Real-Time Countdown**: Optional timer displaying remaining time until HTF candle close
- **Customizable Color Schemes**: Full color customization for bullish and bearish candles
### CISD Detection (Change in State of Delivery)
The CISD system identifies critical inflection points where market structure undergoes directional change, signaling potential trend reversals or continuations.
**Mechanism:**
- **Market Structure Monitoring**: Continuous tracking of swing highs and lows
- **Liquidity Sweep Detection**: Identification of stop-hunt patterns preceding reversals
- **Reversal Confirmation**: Validation-based CISD level plotting upon structure break confirmation
- **Clear Visual Signals**: Bullish CISD (blue) and bearish CISD (red) demarcation
- **Optimized Display**: Default 5-bar line length (adjustable) minimizes chart clutter
**Technical Definition:**
CISD occurs when price breaches structure in one direction—typically sweeping liquidity and triggering stops—then reverses to break structure in the opposite direction, indicating a fundamental shift in market delivery bias.
### Intelligent Session Level Management
Eliminates visual clutter caused by overlapping session opens at identical price levels through automated consolidation.
**Functionality:**
- **Automatic Consolidation**: Merges multiple concurrent session opens into single reference lines
- **Combined Labeling**: Creates unified labels (e.g., "Week-Day Open," "4H-Day-Week Open")
- **Enhanced Clarity**: Maintains professional chart aesthetics while preserving all relevant information
**Supported Session Intervals:**
- 30-Minute Opens
- 4-Hour Opens
- Daily Opens
- Weekly Opens
- Monthly Opens
### Advanced Market Structure Tools
**Liquidity Sweep Identification:**
Highlights price wicks extending beyond previous HTF extremes that close within range—characteristic liquidity grab patterns.
**HTF Midpoint Reference:**
Displays the 50% retracement level of the most recent completed HTF candle, serving as a key reference for entries and profit targets.
**HTF Opening Price:**
Tracks current HTF candle open price, frequently functioning as dynamic support or resistance.
**Interval Demarcation:**
Visual separators defining HTF period boundaries for enhanced temporal clarity.
### Information Dashboard
Compact, customizable dashboard displaying:
- Current symbol and active timeframe
- HTF candle countdown timer
- Active trading session (Asia/London/New York)
- Current date and time
Flexible positioning: configurable for any chart corner.
---
## Default Configuration
Optimized settings for immediate professional-grade chart presentation:
- **Secondary HTF**: Disabled (enable for multi-timeframe comparative analysis)
- **CISD Bullish Color**: Blue (#0080ff) – optimal visibility with reduced eye strain
- **CISD Line Width**: 1 pixel – subtle yet discernible
- **CISD Line Length**: 5 bars – balanced visibility without excessive clutter
- **Session Opens**: Smart consolidation enabled – eliminates overlapping labels
---
## Application Strategies
### Trend Following
1. Monitor CISD confirmations aligned with HTF trend direction
2. Utilize HTF candle color for directional bias confirmation
3. Execute entries on pullbacks to HTF midpoint or open price levels
### Reversal Trading
1. Identify counter-trend CISD formations
2. Await HTF candle close confirming new directional bias
3. Use session opens as secondary confirmation levels
### Scalping
1. Trade exclusively in HTF candle direction
2. Employ lower timeframe CISD signals for precise entry timing
3. Target HTF midpoint or subsequent session open levels
### Structure-Based Trading
1. Mark liquidity sweep levels as potential reversal zones
2. Monitor CISD formations at key session opens
3. Confirm trend changes via HTF candle closes
---
## Customization Parameters
Comprehensive customization options:
- **Color Schemes**: Independent control of bull/bear candles, borders, CISD signals, session levels
- **Dimensional Settings**: Candle width, line thickness, label sizing
- **Display Quantities**: HTF candle count (1-10 range)
- **Positioning**: Candle offset, dashboard placement, label positioning
- **Line Styles**: Solid, dashed, or dotted rendering
- **Timeframe Selection**: Manual secondary HTF specification
---
## Attribution
**HTF Candle Visualization:**
The HTF candle rendering methodology draws inspiration from Fadi x MMT's "MTF Candles" indicator. Their elegant implementation of multi-timeframe candle visualization provided valuable reference for this development. Recognition and appreciation to their contribution to the TradingView community.
**CISD Detection:**
Proprietary CISD detection algorithm engineered to identify market structure transitions with high signal clarity and reduced false positive rate.
**Session Level Consolidation:**
Custom-developed intelligent grouping system addressing the common challenge of overlapping session labels at coincident price levels.
---
## Open Source License
This indicator is released as open source for the TradingView community. Permitted uses include:
- Implementation in live trading
- Educational study for Pine Script learning
- Personal modification and customization
- Distribution among trading communities
Community contributions, improvements, and derivative works are welcomed and encouraged.
---
## Implementation Guide
1. **Installation**: Click "Add to Chart"
2. **Configuration Access**: Open indicator settings panel
3. **Initial Use**: Default settings provide optimal starting configuration
4. **Optional Features**: Enable secondary HTF for multi-timeframe analysis
5. **Theme Integration**: Adjust color schemes to match chart aesthetics
---
## Best Practices
**Timeframe Optimization:**
- 1-5 minute charts: Optimal with 15m or 1H HTF
- 15-30 minute charts: Effective with 4H HTF
- 1-4 hour charts: Suitable for Daily HTF
- Daily charts: Best utilized with Weekly/Monthly HTF
**CISD Trading Guidelines:**
- Require CISD confirmation before position entry
- Prioritize CISD signals at significant levels (session opens, HTF midpoints)
- Confirm CISD direction aligns with HTF candle bias
- Apply contextual filtering—not all CISD signals warrant trades
**Session Open Strategy:**
- Weekly opens typically provide robust support/resistance
- Daily opens offer reliable intraday reference points
- 4-Hour opens effective for short-term scalping
- Consolidated labels (e.g., "Week-Day Open") indicate confluence zones with elevated significance
---
## Technical Specifications
**Performance Optimization:**
- Intelligent object management prevents TradingView rendering limits
- Efficient array processing for session consolidation
- Proper memory management through systematic object deletion
- Consistent performance across all timeframe ranges
**Compatibility:**
- Universal timeframe support
- Optimized for all market types (forex, stocks, crypto, futures)
- Minimal computational overhead
---
## Support & Development
**Feedback Channels:**
- Comment section for user feedback and suggestions
- Bug reports and feature requests welcomed
- Community-driven enhancement consideration
**Documentation:**
- Well-commented source code for learning purposes
- Clear section organization for easy navigation
- Comprehensive type definitions for structural clarity
- Educational value for market structure concept understanding
---
## Version Information
**Version:** 1.0 (Initial Release)
**License:** Open Source
**Category:** Multi-Timeframe Analysis | Market Structure
**Compatibility:** All Timeframes
**Language:** Pine Script v5
---
**For optimal results:**
- Provide feedback through comments
- Share with trading communities
- Submit enhancement suggestions
- Report technical issues for resolution
**Professional Support:**
Available through comment section for technical inquiries, implementation questions, and feature requests.
---
*Developed for the TradingView trading community | Professional-grade market structure analysis | Open source contribution*

Ross Cameron 5 Pillars FilterFirst, I am not Ross Cameron. This indicator is based on his five pillars of stock selection.
ROSS CAMERON 5 PILLARS MOMENTUM FILTER
🎯 OVERVIEW
This indicator automatically checks if the current symbol meets Ross Cameron's famous "5 Pillars" stock selection criteria from Warrior Trading - a proven methodology for identifying high-probability momentum day trading setups.
📊 ROSS CAMERON'S 5 PILLARS
1️⃣ RELATIVE VOLUME ≥5x (Automated ✅)
• Compares current volume to 30-day average
• Minimum 5x confirms institutional/retail interest
• High RVol = high liquidity and momentum potential
2️⃣ DAILY % CHANGE ≥10% (Automated ✅)
• Stock must already be showing momentum
• Default threshold: 10% up from previous close
• Confirms demand is already present
3️⃣ NEWS CATALYST (Manual Check ⚠️)
• Breaking news justifies the price movement
• Look for: earnings, FDA approvals, partnerships, contracts
• 🔥 icon flags stocks with ≥15% momentum (likely news-driven)
4️⃣ PRICE RANGE $1-$20 (Automated ✅)
• Sweet spot for retail trader momentum
• Highly volatile small-cap stocks
• Accessible price range for position building
5️⃣ FLOAT <10 MILLION SHARES (Automated ✅)
• Low float creates supply/demand imbalances
• Enables explosive 50-100%+ intraday moves
• Automatically checked when data available
• Shows actual float with ✅/❌ indicator
🚀 KEY FEATURES
✅ GREEN BACKGROUND HIGHLIGHT
• Visual alert when ALL automated criteria are met
• Instantly identify potential setups while scanning watchlist
📋 DETAILED BREAKDOWN TABLE
• Shows pass/fail status for each pillar
• Displays actual values (RVol, %, Float, etc.)
• Color-coded for quick interpretation
🔥 STRONG MOMENTUM INDICATOR
• Highlights stocks ≥15% (likely have news catalyst)
• Helps prioritize which stocks to research first
🔔 BUILT-IN ALERTS
• "Ross Cameron Criteria Met" - All automated criteria pass
• "Strong Momentum Alert" - Stock showing explosive movement
⚙️ FULLY CUSTOMIZABLE
• Adjust all thresholds to your trading style
• Configurable table position and display
• Toggle volume spike filter on/off
💡 HOW TO USE
BEST WORKFLOW:
1. Build a watchlist of small-cap stocks using TradingView's Stock Screener
2. Add this indicator to your charts
3. Flip through your watchlist - look for GREEN BACKGROUNDS
4. Check the table for detailed breakdown of each pillar
5. VERIFY NEWS CATALYST (required for Pillar 3)
6. If float shows N/A, verify manually on Finviz
7. Execute your trading plan with proper risk management
OPTIMAL TIMING:
• Pre-Market (8:00-9:30 AM ET) - Identify gap-up candidates
• Morning Session (9:30 AM-12:00 PM ET) - Prime momentum window
• Avoid lunch hour (12:00-2:00 PM ET) - Low volume, choppy
ALERT SETUP:
1. Click "Create Alert" on your chart
2. Select "Ross Cameron Criteria Met" condition
3. Get notified when new setups appear real-time
⚙️ CUSTOMIZABLE SETTINGS
PILLAR 1 - RELATIVE VOLUME:
• Min RVol: 5.0x (Ross's minimum, increase for more selective)
• RVol Period: 30 days (industry standard)
PILLAR 2 - MOMENTUM:
• Min Daily %: 10% (increase to 15% for stronger setups)
PILLAR 3 - CATALYST:
• Strong Momentum %: 15% (threshold for 🔥 indicator)
PILLAR 4 - PRICE RANGE:
• Min Price: $1.00 (adjust based on account size)
• Max Price: $20.00 (Ross's sweet spot)
PILLAR 5 - FLOAT:
• Max Float: 10M shares (ultra-aggressive traders use 5M)
ADDITIONAL FILTERS:
• Volume Spike: 2x (Warrior Trading standard)
• Confirms intraday momentum continuation
📈 INTERPRETATION GUIDE
✅ GREEN BACKGROUND = GO!
• All automated criteria are met
• Check news catalyst before trading
• Verify setup on chart (not overextended)
• Follow your risk management plan
❌ NO GREEN BACKGROUND = WAIT
• At least one criterion failed
• Check table to see which pillar(s) failed
• May become valid later if momentum increases
🔥 FLAME ICON = HIGH PRIORITY
• Stock showing very strong momentum (≥15%)
• Likely has significant news catalyst
• Research news IMMEDIATELY
• Often the best setups of the day
⚠️ N/A FOR FLOAT = MANUAL CHECK
• TradingView doesn't have float data for this symbol
• Verify on Finviz.com or similar
• If float >10M, setup is invalid per Ross's criteria
📚 RECOMMENDED STRATEGIES
GAP AND GO:
• Stock gaps up 10%+ on news
• Enters above gap high with volume
• Targets: 20-50% gains
VWAP BOUNCE:
• Pullback to VWAP support
• Enters on bounce with volume confirmation
• Tight stop below VWAP
HIGH OF DAY BREAKOUT:
• New HOD with volume surge
• Momentum continuation play
• Trail stop as it runs
ABCD PATTERN:
• Classic reversal pattern
• Enters on D-point breakout
• Target: A-B distance from C
⚠️ RISK WARNINGS
• DAY TRADING IS HIGHLY RISKY - Most day traders lose money
• This indicator finds setups - YOUR EXECUTION determines success
• Always use proper risk management (1-2% risk per trade)
• Never trade without stop losses
• Paper trade extensively before using real money
• Past performance does not guarantee future results
🔧 TECHNICAL DETAILS
• Pine Script v6
• Works on any timeframe (calculates daily metrics automatically)
• Compatible with TradingView Free, Pro, Premium
• No repainting - all calculations based on confirmed data
• Efficient code - minimal lag
📊 DATA SOURCES
• Relative Volume: Calculated from 30-day volume average
• Daily %: Previous day's close vs current price
• Float: TradingView's shares_outstanding_float data
• Volume Spike: 20-period volume moving average
🎯 WHO THIS IS FOR
IDEAL FOR:
✅ Day traders focused on momentum strategies
✅ Traders who follow Ross Cameron/Warrior Trading methodology
✅ Small-cap stock traders ($1-$20 range)
✅ Scalpers and swing traders seeking high-volatility setups
NOT IDEAL FOR:
❌ Long-term investors
❌ Large-cap stock traders
❌ Options-only traders
❌ Traders who don't monitor news catalysts
💬 USAGE TIPS
1. COMBINE WITH OTHER TOOLS
• Use alongside your charting/technical analysis
• Verify pattern setups (bull flags, ABCD, etc.)
• Check Level 2 / Time & Sales for confirmation
2. MAINTAIN A WATCHLIST
• Update daily with fresh small-cap movers
• Use Finviz Gap Scanner as starting point
• Focus on sectors with momentum
3. RISK MANAGEMENT IS KEY
• Never risk more than 1-2% per trade
• Use 2:1 minimum profit/loss ratio
• Cut losses quickly, let winners run
• Position size based on volatility (ATR)
4. TRACK YOUR RESULTS
• Keep a trading journal
• Note which setups work best for you
• Refine criteria based on your data
• Continuous improvement mindset
📝 DISCLAIMER
This indicator is for EDUCATIONAL PURPOSES ONLY. It is not investment advice, a recommendation to buy/sell securities, or a guarantee of profits. Trading involves substantial risk of loss. Always:
• Conduct your own research and due diligence
• Consult with a licensed financial advisor
• Never risk money you cannot afford to lose
• Understand that most day traders lose money
• Practice in a simulator before trading real money
The creator of this indicator is not affiliated with Ross Cameron or Warrior Trading. This is an independent implementation of publicly available trading methodology.
📈 SUPPORT & FEEDBACK
If you find this indicator helpful, please:
• Give it a thumbs up 👍
• Leave a comment with your experience
• Share with other momentum traders
• Follow for updates and new indicators
For questions or suggestions, leave a comment below!
---
🏆 HAPPY TRADING! Remember: The indicator finds opportunities, but YOUR discipline, risk management, and execution determine your success.
#DayTrading #Momentum #RossCameron #WarriorTrading #SmallCaps #GapAndGo #Scalping #StockScreener

Multi-Symbol EMA Crossover Scanner with Multi-Timeframe AnalysisDescription
What This Indicator Does:
This indicator is a comprehensive market scanner that monitors up to 10 symbols simultaneously across 4 different timeframes (15-minute, 1-hour, 4-hour, and daily) to detect exponential moving average (EMA) crossovers in real-time. Instead of manually checking multiple charts and timeframes for EMA crossover signals, this scanner automatically does the work for you and presents all detected signals in a clean, organized table that updates continuously throughout the trading session.
Key Features:
Multi-Symbol Monitoring: Scan up to 10 different symbols at once (stocks, forex, crypto, or any TradingView symbol)
Multi-Timeframe Analysis: Simultaneously tracks 4 timeframes (15m, 1H, 4H, 1D) with toggle options to enable/disable each
Comprehensive EMA Pairs: Detects crossovers between all major EMA combinations: 20×50, 20×100, 20×200, 50×100, 50×200, and 100×200
Real-Time Signal Feed: Displays the most recent signals in a sorted table (newest first) with timestamp, direction, price, and EMA pair information
Session Filter: Built-in time filter (default 10:00-18:00) to focus on specific trading hours and avoid pre-market/after-hours noise
Pagination System: Navigate through signals using a page selector when you have more signals than fit in one view
Signal Statistics: Footer displays total signals, bullish/bearish breakdown, and page navigation hints
Customizable Display: Choose table position (4 corners), signals per page (5-20), and maximum signal history (10-100)
How It Works:
The scanner uses the request.security() function to fetch EMA data from multiple symbols and timeframes simultaneously. For each symbol-timeframe combination, it calculates four exponential moving averages (20, 50, 100, and 200 periods) and monitors for crossovers:
Bullish Crossovers (▲ Green):
Faster EMA crosses above slower EMA
Indicates potential upward momentum
Common entry signals for long positions
Bearish Crossovers (▼ Red):
Faster EMA crosses below slower EMA
Indicates potential downward momentum
Common entry signals for short positions or exits
The scanner prioritizes crossovers involving faster EMAs (20×50) over slower ones (100×200), as faster crossovers typically generate more frequent signals. Each detected crossover is stored with its timestamp, allowing the scanner to sort signals chronologically and remove duplicates within the same timeframe.
Signal Table Columns:
Sym: Symbol name (abbreviated, e.g., "ASELS" instead of "BIST:ASELS")
TF: Timeframe where the crossover occurred (15m, 1h, 4h, 1D)
⏰: Exact time of the crossover (HH:MM format in Istanbul timezone)
↕: Direction indicator (▲ bullish green / ▼ bearish red)
₺: Price level where the crossover occurred (average of the two EMAs)
MA: Which EMA pair crossed (e.g., "20×50", "50×200")
How to Use:
For Day Traders:
Enable 15m and 1h timeframes
Monitor symbols from your watchlist
Use crossovers as entry timing signals in the direction of the larger trend
Adjust the time filter to match your trading session (e.g., market open to 2 hours before close)
For Swing Traders:
Enable 4h and 1D timeframes
Focus on 50×200 and 100×200 crossovers (golden/death crosses)
Look for multiple timeframe confluence (same symbol showing bullish crossovers on both 4h and 1D)
Use as a pre-market scanner to identify potential setups for the day
For Multi-Market Traders:
Mix symbols from different markets (stocks, forex, crypto)
Use the scanner to identify which markets are showing the most momentum
Track relative strength by comparing crossover frequency across symbols
Identify rotation opportunities when one asset shows bullish signals while another shows bearish
Setup Recommendations:
Default BIST (Turkish Stock Market) Setup:
The code comes pre-configured with 10 popular BIST stocks:
ASELS, EKGYO, THYAO, AKBNK, PGSUS, ASTOR, OTKAR, ALARK, ISCTR, BIMAS
For US Stocks:
Replace with symbols like: NASDAQ:AAPL, NASDAQ:TSLA, NASDAQ:NVDA, NYSE:JPM, etc.
For Forex:
Use pairs like: FX:EURUSD, FX:GBPUSD, FX:USDJPY, OANDA:XAUUSD, etc.
For Crypto:
Use exchanges like: BINANCE:BTCUSDT, COINBASE:ETHUSD, BINANCE:SOLUSDT, etc.
Settings Guide:
Symbol List (10 inputs):
Enter any valid TradingView symbol in "EXCHANGE:TICKER" format
Use symbols you actively trade or monitor
Mix different asset classes if desired
Timeframe Toggles:
15 Minutes: High-frequency signals, best for day trading
1 Hour: Balanced frequency, good for intraday swing trades
4 Hours: Lower frequency, quality swing trade signals
1 Day: Low frequency, major trend changes only
Time Filter:
Start Hour (10): Beginning of your trading session
End Hour (18): End of your trading session
Prevents signals during low-liquidity periods
Adjust to match your market's active hours
Display Settings:
Table Position: Choose corner placement (doesn't interfere with other indicators)
Max Signals (40): Total historical signals to keep in memory
Signals Per Page (10): How many rows to show at once
Page Number: Navigate through signal history (auto-adjusts to available pages)
What Makes This Original:
Multi-symbol scanners exist on TradingView, but this indicator's originality comes from:
Comprehensive EMA Pair Coverage: Most scanners focus on 1-2 EMA pairs, this monitors 6 different combinations simultaneously
Unified Multi-Timeframe View: Presents signals from 4 timeframes in a single, chronologically sorted feed rather than separate panels
Session-Aware Filtering: Built-in time filter prevents signal overload from 24-hour markets
Smart Pagination: Handles large signal volumes gracefully with page navigation instead of scrolling
Signal Deduplication: Prevents the same crossover from appearing multiple times if it persists across several bars
Price-at-Cross Recording: Captures the exact price where the crossover occurred, not just that it happened
Real-Time Statistics: Live tracking of bullish vs bearish signal distribution
Trading Strategy Examples:
Trend Confirmation Strategy:
Find a symbol showing bullish crossover on 1D (major trend change)
Wait for pullback
Enter when 1h shows bullish crossover (confirmation)
Exit when 1h shows bearish crossover
Multi-Timeframe Confluence:
Look for symbols appearing multiple times with same direction
Example: ASELS shows ▲ on both 4h and 1D = strong bullish signal
Avoid symbols showing conflicting signals (▲ on 1h but ▼ on 4h)
Rotation Scanner:
Monitor 10+ symbols from the same sector
Identify which are turning bullish (▲) first
Enter leaders, avoid laggards
Rotate out when crossovers turn bearish (▼)
Important Considerations:
Not a Complete System: EMA crossovers should be confirmed with price action, volume, and support/resistance analysis
Whipsaw Risk: During consolidation, EMAs can cross back and forth frequently (especially on 15m timeframe)
Lag: EMAs are lagging indicators; crossovers occur after the move has already begun
False Signals: More common during sideways markets; work best in trending environments
Symbol Limits: TradingView has limits on request.security() calls; this scanner uses 40 calls (10 symbols × 4 timeframes)
Performance: On lower-end devices, scanning 10 symbols across 4 timeframes may cause slight delays in chart updates
Best Practices:
Start with 5 symbols and 2 timeframes, then expand as you get comfortable
Use in conjunction with a main chart for price context
Don't trade every signal—filter for high-quality setups
Backtest your favorite EMA pairs on your symbols to understand their reliability
Adjust the time filter to exclude lunch hours if your market has low midday volume
Check the footer statistics—if you're getting 50+ signals per day, tighten your time filter or reduce symbols
Technical Notes:
Uses lookahead=barmerge.lookahead_off to prevent future data leakage
Signals are stored in arrays and sorted by timestamp (newest first)
Automatic daily reset clears old signals to prevent memory buildup
Table dynamically resizes based on signal count
All times displayed in Europe/Istanbul timezone (configurable in code)

Smart VWAP FVG SystemSmart VWAP FVG System - Professional Multi-Filter Trading Indicator
📊 OVERVIEW
The Smart VWAP FVG System is an advanced multi-layered trading indicator that combines institutional volume analysis, multi-timeframe VWAP trend confirmation, and Fair Value Gap detection to identify high-probability trade entries. This indicator uses a sophisticated filtering mechanism where signals appear only when multiple independent confirmation criteria align simultaneously.
Recommended Timeframe: 5-minute (M5) or higher. The indicator works best on M5, M15, and M30 charts for intraday trading.
🎯 ORIGINALITY & PURPOSE
This indicator is original because it combines three distinct analytical methods into a unified decision-making system:
Market Profile Volume Analysis - Identifies institutional accumulation/distribution zones
Dual VWAP Filtering - Confirms trend direction using two independent VWAP calculations
Fair Value Gap Detection - Validates institutional interest through price inefficiency zones
The key innovation is the directional filter system: the primary Market Profile generates BUY-ONLY or SELL-ONLY states based on higher timeframe value area reversals, which then controls which signals from the main system are displayed. This creates a multi-timeframe confluence that significantly reduces false signals.
Unlike simple indicator mashups, each component serves a specific purpose:
Market Profile → Direction bias (trend filter)
Primary VWAP (Session) → Short-term trend confirmation
Secondary VWAP (Week) → Medium-term trend confirmation
FVG Detection → Institutional activity validation
🔧 HOW IT WORKS
1. Primary Market Profile Filter (Higher Timeframe)
The indicator calculates Market Profile on a higher timeframe (default: 1 hour) to determine the overall market structure:
Value Area High (VAH): Top 70% of volume distribution
Value Area Low (VAL): Bottom 70% of volume distribution
Point of Control (POC): Price level with highest volume
When price reaches VAH and reverses down → SELL-ONLY mode activated
When price reaches VAL and reverses up → BUY-ONLY mode activated
This higher timeframe filter ensures you're trading in the direction of institutional flow.
2. Dual VWAP System
Two independent VWAP calculations provide multi-timeframe trend confirmation:
Primary VWAP (Session-based): Resets daily, tracks intraday momentum
Secondary VWAP (Week-based): Resets weekly, confirms longer-term trend
Filter Logic:
BUY signals require: Price > Primary VWAP AND Price > Secondary VWAP
SELL signals require: Price < Primary VWAP AND Price < Secondary VWAP
This dual confirmation prevents counter-trend trades during ranging conditions.
3. Fair Value Gap (FVG) Detection
FVG zones identify price inefficiencies where institutional orders were executed rapidly:
Bullish FVG: Gap between candle .high and candle .low (upward imbalance)
Bearish FVG: Gap between candle .high and candle .low (downward imbalance)
The indicator monitors recent FVG formation (lookback: 50 bars) and requires:
Bullish FVG present for BUY signals
Bearish FVG present for SELL signals
FVG zones are displayed as colored boxes and automatically marked as "mitigated" when price fills the gap.
4. Main Trading Signal Logic
The secondary Market Profile (default: 1 hour) generates the actual trading signals:
BUY Signal Conditions:
Price reaches Value Area Low
Reversal pattern confirmed (minimum 1 bar)
Price > Primary VWAP
Price > Secondary VWAP (if filter enabled)
Recent Bullish FVG detected (if filter enabled)
Primary MP Filter = BUY-ONLY or NEUTRAL
SELL Signal Conditions:
Price reaches Value Area High
Reversal pattern confirmed (minimum 1 bar)
Price < Primary VWAP
Price < Secondary VWAP (if filter enabled)
Recent Bearish FVG detected (if filter enabled)
Primary MP Filter = SELL-ONLY or NEUTRAL
All conditions must be TRUE simultaneously for a signal to appear.
📈 VISUAL ELEMENTS
On Chart:
🟢 Green Triangle (▲) = BUY Signal
🔴 Red Triangle (▼) = SELL Signal
🟦 Blue horizontal lines = Value Area zones
🟡 Yellow line = Point of Control (POC)
🟩 Green boxes = Bullish FVG zones
🟥 Red boxes = Bearish FVG zones
🔵 Blue line = Primary VWAP (Session)
⚪ White line = Secondary VWAP (Week)
Info Panel (Top Right):
Real-time status display showing:
Filter Direction (BUY ONLY / SELL ONLY / NEUTRAL)
Active timeframes for both MP filters
FVG filter status and count
VWAP positions (ABOVE/BELOW)
Signal enablement status
Alert status
⚙️ KEY SETTINGS
MP/TPO Filter Settings (Primary Indicator)
MP Filter Time Frame: 60 minutes (controls directional bias)
Filter Value Area %: 70% (standard Market Profile calculation)
Filter Alert Distance: 1 bar
Filter Min Bars for Reversal: 1 bar
Filter Alert Zone Margin: 0.01 (1%)
FVG Filter Settings
Use FVG Filter: Enabled (toggle on/off)
FVG Timeframe: 60 minutes (1 hour)
FVG Filter Mode: Both (require bullish FVG for BUY, bearish for SELL)
FVG Lookback Period: 50 bars (how far back to search)
Show FVG Formation Signals: Optional visual markers
Max FVG on Chart: 50 zones
Show Mitigated FVG: Display filled gaps
Market Profile Settings
Higher Time Frame: 60 minutes (for main signals)
Percent for Value Area: 70%
Show POC Line: Enabled
Keep Old MPs: Enabled (maintain historical profiles)
Primary VWAP Filter
Use Primary VWAP Filter: Enabled
Primary VWAP Anchor Period: Session (resets daily)
Primary VWAP Source: HLC3 (typical price)
Secondary VWAP Filter
Use Secondary VWAP Filter: Enabled
Secondary VWAP Anchor Period: Week (resets weekly)
Secondary VWAP Filter Mode: Both
Secondary VWAP Line Color: White
Trading Signals
Show Trading Signals on Chart: Enabled
Show SELL Signals: Enabled
Show BUY Signals: Enabled
Alert Distance: 1 bar
Min Bars for Reversal: 1 bar
Alert Zone Margin: 0.01 (1%)
Retest Search Period: 20 bars
Min Bars Between Retests: 5 bars
Show Only Retests: Disabled
Alert Settings
Enable Trading Notifications: Enabled
VAH Reversal Alert: Enabled (SELL signals)
VAL Reversal Alert: Enabled (BUY signals)
Time Filter Settings
Filter Alerts By Time: Optional (exclude specific hours)
⚠️ IMPORTANT WARNINGS & LIMITATIONS
1. Repainting Behavior
CRITICAL: This indicator uses lookahead=barmerge.lookahead_on to access higher timeframe data immediately for FVG detection. This is necessary to provide real-time FVG zone visualization but has the following implications:
FVG zones may shift slightly until the higher timeframe candle closes
FVG detection signals are preliminary until HTF bar confirmation
The main trading signals (triangles) appear on confirmed bars and do not repaint
Best Practice: Always wait for the current timeframe bar to close before acting on signals. The filter status and FVG zones are informational but may adjust as new data arrives.
2. Minimum Timeframe
Do NOT use on timeframes below 5 minutes (M5)
Recommended: M5, M15, M30 for intraday trading
Higher timeframes (H1, H4) can also be used but will generate fewer signals
3. Multiple Filters Can Block Signals
By design, this indicator is conservative. When all filters are enabled:
Signals appear ONLY when all conditions align
You may see extended periods with no signals
This is intentional to reduce false positives
If you see no signals:
Check the Info Panel to see which filters are failing
Consider adjusting FVG lookback period
Temporarily disable FVG filter to test
Verify VWAP filters match current market trend
4. Market Profile Limitations
Market Profile requires sufficient volume data
Low-volume instruments may produce unreliable profiles
Value Areas update only on higher timeframe bar close
Works best on liquid markets (major forex pairs, indices, crypto)
📖 HOW TO USE
Step 1: Add to Chart
Apply indicator to M5 or higher timeframe chart
Ensure chart shows volume data
Use standard candles (NOT Heikin Ashi, Renko, etc.)
Step 2: Configure Settings
Primary MP Filter TF: Set to 60 (1 hour) minimum, or 240 (4 hour) for swing trading
Main MP TF: Set to 60 (1 hour) for intraday signals
FVG Timeframe: Match or exceed main MP timeframe
Leave other settings at default initially
Step 3: Understand the Info Panel
Monitor the top-right panel:
FILTER STATUS: Shows current directional bias
NEUTRAL = Both signals allowed
BUY ONLY = Only green triangles will appear
SELL ONLY = Only red triangles will appear
FVG Filter: Shows if bullish/bearish gaps detected recently
VWAP positions: Confirms trend alignment
Step 4: Take Signals
For BUY Signal (Green Triangle ▲):
Wait for green triangle to appear
Check Info Panel shows ✓ for BUY signals
Confirm current bar has closed
Enter long position
Stop loss: Below recent VAL or swing low
Target: Previous Value Area High or 1.5-2× risk
For SELL Signal (Red Triangle ▼):
Wait for red triangle to appear
Check Info Panel shows ✓ for SELL signals
Confirm current bar has closed
Enter short position
Stop loss: Above recent VAH or swing high
Target: Previous Value Area Low or 1.5-2× risk
Step 5: Risk Management
Risk per trade: Maximum 1-2% of account equity
Position sizing: Adjust based on stop loss distance
Avoid trading: During major news events or time filter periods
Multiple confirmations: Look for confluence with price action (support/resistance, trendlines)
🎓 UNDERLYING CONCEPTS
Market Profile Theory
Developed by J. Peter Steidlmayer in the 1980s, Market Profile organizes price and volume data to identify:
Value Areas: Where 70% of trading activity occurred
POC: Price level with highest acceptance (most volume)
Imbalances: When price moves away from value quickly
This indicator uses TPO (Time Price Opportunity) calculation method to build the volume profile distribution.
VWAP (Volume Weighted Average Price)
VWAP represents the average price weighted by volume, showing where institutional traders are positioned:
Price above VWAP = Bullish (institutions accumulated lower)
Price below VWAP = Bearish (institutions distributed higher)
Using dual VWAP (Session + Week) creates multi-timeframe trend alignment.
Fair Value Gaps (FVG)
Also known as "imbalance" or "inefficiency," FVG occurs when:
Price moves so rapidly that a gap forms in the candlestick structure
Indicates institutional order flow (large market orders)
Price often returns to "fill" these gaps (rebalance)
The 3-candle FVG pattern (gap between candle and candle ) is widely used in ICT (Inner Circle Trader) methodology and Smart Money Concepts.
🔍 CREDITS & CODE ATTRIBUTION
This indicator builds upon established technical analysis concepts and combines multiple methodologies:
1. Market Profile / TPO Calculation
Concept Origin: J. Peter Steidlmayer (Chicago Board of Trade, 1980s)
Code Inspiration: TradingView's public domain Market Profile examples
Modifications: Custom filtering logic for directional bias, dual timeframe implementation
2. VWAP Calculation
Concept Origin: Standard financial instrument (widely used since 1980s)
Code Base: TradingView built-in ta.vwap() function (public domain)
Modifications: Dual VWAP system with independent anchor periods, custom filtering modes
3. Fair Value Gap Detection
Concept Origin: Inner Circle Trader (ICT) / Smart Money Concepts methodology
Code Implementation: Original implementation based on 3-candle gap pattern
Features: Multi-timeframe detection, automatic mitigation tracking, visual zone display
4. Pine Script Framework
Language: Pine Script v6 (TradingView)
Built-in Functions Used:
ta.vwap() - Volume weighted average price
request.security() - Higher timeframe data access
ta.change() - Period detection
ta.cum() - Cumulative volume
time() - Timestamp functions
Note: All code is original implementation. While concepts are based on established trading methodologies, the combination, filtering logic, and execution are unique to this indicator.
📊 RECOMMENDED INSTRUMENTS
Best Performance:
Major Forex Pairs (EURUSD, GBPUSD, USDJPY)
Stock Indices (ES, NQ, SPX, DAX)
Major Cryptocurrencies (BTCUSD, ETHUSD)
Liquid Stocks (high daily volume)
Avoid:
Low-volume altcoins
Illiquid stocks
Exotic forex pairs with wide spreads
⚡ PERFORMANCE TIPS
Start Conservative: Enable all filters initially
Reduce Filters Gradually: If too few signals, disable Secondary VWAP filter first
Match Timeframes: Keep MP Filter TF and FVG TF at same value
Backtest First: Review historical performance on your preferred instrument/timeframe
Combine with Price Action: Look for support/resistance confluence
Use Time Filter: Avoid low-liquidity hours (optional setting)
🚫 WHAT THIS INDICATOR DOES NOT DO
Does not guarantee profits - No trading system is 100% accurate
Does not predict the future - Based on historical patterns
Does not replace risk management - Always use stop losses
Does not work on all instruments - Requires volume data and liquidity
Does not provide exact entry/exit prices - Signals are zones, not precise levels
Does not account for fundamentals - Purely technical analysis
📜 DISCLAIMER
This indicator is provided for educational and informational purposes only. It is not financial advice, and past performance does not guarantee future results.
Trading Risk Warning:
All trading involves risk of loss
You can lose more than your initial investment (leverage products)
Only trade with capital you can afford to lose
Always use appropriate position sizing and risk management
Consider seeking advice from a licensed financial advisor
Technical Limitations:
Indicator may repaint FVG zones until HTF bar closes
Signals are based on historical patterns that may not repeat
Market conditions change and no system works in all environments
Volume data quality varies by exchange/broker
By using this indicator, you acknowledge these risks and agree that the author bears no responsibility for trading losses.
📞 SUPPORT & UPDATES
Questions? Comment on this publication
Issues? Describe the problem with chart screenshot
Feature Requests? Suggest improvements in comments
Updates: Will be published as new versions using TradingView's update feature
📝 VERSION HISTORY
Version 1.0 (Current)
Initial public release
Multi-filter system: MP + Dual VWAP + FVG
Directional bias filter
Real-time info panel
Comprehensive alert system
Time-based filtering
Thank you for using Smart VWAP FVG System!
Happy Trading! 📈

EMA + RSI Autotrade Webhook - VarunOverview
The EMA + RSI Autotrade Webhook is a powerful trend-following indicator designed for automated crypto futures trading. This indicator combines the reliability of Exponential Moving Average (EMA) crossovers with RSI momentum filtering to generate high-probability buy and sell signals optimized for webhook integration with crypto exchanges like Delta Exchange, Binance Futures, and Bybit.Key Features
Simple & Effective: Uses proven EMA 9/21 crossover strategy
RSI Momentum Filter: Eliminates low-probability trades in ranging markets
Webhook Ready: Two clean alerts (LONG Entry, SHORT Entry) for seamless automation
Exchange Compatible: Works with Delta Exchange, 3Commas, Alertatron, and other webhook platforms
Zero Lag Signals: Real-time alerts on crossover confirmation
Visual Clarity: Clean chart markers for easy signal identification
How It Works
Entry Signals:
LONG Entry: Triggers when EMA 9 crosses above EMA 21 AND RSI is above 52 (bullish momentum confirmed)
SHORT Entry: Triggers when EMA 9 crosses under EMA 21 AND RSI is below 48 (bearish momentum confirmed)
Technical Components:
Fast EMA: 9-period (tracks short-term price action)
Slow EMA: 21-period (identifies primary trend)
RSI: 14-period (confirms momentum strength)
RSI Long Threshold: 52 (filters weak bullish signals)
RSI Short Threshold: 48 (filters weak bearish signals)
Best Use Cases
Crypto Futures Trading: Bitcoin, Ethereum, Altcoin perpetual contracts
Automated Trading Bots: Integration with Delta Exchange webhooks, TradingView alerts
Timeframes: Optimized for 15-minute charts (works on 5min-1H)
Markets: Trending crypto markets with clear directional moves
Risk Management: Best used with 1-2% stop loss per trade (managed externally)
Webhook Automation Setup
Add indicator to your TradingView chart
Create alerts for "LONG Entry" and "SHORT Entry"
Configure webhook URL from your exchange (Delta Exchange, Binance, etc.)
Use alert message: Entry LONG {{ticker}} @ {{close}} or Entry SHORT {{ticker}} @ {{close}}
Exchange automatically reverses positions on opposite signals
Advantages
✅ No manual trading required - fully automated
✅ Eliminates emotional trading decisions
✅ Catches trending moves early with EMA crossovers
✅ RSI filter reduces whipsaws in choppy markets
✅ Works 24/7 without monitoring
✅ Simple two-alert system (easy to manage)
✅ Compatible with multiple exchanges via webhooksStrategy Philosophy
This indicator follows a trend-following with momentum confirmation approach. By waiting for both EMA crossover AND RSI confirmation, it ensures you're entering trades with genuine momentum behind them, not just random price noise. The tight RSI thresholds (52/48) keep you aligned with the prevailing trend.Recommended Settings
Timeframe: 15-minute (primary), 5-minute (scalping), 1-hour (swing)
Markets: BTC/USDT, ETH/USDT, high-liquidity altcoin perpetuals
Position Sizing: 100% capital per signal (exchange manages reversals)
Stop Loss: 2% (managed via exchange or external bot)
Leverage: 1-2x for conservative approach, up to 5x for aggressive
Important Notes
⚠️ This indicator generates entry signals only - position reversals are handled automatically by your exchange
⚠️ Always backtest on historical data before live trading
⚠️ Use proper risk management and position sizing
⚠️ Best performance in trending markets; may generate false signals in tight ranges
⚠️ Requires TradingView Premium or higher for webhook functionalityTags
cryptocurrency futures automated-trading ema-crossover rsi webhook delta-exchange tradingview-alerts trend-following momentum bitcoin ethereum crypto-bot algo-trading 15-minute-strategy

Pinbar MTF - No Repaint# Pinbar MTF - No Repaint Indicator
## Complete Technical Documentation
---
## 📊 Overview
**Pinbar MTF (Multi-Timeframe) - No Repaint** is a professional-grade TradingView Pine Script indicator designed to detect high-probability pinbar reversal patterns with advanced filtering systems. The indicator is specifically engineered to be **100% non-repainting**, making it reliable for both live trading and backtesting.
### Key Features
✅ **Non-Repainting** - Signals only appear AFTER bar closes, never disappear
✅ **Three-Layer Filter System** - ATR, SWING, and RSI filters
✅ **Automatic SL/TP Calculation** - Based on risk:reward ratios
✅ **Real-time Alerts** - TradingView notifications for all signals
✅ **Visual Trade Management** - Lines, labels, and areas for entries, stops, and targets
✅ **Backtesting Ready** - Reliable historical data for strategy testing
---
## 🎯 What is a Pinbar?
A **Pinbar (Pin Bar/Pinocchio Bar)** is a single candlestick pattern that indicates a potential price reversal:
### Bullish Pinbar (BUY Signal)
- **Long lower wick** (rejection of lower prices)
- **Small body at the top** of the candle
- Shows buyers rejected sellers' attempt to push price down
- Forms at support levels or swing lows
- Entry signal for LONG positions
### Bearish Pinbar (SELL Signal)
- **Long upper wick** (rejection of higher prices)
- **Small body at the bottom** of the candle
- Shows sellers rejected buyers' attempt to push price up
- Forms at resistance levels or swing highs
- Entry signal for SHORT positions
---
## 🔧 How the Indicator Works
### 1. **Pinbar Detection Logic**
The indicator analyzes the **previous closed bar ** to identify pinbar patterns:
```
Bullish Pinbar Requirements:
- Lower wick > 72% of total candle range (adjustable)
- Upper wick < 28% of total candle range
- Close > Open (bullish candle body)
Bearish Pinbar Requirements:
- Upper wick > 72% of total candle range (adjustable)
- Lower wick < 28% of total candle range
- Close < Open (bearish candle body)
```
**Why check ?** By analyzing the previous completed bar, we ensure the pattern is fully formed and won't change, preventing repainting.
---
### 2. **Three-Layer Filter System**
#### 🔍 **Filter #1: ATR (Average True Range) Filter**
- **Purpose**: Ensures the pinbar has significant size
- **Function**: Only signals if pinbar range ≥ ATR value
- **Benefit**: Filters out small, insignificant pinbars
- **Settings**:
- Enable/Disable toggle
- ATR Period (default: 7)
**Example**: If ATR = 50 pips, only pinbars with 50+ pip range will signal.
---
#### 🔍 **Filter #2: SWING Filter** (Always Active)
- **Purpose**: Confirms pinbar forms at swing highs/lows
- **Function**: Validates the pinbar is an absolute high/low
- **Benefit**: Identifies true reversal points
- **Settings**:
- Swing Candles (default: 3)
**How it works**:
- For bullish pinbar: Checks if low is lowest of past 3 bars
- For bearish pinbar: Checks if high is highest of past 3 bars
**Example**: With 3 swing candles, a bullish pinbar must have the lowest low among the last 3 bars.
---
#### 🔍 **Filter #3: RSI (Relative Strength Index) Filter**
- **Purpose**: Confirms momentum conditions
- **Function**: Prevents signals in extreme momentum zones
- **Benefit**: Avoids counter-trend trades
- **Settings**:
- Enable/Disable toggle
- RSI Period (default: 7)
- RSI Source (Close, Open, High, Low, HL2, HLC3, OHLC4)
- Overbought Level (default: 70)
- Oversold Level (default: 30)
**Logic**:
- Bullish Pinbar: Only signals if RSI < 70 (not overbought)
- Bearish Pinbar: Only signals if RSI > 30 (not oversold)
---
### 3. **Stop Loss Calculation**
Two methods available:
#### Method A: ATR-Based Stop Loss (Recommended)
```
Bullish Pinbar:
SL = Pinbar Low - (1 × ATR)
Bearish Pinbar:
SL = Pinbar High + (1 × ATR)
```
**Benefit**: Dynamic stops that adapt to market volatility
#### Method B: Fixed Pips Stop Loss
```
Bullish Pinbar:
SL = Pinbar Low - (Fixed Pips)
Bearish Pinbar:
SL = Pinbar High + (Fixed Pips)
```
**Settings**:
- Calculate Stop with ATR (toggle)
- Stop Pips without ATR (default: 5)
---
### 4. **Take Profit Calculation**
Take Profit is calculated based on Risk:Reward ratio:
```
Bullish Trade:
TP = Entry + (Entry - SL) × Risk:Reward Ratio
Bearish Trade:
TP = Entry - (SL - Entry) × Risk:Reward Ratio
```
**Example**:
- Entry: 1.2000
- SL: 1.1950 (50 pip risk)
- RR: 2:1
- TP: 1.2100 (100 pip reward = 50 × 2)
**Settings**:
- Risk:Reward Ratio (default: 1.0, range: 0.1 to 10.0)
---
## 📈 Visual Elements
### On-Chart Displays
1. **Signal Markers**
- 🟢 **Green Triangle Up** = Bullish Pinbar (BUY)
- 🔴 **Red Triangle Down** = Bearish Pinbar (SELL)
- Placed directly on the pinbar candle
2. **Entry Labels**
- Green "BUY" label with entry price
- Red "SELL" label with entry price
- Shows exact entry level
3. **Stop Loss Lines**
- 🔴 Red horizontal line
- "SL" label
- Extends 20 bars forward
4. **Take Profit Lines**
- 🟢 Green horizontal line
- "TP" label
- Extends 20 bars forward
5. **Risk/Reward Areas** (Optional)
- Red shaded box = Risk zone (Entry to SL)
- Green shaded box = Reward zone (Entry to TP)
- Visual risk:reward visualization
6. **Info Table** (Top Right)
- Displays current settings
- Shows filter status (ON/OFF)
- Real-time RSI value
- Quick reference panel
---
## 🔔 Alert System
Three alert types available:
### 1. Combined Alert: "Pinbar Signal (Any Direction)"
- Fires for BOTH bullish and bearish pinbars
- **Best for**: General monitoring
- **Message**: "Pinbar Signal Detected on {TICKER} at {PRICE}"
### 2. Bullish Alert: "Bullish Pinbar Alert"
- Fires ONLY for BUY signals
- **Best for**: Long-only strategies
- **Message**: "BUY Signal on {TICKER} at {PRICE}"
### 3. Bearish Alert: "Bearish Pinbar Alert"
- Fires ONLY for SELL signals
- **Best for**: Short-only strategies
- **Message**: "SELL Signal on {TICKER} at {PRICE}"
---
## ⚙️ Input Parameters Reference
### **Filters Group**
| Parameter | Default | Range | Description |
|-----------|---------|-------|-------------|
| ATR Filter on Pinbar Range? | ✅ ON | Boolean | Enable/disable ATR filter |
| ATR Period | 7 | 1+ | Lookback period for ATR calculation |
| Swing Candles | 3 | 1+ | Bars to check for swing high/low |
| RSI Filter on Pinbar? | ❌ OFF | Boolean | Enable/disable RSI filter |
| RSI Period | 7 | 2+ | Lookback period for RSI calculation |
| RSI Source | Close | Multiple | Price data for RSI (Close/Open/High/Low/etc) |
| RSI Overbought Level | 70 | 50-100 | Upper threshold for RSI filter |
| RSI Oversold Level | 30 | 0-50 | Lower threshold for RSI filter |
### **Pinbar Detection Group**
| Parameter | Default | Range | Description |
|-----------|---------|-------|-------------|
| Shadow % vs Body | 72 | 50-95 | Minimum wick size as % of total range |
### **Visualization Group**
| Parameter | Default | Range | Description |
|-----------|---------|-------|-------------|
| Show SL and TP Lines? | ✅ ON | Boolean | Display stop loss and take profit lines |
| Show SL and TP Area? | ❌ OFF | Boolean | Show shaded risk/reward boxes |
### **Risk Management Group**
| Parameter | Default | Range | Description |
|-----------|---------|-------|-------------|
| Risk:Reward Ratio | 1.0 | 0.1-10.0 | Target profit vs risk (1.0 = 1:1, 2.0 = 1:2) |
| Calculate Stop with ATR? | ✅ ON | Boolean | Use ATR for stop calculation |
| Stop Pips without ATR | 5 | 1+ | Fixed pip stop when ATR disabled |
---
## 🚫 Non-Repainting Architecture
### What is Repainting?
**Repainting** occurs when an indicator's historical signals differ from what appeared in real-time. This makes backtesting unreliable and can lead to false confidence in a strategy.
### How This Indicator Prevents Repainting
1. **Closed Bar Analysis**
- All calculations use ` ` offset (previous bar)
- Only analyzes COMPLETED candles
- Signals appear on the bar AFTER the pinbar closes
2. **Confirmed Swing Points**
- Waits for sufficient bar history before signaling
- Only checks historical bars that cannot change
- Prevents premature swing detection
3. **Static Alert Timing**
- Alerts fire only after bar completion
- No conditional logic that changes historically
- Same results in replay mode and live trading
### Verification Method
To verify non-repainting behavior:
1. Apply indicator to chart
2. Note signal locations and prices
3. Refresh browser / reload chart
4. **Signals remain in exact same locations**
---
## 💼 Trading Strategy Guidelines
### Entry Rules
**For Bullish Pinbar (LONG):**
1. Wait for green triangle to appear
2. Enter at close of pinbar (shown in label)
3. Alternative: Enter on break of pinbar high
4. Place stop loss at red SL line
5. Set target at green TP line
**For Bearish Pinbar (SHORT):**
1. Wait for red triangle to appear
2. Enter at close of pinbar (shown in label)
3. Alternative: Enter on break of pinbar low
4. Place stop loss at red SL line
5. Set target at green TP line
### Risk Management
- **Position Sizing**: Risk only 1-2% of account per trade
- **Stop Loss**: Always use the calculated SL (never move it wider)
- **Take Profit**: Use calculated TP or trail stop after 1:1 RR
- **Multiple Timeframes**: Confirm signals on higher timeframe
### Best Practices
✅ **DO:**
- Wait for bar to close before entering
- Trade in direction of higher timeframe trend
- Use on liquid markets with clear support/resistance
- Combine with price action analysis
- Keep a trading journal
❌ **DON'T:**
- Enter before bar closes (prevents seeing full pattern)
- Trade against strong trends
- Ignore the filters (they improve win rate)
- Risk more than 2% per trade
- Trade every signal (be selective)
---
## 📊 Backtesting & Data Export
### Available Data Points
The indicator exports these values for strategy development:
| Output | Description |
|--------|-------------|
| Bullish Signal | 1 = BUY signal, 0 = No signal |
| Bearish Signal | 1 = SELL signal, 0 = No signal |
| Bull SL | Stop loss level for long trades |
| Bull TP | Take profit level for long trades |
| Bull Entry | Entry price for long trades |
| Bear SL | Stop loss level for short trades |
| Bear TP | Take profit level for short trades |
| Bear Entry | Entry price for short trades |
### How to Use in Strategy
These values can be accessed by Pine Script strategies using:
```pine
indicator_values = request.security(syminfo.tickerid, timeframe.period,
)
```
---
## 🎓 Understanding the Filters
### Why Use Multiple Filters?
Single-indicator systems often generate too many false signals. This indicator uses a **confluence approach**:
1. **Pinbar Pattern** = Price rejection detected
2. **+ SWING Filter** = Rejection at key level
3. **+ ATR Filter** = Significant move
4. **+ RSI Filter** = Favorable momentum
**Result**: Higher probability setups with better risk:reward
### Filter Optimization
**Conservative Settings** (Fewer, Higher Quality Signals):
- ATR Filter: ON
- Swing Candles: 5
- RSI Filter: ON
- Shadow %: 75%
**Aggressive Settings** (More Signals, More Noise):
- ATR Filter: OFF
- Swing Candles: 2
- RSI Filter: OFF
- Shadow %: 65%
**Balanced Settings** (Recommended):
- ATR Filter: ON
- Swing Candles: 3
- RSI Filter: OFF (or ON for trending markets)
- Shadow %: 72%
---
## 🔍 Troubleshooting
### "No Signals Appearing"
**Possible Causes:**
1. Filters are too strict
2. No pinbars forming on chart
3. Insufficient bar history
**Solutions:**
- Reduce Shadow % to 65%
- Reduce Swing Candles to 2
- Disable ATR or RSI filters temporarily
- Check that chart has enough data loaded
### "Too Many Signals"
**Solutions:**
- Enable ATR filter
- Increase Swing Candles to 4-5
- Enable RSI filter
- Increase Shadow % to 75-80%
### "Signals Appearing Late"
**This is normal behavior!** The indicator:
- Analyzes previous closed bar
- Signals appear on the bar AFTER the pinbar
- This is what prevents repainting
- Signal latency is 1 bar (by design)
---
## 📝 Technical Specifications
**Indicator Type:** Overlay (displays on price chart)
**Pine Script Version:** 5
**Max Labels:** 500
**Max Lines:** 500
**Repainting:** None (100% non-repainting)
**Data Window Values:** 8 exported values
**Alert Types:** 3 (Combined, Bullish, Bearish)
**Performance:**
- Lightweight script (fast execution)
- Works on all timeframes
- Compatible with all markets (Forex, Crypto, Stocks, Futures)
- No data snooping bias
---
## 🎯 Use Cases
### 1. **Swing Trading**
- Timeframe: Daily, 4H
- Filter Settings: All enabled
- Best for: Catching major reversals
### 2. **Day Trading**
- Timeframe: 15m, 1H
- Filter Settings: ATR + SWING only
- Best for: Intraday reversals
### 3. **Scalping**
- Timeframe: 5m, 15m
- Filter Settings: SWING only (aggressive)
- Best for: Quick reversals (requires experience)
### 4. **Position Trading**
- Timeframe: Weekly, Daily
- Filter Settings: All enabled + high RR (2:1 or 3:1)
- Best for: Long-term trend reversal catches
---
## 🏆 Advantages Over Other Pinbar Indicators
✅ **Guaranteed Non-Repainting** - Many pinbar indicators repaint; this one never does
✅ **Automatic SL/TP** - No manual calculation needed
✅ **Multi-Layer Filtering** - Reduces false signals significantly
✅ **Visual Trade Management** - Clear entry, stop, and target levels
✅ **Flexible Configuration** - Adaptable to any trading style
✅ **Alert System** - Never miss a setup
✅ **Backtesting Ready** - Reliable historical data
✅ **Professional Grade** - Suitable for live trading
---
## 📚 Educational Resources
### Recommended Reading on Pinbars
- "The Pin Bar Trading Strategy" by Nial Fuller
- "Price Action Trading" by Al Brooks
- TradingView Education: Price Action Patterns
### Practice Recommendations
1. Paper trade signals for 20+ trades before live trading
2. Backtest on different timeframes and markets
3. Keep detailed records of all trades
4. Analyze winning vs losing setups
5. Refine filter settings based on results
---
## ⚖️ Disclaimer
This indicator is a tool for technical analysis and does not guarantee profits. Trading involves substantial risk of loss. Past performance is not indicative of future results.
- Always use proper risk management
- Never risk more than you can afford to lose
- Consider your trading experience and objectives
- Seek independent financial advice if needed
---
## 📧 Version Information
**Current Version:** 1.0
**Last Updated:** 2024
**Compatibility:** TradingView Pine Script v5
**Status:** Production Ready
---
## 🔄 Future Enhancements (Potential)
Possible future additions:
- Multi-timeframe confirmation option
- Volume filter integration
- Customizable color schemes
- Win rate statistics display
- Partial profit taking levels
- Trailing stop functionality
---
## 📖 Quick Start Guide
### 5-Minute Setup
1. **Add to Chart**
- Open TradingView
- Go to Pine Editor
- Paste the code
- Click "Add to Chart"
2. **Configure Settings**
- Open indicator settings (gear icon)
- Start with default settings
- Enable "Show SL and TP Lines"
3. **Set Alert**
- Right-click indicator name
- Click "Add Alert"
- Select "Pinbar Signal (Any Direction)"
- Configure notification method
4. **Test**
- Scroll back on chart
- Verify signals make sense
- Check that signals don't repaint
5. **Trade** (After Practice!)
- Wait for alert
- Verify signal quality
- Enter, place SL/TP
- Manage trade
---
## 🎯 Final Thoughts
The **Pinbar MTF - No Repaint** indicator is designed for serious traders who value:
- **Reliability** over flashy signals
- **Quality** over quantity
- **Honesty** over false promises
This indicator will NOT:
- Make you rich overnight
- Win every trade
- Replace proper trading education
This indicator WILL:
- Identify high-probability reversal setups
- Save you analysis time
- Provide consistent, non-repainting signals
- Help you develop a systematic trading approach
**Success in trading comes from:**
1. Proper education (60%)
2. Risk management (30%)
3. Technical tools like this indicator (10%)
Use this tool as part of a complete trading plan, not as a standalone solution.

Candle Breakout StrategyShort description (one-liner)
Candle Breakout Strategy — identifies a user-specified candle (UTC time), draws its high/low range, then enters on breakouts with configurable stop-loss, take-profit (via Risk:Reward) and optional alerts.
Full description (ready-to-paste)
Candle Breakout Strategy
Version 1.0 — Strategy script (Pine v5)
Overview
The Candle Breakout Strategy automatically captures a single "range candle" at a user-specified UTC time, draws its high/low as a visible box and dashed level lines, and waits for a breakout. When price closes above the range high it enters a Long; when price closes below the range low it enters a Short. Stop-loss is placed at the opposite range boundary and take-profit is calculated with a user-configurable Risk:Reward multiplier. Alerts for entries can be enabled.
This strategy is intended for breakout style trading where a clearly defined intraday range is established at a fixed time. It is simple, transparent and easy to adapt to multiple symbols and timeframes.
How it works (step-by-step)
On every bar the script checks the current UTC time.
When the first bar that matches the configured Target Hour:Target Minute (UTC) appears, the script records that candle’s high and low. This defines the breakout range.
A box and dashed lines are drawn on the chart to display the range and extended to the right while the range is active.
The script then waits for price to close outside the box:
Close > Range High → Long entry
Close < Range Low → Short entry
When an entry triggers:
Stop-loss = opposite range boundary (range low for longs, range high for shorts).
Take-profit = entry ± (risk × Risk:Reward). Risk is computed as the distance between entry price and stop-loss.
After entry the range becomes inactive (waitingForBreakout = false) until the next configured target time.
Inputs / Parameters
Target Hour (UTC) — the hour (0–23) in UTC when the range candle is detected.
Target Minute — minute (0–59) of the target candle.
Risk:Reward Ratio — multiplier for computing take profit from risk (0.5–10). Example: 2 means TP = entry + 2×risk.
Enable Alerts — turn on/off entry alerts (string message sent once per bar when an entry occurs).
Show Last Box Only (internal behavior) — when enabled the previous box is deleted at the next range creation so only the most recent range is visible (default behavior in the script).
Visuals & On-chart Info
A semi-transparent blue box shows the recorded range and extends to the right while active.
Dashed horizontal lines mark the range high and low.
On-chart shapes: green triangle below bar for Long signals, red triangle above bar for Short signals.
An information table (top-right) displays:
Target Time (UTC)
Active Range (Yes / No)
Range High
Range Low
Risk:Reward
Alerts
If Enable Alerts is on, the script sends an alert with the following formats when an entry occurs:
Long alert:
🟢 LONG SIGNAL
Entry Price:
Stop Loss:
Take Profit:
Short alert:
🔴 SHORT SIGNAL
Entry Price:
Stop Loss:
Take Profit:
Use TradingView's alert dialog to create alerts based on the script — select the script’s alert condition or use the alert() messages.
Recommended usage & tips
Timeframe: This strategy works on any timeframe but the definition of "candle at target time" depends on the chart timeframe. For intraday breakout styles, use 1m — 60m charts depending on the session you want to capture.
Target Time: Choose a time that is meaningful for the instrument (e.g., market open, economic release, session overlap). All times are handled in UTC.
Position Sizing: The script’s example uses strategy.percent_of_equity with 100% default — change default_qty_value or strategy settings to suit your risk management.
Filtering: Consider combining this breakout with trend filters (EMA, ADX, etc.) to reduce false breakouts.
Backtesting: Always backtest over a sufficiently large and recent sample. Pay attention to slippage and commission settings in TradingView’s strategy tester.
Known behavior & limitations
The script registers the breakout on close outside the recorded range. If you prefer intrabar breakout rules (e.g., high/low breach without close), you must adjust the condition accordingly.
The recorded range is taken from a single candle at the exact configured UTC time. If there are missing bars or the chart timeframe doesn't align, the intended candle may differ — choose the target time and chart timeframe consistently.
Only a single active position is allowed at a time (the script checks strategy.position_size == 0 before entries).
Example setups
EURUSD (Forex): Target Time 07:00 UTC — captures London open range.
Nifty / Index: Target Time 09:15 UTC — captures local session open range.
Crypto: Target Time 00:00 UTC — captures daily reset candle for breakout.
Risk disclaimer
This script is educational and provided as-is. Past performance is not indicative of future results. Use proper risk management, test on historical data, and consider slippage and commissions. Do not trade real capital without sufficient testing.
Change log
v1.0 — Initial release: range capture, box and level drawing, long/short entry by close breakout, SL at opposite boundary, TP via Risk:Reward, alerts, info table.
If you want, I can also:
Provide a short README version (2–3 lines) for the TradingView “Short description” field.
Add a couple of suggested alert templates for the TradingView alert dialog (if you want alerts that include variable placeholders).
Convert the disclaimer into multiple language versions.

COT Index Indicator 1) One‑liner
My version of the OTC COT Index indicator: a 0–120 oscillator built from CFTC COT data that shows where Commercial, Noncommercial, and Nonreportable net positions sit relative to recent extremes.
2) Short paragraph
This is my version of the OTC COT Index indicator. It converts CFTC Commitments of Traders (COT) net positions into a normalized 0–120 oscillator for each trader group—Commercials, Noncommercials, and Nonreportables—so you can quickly see when positioning is near recent highs or lows. Data comes from TradingView’s official COT library and supports both “Futures Only” and “Futures and Options” reports.
3) Compact bullets
What: My version of the OTC COT Index indicator
Why: Quickly spot when trader groups are near positioning extremes
Data: CFTC COT via TradingView/LibraryCOT/2; Futures Only or Futures & Options
How: Index = 120 × (Current − Min) ÷ (Max − Min) over a configurable lookback
Plots: Commercials (blue), Noncommercials (orange), Nonreportables (red)
Lines: Overbought, Midline, Oversold, optional 0/100, upper/lower bounds
Note: Values are relative to the chosen window; not trading advice
4) Publication‑ready (sections)
Overview
My version of the OTC COT Index indicator. It turns CFTC COT positioning into a 0–120 oscillator per trader group (Commercials, Noncommercials, Nonreportables) to highlight relative extremes.
Data source
CFTC Commitments of Traders via TradingView’s official library (TradingView/LibraryCOT/2).
Supports “Futures Only” and “Futures and Options.”
Method
Net positions = Longs − Shorts.
Index = 120 × (Current Net − Min(Net, Lookback)) ÷ (Max(Net, Lookback) − Min(Net, Lookback)).
Inputs
Weeks Look Back (normalization window)
Weeks Look Back for Historical Hi/Los (longer reference)
Report Type selection
Visuals
Three indexes by trader group, plus reference levels (OB/OS, Midline, optional 0/100).
Notes
Some symbols map to specific CFTC codes for reliability.
If no relevant COT data exists for the symbol, the script reports it clearly.
If you want this adapted to a specific platform’s character limits (e.g., TradingView’s publish dialog), tell me the target length and I’ll trim it to fit.

Index of Civilization DevelopmentIndex of Civilization Development Indicator
This Pine Script (version 6) creates a custom technical indicator for TradingView, titled Index of Civilization Development. It generates a composite index by averaging normalized stock market performances from a selection of global country indices. The normalization is relative to each index's 100-period simple moving average (SMA), scaled to a percentage (100% baseline). This allows for a comparable "development" or performance metric across diverse markets, potentially highlighting trends in global economic or "civilizational" progress based on equity markets.The indicator plots as a single line in a separate pane (non-overlay) and is designed to handle up to 40 symbols to respect TradingView's request.security() call limits.Key FeaturesComposite Index Calculation: Fetches the previous bar's close (close ) and its 100-period SMA for each selected symbol.
Normalizes each: (close / SMA(100)) * 100.
Averages the valid normalizations (ignores invalid/NA data) to produce a single "Index (%)" value.
Symbol Selection Modes:Top N Countries: Selects from a predefined list of the top 50 global stock indices (by market cap/importance, e.g., SPX for USA, SHCOMP for China). Options: Top 5, 15, 25, or 50.
Democratic Countries: ~38 symbols from democracies (e.g., SPX, NI225, NIFTY; based on democracy indices ≥6/10, including flawed/parliamentary systems).
Dictatorships: ~12 symbols from authoritarian/hybrid regimes (e.g., SHCOMP, TASI, IMOEX; scores <6/10).
Customization:Line color (default: blue).
Line width (1-5, default: 2).
Line style: Solid line (default), Stepline, or Circles.
Data Handling:Uses request.security() with lookahead enabled for real-time accuracy, gaps off, and invalid symbol ignoring.
Runs calculations on every bar, with max_bars_back=2000 for historical depth.
Arrays are populated only on the first bar (barstate.isfirst) for efficiency.
Predefined Symbol Lists (Examples)Top 50: SPX (USA), SHCOMP (China), NI225 (Japan), ..., BAX (Bahrain).
Democratic: Focuses on free-market democracies like USA, Japan, UK, Canada, EU nations, Australia, etc.
Dictatorships: Authoritarian markets like China, Saudi Arabia, Russia, Turkey, etc.
Usage TipsAdd to any chart (e.g., daily/weekly timeframe) to view the composite line.
Ideal for macro analysis: Compare democratic vs. authoritarian performance, or track "top world" equity health.
Potential Limitations: Relies on TradingView's symbol availability; some exotic indices (e.g., KWSEIDX) may fail if not supported. The 40-symbol cap prevents errors.
Interpretation: Values >100 indicate above-trend performance; <100 suggest underperformance relative to recent averages.
This script blends financial data with geopolitical categorization for a unique "civilization index" perspective on global markets. For modifications, ensure symbol tickers match TradingView's format.
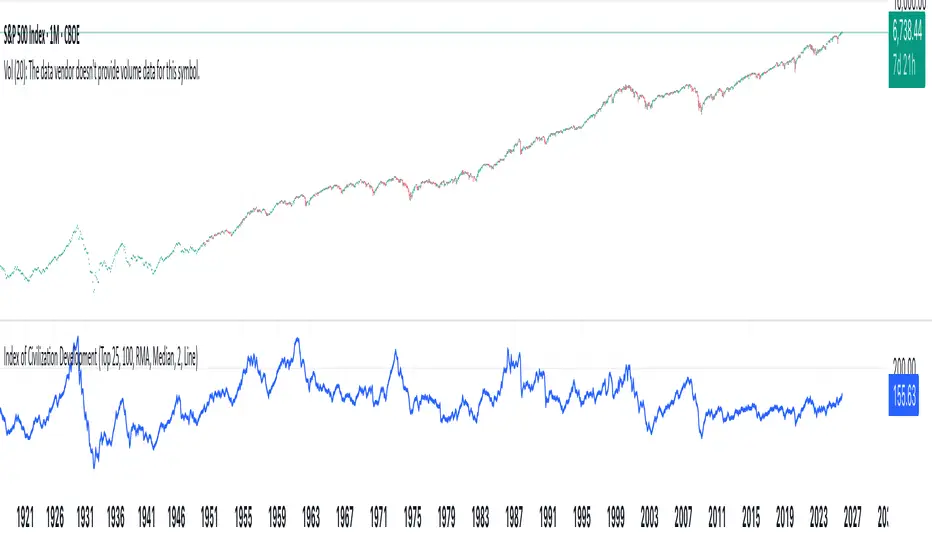
Tchwella Stocks Custom WatermarkThis Pine Script v5 indicator adds a customizable watermark to TradingView charts, displaying key stock information while allowing for flexible positioning and formatting.
📌 Features & Functionality:
✅ Custom Positioning:
• Fixed to the top-left corner.
• Adjustable spacing ensures the text is properly aligned.
✅ Displayed Information (Configurable):
• Company Name & Market Cap (Optional: Shows dynamically calculated market cap)
• Stock Ticker & Timeframe
• Industry & Sector
✅ Customization Options:
• Font Size: Huge, Large, Normal, Small
• Text Color & Transparency: Adjustable
• Proper Left Alignment for a clean, structured display
• Vertical Offset Tweaks to move text down for better visibility
✅ Optimized Table Layout:
• Uses table.new() for persistent placement.
• Added an empty row to fine-tune positioning, ensuring the watermark doesn’t overlap key chart areas.
🔧 Use Case:
Designed for traders who want a clear, customizable stock watermark to enhance their charting experience without obstructing price action.
Feb 1
Release Notes
Updated version: now you can decide your location for the watermark
Micha Stocks Custom Watermark (MSWM) – TradingView Script
This Pine Script v5 indicator adds a customizable watermark to TradingView charts, displaying key stock information while allowing for flexible positioning and formatting.
📌 Features & Functionality:
✅ Custom Positioning:
• Fixed to the top-left corner.
• Adjustable spacing ensures the text is properly aligned.
✅ Displayed Information (Configurable):
• Company Name & Market Cap (Optional: Shows dynamically calculated market cap)
• Stock Ticker & Timeframe
• Industry & Sector
✅ Customization Options:
• Font Size: Huge, Large, Normal, Small
• Text Color & Transparency: Adjustable
• Proper Left Alignment for a clean, structured display
• Vertical Offset Tweaks to move text down for better visibility
✅ Optimized Table Layout:
• Uses table.new() for persistent placement.
• Added an empty row to fine-tune positioning, ensuring the watermark doesn’t overlap key chart areas.
🔧 Use Case:
Designed for traders who want a clear, customizable stock watermark to enhance their charting experience without obstructing price action.
Feb 7
Release Notes
Micha Stocks Custom Watermark – Updated Version 🚀
This updated Micha Stocks Custom Watermark script enhances your TradingView experience by adding an ATR-based volatility signal alongside the existing customizable stock watermark.
🆕 New Features & Improvements:
✅ ATR (14-Day) with Dynamic Volatility Indicator
• Displays the ATR value and its percentage relative to price.
• Includes a color-coded volatility signal:
• 🔴 High Volatility (Above user-defined Red Threshold)
• 🟡 Moderate Volatility (Between Red & Yellow Thresholds)
• 🟢 Low Volatility (Below user-defined Yellow Threshold)
✅ Fully Customizable ATR Thresholds
• Users can set their own ATR % levels for Red, Yellow, and Green signals.
✅ Improved Watermark Customization
• Users can still adjust the position, size, and color of the watermark.
• Includes Company Name, Ticker, Market Cap, Industry, and Sector.
• ATR can be turned on/off in settings for flexibility.
🔧 How to Use:
1️⃣ Go to Indicator Settings → Enable or Disable ATR Display
2️⃣ Adjust ATR % Thresholds to fit your volatility preference
3️⃣ Customize Text Position, Color, and Size to match your chart setup
This update makes it easier to quickly assess market volatility while keeping a clean and professional chart layout.
💡 Why Use This Indicator?
• Effortlessly track key stock info without cluttering your chart.
• Quickly identify volatile conditions using ATR percentage signals.
• Adjust settings on the fly to match your trading strategy.
📢 Update Now & Enjoy a Smarter Charting Experience!

AI Trading Alerts v6 — SL/TP + Confidence + Panel (Fixed)Overview
This Pine Script is designed to identify high-probability trading opportunities in Forex, commodities, and crypto markets. It combines EMA trend filters, RSI, and Stochastic RSI, with automatic stop-loss (SL) & take-profit (TP) suggestions, and provides a confidence panel to quickly assess the trade setup strength.
It also includes TradingView alert conditions so you can set up notifications for Long/Short setups and EMA crosses.
⚙️ Features
EMA Trend Filter
Uses EMA 50, 100, 200 for trend confirmation.
Bull trend = EMA50 > EMA100 > EMA200
Bear trend = EMA50 < EMA100 < EMA200
RSI Filter
Bullish trades require RSI > 50
Bearish trades require RSI < 50
Stochastic RSI Filter
Prevents entries during overbought/oversold extremes.
Bullish entry only if %K and %D < 80
Bearish entry only if %K and %D > 20
EMA Proximity Check
Price must be near EMA50 (within ATR × adjustable multiplier).
Signals
Continuation Signals:
Long if all bullish conditions align.
Short if all bearish conditions align.
Cross Events:
Long Cross when price crosses above EMA50 in bull trend.
Short Cross when price crosses below EMA50 in bear trend.
Automatic SL/TP Suggestions
SL size adjusts depending on asset:
Gold/Silver (XAU/XAG): 5 pts
Bitcoin/Ethereum: 100 pts
FX pairs (default): 20 pts
TP = SL × Risk:Reward ratio (default 1:2).
Confidence Score (0–4)
Based on conditions met (trend, RSI, Stoch, EMA proximity).
Labels:
Strongest (4/4)
Strong (3/4)
Medium (2/4)
Low (1/4)
Visual Panel on Chart
Shows ✅/❌ for each condition (trend, RSI, Stoch, EMA proximity, signal now).
Confidence row with color-coded strength.
Alerts
Long Setup
Short Setup
Long Cross
Short Cross
🖥️ How to Use
1. Add the Script
Open TradingView → Pine Editor.
Paste the full script.
Click Add to chart.
Save as "AI Trading Alerts v6 — SL/TP + Confidence + Panel".
2. Configure Inputs
EMA Lengths: Default 50/100/200 (works well for swing trading).
RSI Length: 14 (standard).
Stochastic Length/K/D: Default 14/3/3.
Risk:Reward Ratio: Default 2.0 (can change to 1.5, 3.0, etc.).
EMA Proximity Threshold: Default 0.20 × ATR (adjust to be stricter/looser).
3. Read the Panel
Top-right of chart, you’ll see ✅ or ❌ for:
Trend → Are EMAs aligned?
RSI → Above 50 (bull) or below 50 (bear)?
Stoch OK → Not extreme?
Near EMA50 → Close enough to EMA50?
Above/Below OK → Price position vs. EMA50 matches trend?
Signal Now → Entry triggered?
Confidence row:
🟢 Green = Strongest
🟩 Light green = Strong
🟧 Orange = Medium
🟨 Yellow = Low
⬜ Gray = None
4. Alerts Setup
Go to TradingView Alerts (⏰ icon).
Choose the script under “Condition”.
Select alert type:
Long Setup
Short Setup
Long Cross
Short Cross
Set notification method (popup, sound, email, mobile).
Click Create.
Now TradingView will notify you automatically when signals appear.
5. Example Workflow
Wait for Confidence = Strong/Strongest.
Check if market session supports volatility (e.g., XAU in London/NY).
Review SL/TP suggestions:
Long → Entry: current price, SL: close - risk_pts, TP: close + risk_pts × RR.
Short → Entry: current price, SL: close + risk_pts, TP: close - risk_pts × RR.
Adjust based on your own price action analysis.
📊 Best Practices
Use on H1 + D1 combo → align higher timeframe bias with intraday entries.
Risk only 1–2% of account per trade (position sizing required).
Filter with market sessions (Asia, Europe, US).
Strongest signals work best with trending pairs (e.g., XAUUSD, USDJPY, BTCUSD).

The Best Strategy Template[LuciTech]Hello Traders,
This is a powerful and flexible strategy template designed to help you create, backtest, and deploy your own custom trading strategies. This template is not a ready-to-use strategy but a framework that simplifies the development process by providing a wide range of pre-built features and functionalities.
What It Does
The LuciTech Strategy Template provides a robust foundation for building your own automated trading strategies. It includes a comprehensive set of features that are essential for any serious trading strategy, allowing you to focus on your unique trading logic without having to code everything from scratch.
Key Features
The LuciTech Strategy Template integrates several powerful features to enhance your strategy development:
•
Advanced Risk Management: This includes robust controls for defining your Risk Percentage per Trade, setting a precise Risk-to-Reward Ratio, and implementing an intelligent Breakeven Stop-Loss mechanism that automatically adjusts your stop to the entry price once a specified profit threshold is reached. These elements are crucial for capital preservation and consistent profitability.
•
Flexible Stop-Loss Options: The template offers adaptable stop-loss calculation methods, allowing you to choose between ATR-Based Stop-Loss, which dynamically adjusts to market volatility, and Candle-Based Stop-Loss, which uses structural price points from previous candles. This flexibility ensures the stop-loss strategy aligns with diverse trading styles.
•
Time-Based Filtering: Optimize your strategy's performance by restricting trading activity to specific hours of the day. This feature allows you to avoid unfavorable market conditions or focus on periods of higher liquidity and volatility relevant to your strategy.
•
Customizable Webhook Alerts: Stay informed with advanced notification capabilities. The template supports sending detailed webhook alerts in various JSON formats (Standard, Telegram, Concise Telegram) to external platforms, facilitating real-time monitoring and potential integration with automated trading systems.
•
Comprehensive Visual Customization: Enhance your analytical clarity with extensive visual options. You can customize the colors of entry, stop-loss, and take-profit lines, and effectively visualize market inefficiencies by displaying and customizing Fair Value Gap (FVG) boxes directly on your chart.
How It Does It
The LuciTech Strategy Template is meticulously crafted using Pine Script, TradingView's powerful and expressive programming language. The underlying architecture is designed for clarity and modularity, allowing for straightforward integration of your unique trading signals. At its core, the template operates by taking user-defined entry and exit conditions and then applying a sophisticated layer of risk management, position sizing, and trade execution logic.
For instance, when a longCondition or shortCondition is met, the template dynamically calculates the appropriate position size. This calculation is based on your specified risk_percent of equity and the stop_distance (the distance between your entry price and the calculated stop-loss level). This ensures that each trade adheres to your predefined risk parameters, a critical component of disciplined trading.
The flexibility in stop-loss calculation is achieved through a switch statement that evaluates the sl_type input. Whether you choose an ATR-based stop, which adapts to market volatility, or a candle-based stop, which uses structural price points, the template seamlessly integrates these methods. The ATR calculation itself is further refined by allowing various smoothing methods (RMA, SMA, EMA, WMA), providing granular control over how volatility is measured.
Time-based filtering is implemented by comparing the current bar's time with user-defined start_hour, start_minute, end_hour, and end_minute inputs. This allows the strategy to activate or deactivate trading during specific market sessions or periods of the day, a valuable tool for optimizing performance and avoiding unfavorable conditions.
Furthermore, the template incorporates advanced webhook alert functionality. When a trade is executed, a customizable JSON message is formatted based on your webhook_format selection (Standard, Telegram, or Concise Telegram) and sent via alert function. This enables seamless integration with external services for real-time notifications or even automated trade execution through third-party platforms.
Visual feedback is paramount for understanding strategy behavior. The template utilizes plot and fill functions to clearly display entry prices, stop-loss levels, and take-profit targets directly on the chart. Customizable colors for these elements, along with dedicated options for Fair Value Gap (FVG) boxes, enhance the visual analysis during backtesting and live trading, making it easier to interpret the strategy's actions.
How It's Original
The LuciTech Strategy Template distinguishes itself in the crowded landscape of TradingView scripts through its unique combination of integrated, advanced risk management features, highly flexible stop-loss methodologies, and sophisticated alerting capabilities, all within a user-friendly and modular framework. While many templates offer basic entry/exit signal integration, LuciTech goes several steps further by providing a robust, ready-to-use infrastructure for managing the entire trade lifecycle once a signal is generated.
Unlike templates that might require users to piece together various risk management components or code complex stop-loss logic from scratch, LuciTech offers these critical functionalities out-of-the-box. The inclusion of dynamic position sizing based on a user-defined risk percentage, a configurable risk-to-reward ratio, and an intelligent breakeven mechanism significantly elevates its utility. This comprehensive approach to capital preservation and profit targeting is a cornerstone of professional trading and is often overlooked or simplified in generic templates.
Furthermore, the template's provision for multiple stop-loss calculation types—ATR-based for volatility adaptation, and candle-based for structural support/resistance—demonstrates a deep understanding of diverse trading strategies. The underlying code for these calculations is already implemented, saving developers considerable time and effort. The subtle yet powerful inclusion of FVG (Fair Value Gap) related inputs also hints at advanced price action concepts, offering a sophisticated layer of analysis and execution that is not commonly found in general-purpose templates.
The advanced webhook alerting system, with its support for various JSON formats tailored for platforms like Telegram, showcases an originality in catering to the needs of modern, automated trading setups. This moves beyond simple TradingView pop-up alerts, enabling seamless integration with external systems for real-time trade monitoring and execution. This level of external connectivity and customizable data output is a significant differentiator.
In essence, the LuciTech Strategy Template is original not just in its individual features, but in how these features are cohesively integrated to form a powerful, opinionated, yet highly adaptable system. It empowers traders to focus their creative energy on developing their core entry/exit signals, confident that the underlying framework will handle the complexities of risk management, trade execution, and external communication with precision and flexibility. It's a comprehensive solution designed to accelerate the development of robust and professional trading strategies.
How to Modify the Logic to Apply Your Strategy
The LuciTech Strategy Template is designed with modularity in mind, making it exceptionally straightforward to integrate your unique trading strategy logic. The template provides a clear separation between the core strategy management (risk, position sizing, exits) and the entry signal generation. This allows you to easily plug in your own buy and sell conditions without altering the robust underlying framework.
Here’s a step-by-step guide on how to adapt the template to your specific trading strategy:
1.
Locate the Strategy Logic Section:
Open the Pine Script editor in TradingView and navigate to the section clearly marked with the comment //Strategy Logic Example:. This is where the template’s placeholder entry conditions (a simple moving average crossover) are defined.
2.
Define Your Custom Entry Conditions:
Within this section, you will find variables such as longCondition and shortCondition. These are boolean variables that determine when a long or short trade should be initiated. Replace the existing example logic with your own custom buy and sell conditions. Your conditions can be based on any combination of indicators, price action patterns, candlestick formations, or other market analysis techniques. For example, if your strategy involves a combination of RSI and MACD, you would define longCondition as (rsi > 50 and macd_line > signal_line) and shortCondition as (rsi < 50 and macd_line < signal_line).
3.
Leverage the Template’s Built-in Features:
Once your longCondition and shortCondition are defined, the rest of the template automatically takes over. The integrated risk management module will calculate the appropriate position size based on your Risk % input and the chosen Stop Loss Type. The Risk:Reward ratio will determine your take-profit levels, and the Breakeven at R feature will manage your stop-loss dynamically. The time filter (Use Time Filter) will ensure your trades only occur within your specified hours, and the webhook alerts will notify you of trade executions.
