BEST Supertrend StrategyHello traders
Sharing a sample Supertrend strategy to illustrate how to calculate a convergence and using it in a strategy
I based the setup as follow:
- Entries on Supertrend MTF breakout + moving average cross. Entering whenever there is a convergence
- exit whenever a Simple Moving Averages cross in the opposite direction happen
- possibility to filter only Longs/Shorts or both
All the best
Dave
Search in scripts for "trendline"

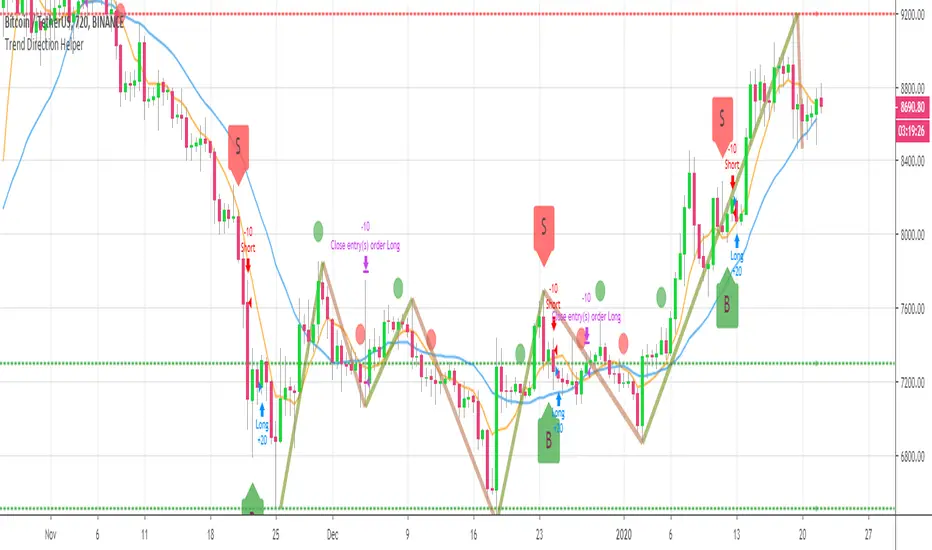
BEST Trend Direction Helper (Strategy Edition)Hello traders
A follower asked me to convert my Trend Direction Helper into a strategy
So blessed this indicator reached the 1400+ likes milestone - I can't believe how many people are trading with it
I based the setup as follow:
- Entries on those green/red labels
- exit whenever a Simple Moving Averages cross in the opposite direction happen
- possibility to filter only Longs/Shorts or both
Also...
The strategy includes the Zig Zag/Pivots high/low and other options from the indicator version. I only added a quick strategy component with a hard exit concept based on SMA cross
All the best fam and... HAPPY NEW YEAR !!!!!!!!!!!
Dave
Pivot Reversal Strategy - FIGS & DATES 2.0Simple Pivot Reversal Strategy with some adding settings.
Date Range: To test over specific market conditions.
Initial Capitol: $10K - This is a more realistic representation of funds used this strategy (for me anyway). The default of $100K can give different results (usually better) than when using a smaller balance.
Order Size: 100% Equity - These trend following strategies typically used this way, going all in each direction.
Commission: .075% - It's always disheartening to think you've found a ridiculously good setting, and then realize you forgot to add the commission.
All of these settings can be changed, but it's easier for me (and more fool proof) to have them set as default.

Trend Direction Helper (ZigZag and S/R and HH/LL labels)Hey everyone
First of all, I'd like to thank Ricardo Santos, Backtest Rookies for the inspiration for this script.
Actually, most of it is coming from them and I only mixed them up (and added my secret sauce ^^). If some of you are not thinking about a trading secret sauce, please get serious for a moment :)
Some of you asked me how I do to set the trend direction. You all understood that if you get an UP label, then the price should go up and vice-versa for down.
But it's not so easy to define the good signals for each asset and each timeframe. I'm going to repeat what I said yesterday because ... well... that's what trading is about
So quoting myself here "The inputs set by default will have to be changed for your asset/timeframe and can't be generic for everything. You have to play with the inputs until the signals will make sense to you
The indicator/strategy with a unique configuration that you'll never check or update according to the market condition DOES NOT exit. "
BUT... a bit of patience and practice and you might do wonders.
The Method
I never realized until now but by connecting the higher highs/lower lows, I was drawing zigzag lines.
The Zig Zag Master is Ricardo Santos . Please give him a follow, he's awesome
For those who don't want to draw on the chart or (my preferred choice) need some inspiration to define your trend directions, this script is for YOU (and your family, your pet, your girlfriend/boyfriend, ...)
I think that each asset/timeframe chart has its own history. What worked in a post could work in the future.
In that regard, if a trend direction worked in the past, that's the parameter that I'll use to trade with it in a demo account and make sure it's relevant. If not then I will adjust
If you're trading with new indicators or a new method right away on your real trading account, you're gonna have a bad time imgflip.com
Lines EVERYWHERE
The script draws the classical horizontal pivots + the zig zag lines + the Higher Highs/Lower Lows label in just 1 script. I'm very excited to share a script (on which I coded 100 lines out of 500) but no one else did it
The horizontal pivots part are coming from Backtest Rookies
For more security, you can add a pullback on a moving average after getting a signal. Pullbacks are necessary to limit any eventual loss or maximize your gains by getting in the trend sooner.
I really give you a solid method and a great script in my opinion. 6 years of experience given away for FREE :p (when Dave will start thinking as a business man instead :O)
Does it repaint ?
Getting this question twice a day. You guys are obsessed with the repainting :)
Short answer, yes because it will calculate the pivots and zig zags whenever new higher highs/lower lows will be formed.
However, the trend direction code is based on the candle close so it shouldn't repaint. If it does, please let me know
See you all on Monday
Love you all
Dave
____________________________________________________________
Be sure to hit the thumbs up. Building those indicators take a lot of time and likes are always rewarding for me :) (tips are accepted too)
- If you want to suggest some indicators that I can develop and share with the community, please use my personal TRELLO board
- I'm an officially approved PineEditor/LUA/MT4 approved mentor on codementor. You can request a coaching with me if you want and I'll teach you how to build kick-ass indicators and strategies
Jump on a 1 to 1 coaching with me
- You can also hire for a custom dev of your indicator/strategy/bot/chrome extension/python
Disclaimer:
Trading involves a high level of financial risk, and may not be appropriate because you may experience losses greater than your deposit. Leverage can be against you.
Do not trade with capital that you can not afford to lose. You must be aware and have a complete understanding of all the risks associated with the market and trading. We can not be held responsible for any loss you incur.
Trading also involves risks of gambling addiction.
Please notice I do not provide financial advice - my indicators, strategies, educational ideas are intended to provide only some source code for anyone interested in improving their trading
The proprietary indicators and strategies developed by Best Trading Indicator, the object of intellectual property rights are and remain the exclusive property of Best Trading Indicator, at the exclusion of images and videos and texts free of rights or provided by the Company or external legal or physical person.
No assignment of intellectual property rights is carried out through these Terms and Conditions.
Any total or partial reproduction, modification or use of these properties for any reason whatsoever is strictly prohibited without the express written authorization of the Company.

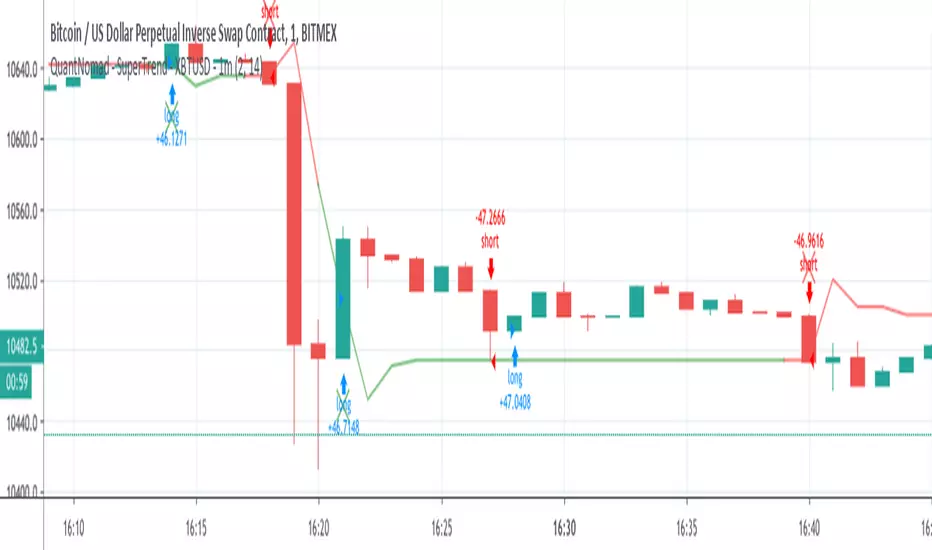
QuantNomad - SuperTrend - XBTUSD - 1mInteresting performance for Super Trend strategy for XBTUSD 1m chart.
Params: ST Mult: 2, ST Period 14.
Performance: 144% profit, 1988 trades, only 41% prof, 2.04% dd , 2.51 Sharpe.
On its own, it might be not a very good strategy, but the big amount of trades allows you to add more filters and improve it.
And remember:
Past performance does not guarantee future results.
QuantNomad - SuperTrend - TSLA - 1mInteresting performance for Super Trend strategy for Tesla ( TSLA ) 1m chart.
Params: ST Mult: 3, ST Period 120.
Performance:61% profit, 637 trades, only 33% prof, 4.84% dd , 0.4 Sharpe.
On its own, it might be not a very good strategy, but the big amount of trades allows you to add more filters and improve it.
The strategy is not bad both with "when" params when strategy executed on open of next bar and with stop orders when strategy enters on exact Super Trend level.
You can comment/uncomment lines in the code and switch from one approach to another.
And remember:
Past performance does not guarantee future results.

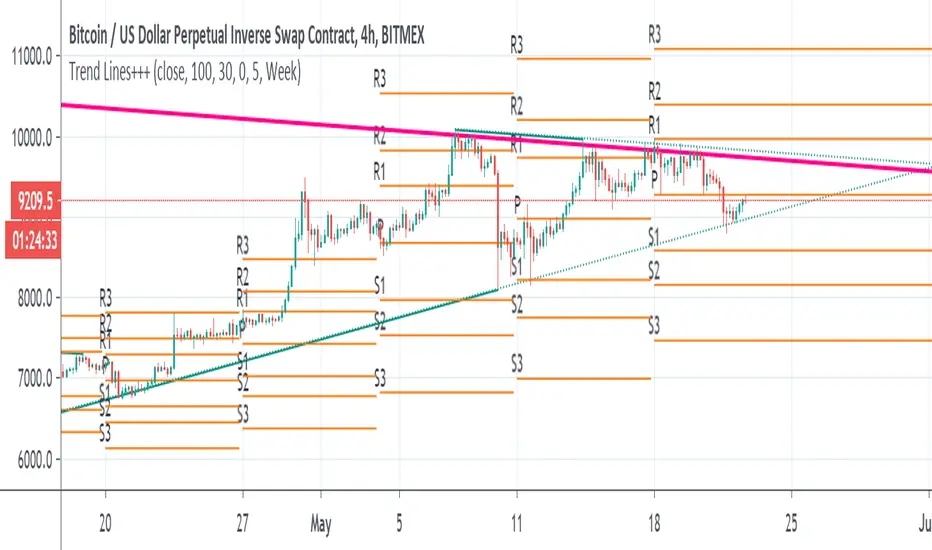
Trend Lines+++scripts taken from
Nothing here is mine , just put it as I like the combination of those script together when I analyse data
so it make life easy to draw line automode
I suggest 4 hours or daily chart with MACD and RSI
Thanks to autors in scripts
Higher High Lower Low Strategy (With Source Code)This script finds pivot highs and pivot lows then calculates higher highs & lower lows. And also it calculates support/resistance by using HH-HL-LL-LH points.
Generally HH and HL shows up-trend, LL and LH shows down-trend.
If price breaks resistance levels it means the trend is up or if price breaks support level it means the trend is down, so the script changes bar color blue or black. if there is up-trend then bar color is blue, or if down-trend then bar color is black. also as you can see support and resistance levels change dynamically.
If you use smaller numbers for left/right bars then it will be more sensitive.
source code of :

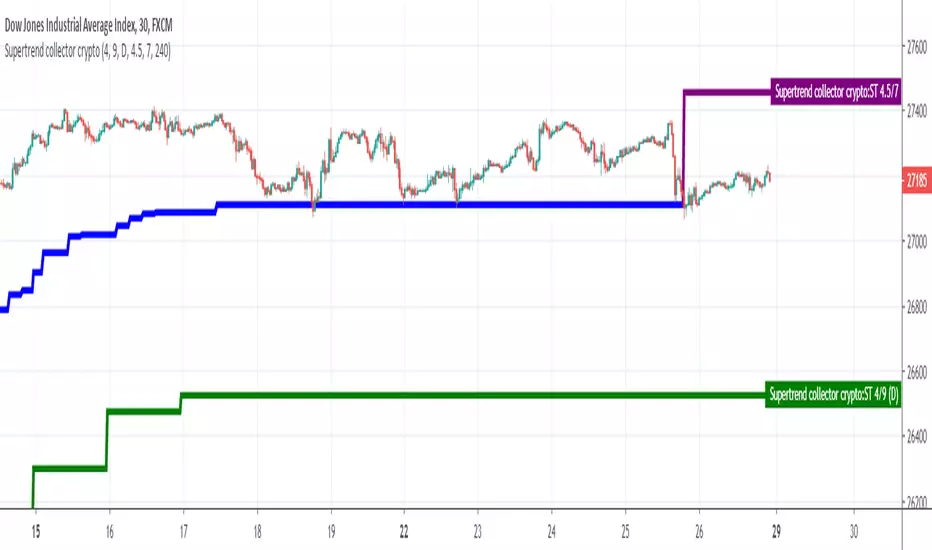
Supertrend collectorHello traders
This is an example of how you can add multiple indicators into a unique one
In this instance, I added two supertrend multitimeframes and draw them on a different timeframe chart
Enjoy
David
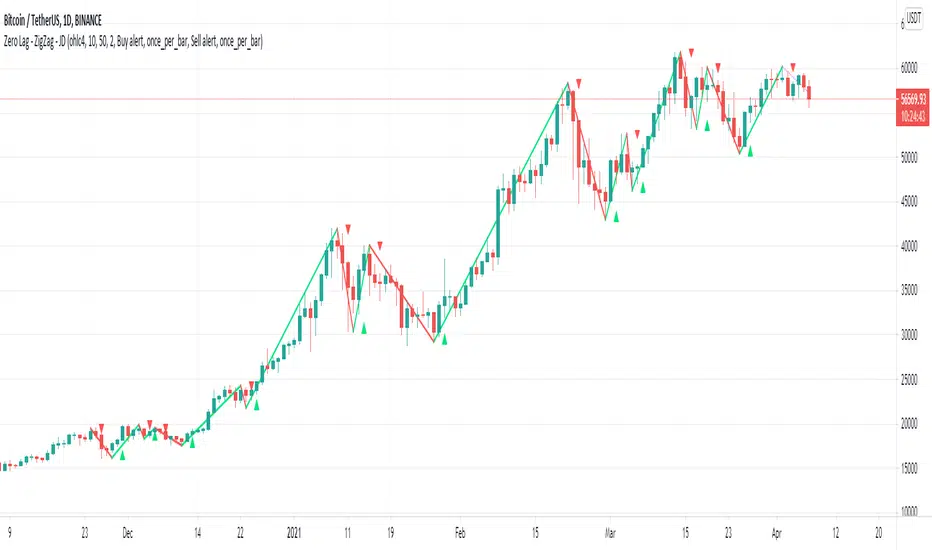
Zero Lag - ZigZag - JDThis is a alternative version of the well known "ZigZag indicator" but it uses turning points of the Jurik ma
instead of the traditional "pivot points" that are by definition lagging by a large lookback period, the (almost-) Zero Lag ZigZag lags by about 2 bars on average (depending on the candles forming)
The ZigZag pattern can be used to draw trendlines and S/R lines
It can also be used for "wave counting" in a way that reduces interpretation.
If you find other uses, please leave your ideas in the comments!
Shoutout to Everget for the awesome Jurik code!!
JD.
#NotTradingAdvice #DYOR
[New series!] [Consistent Losing Strategies] 34 EMA Scalping//---------------------------INTRO------------------------------
Hi All!
Let me introduce myself as a semi-successful forex trader & lover of automation.
I've taken to algo trading and have been hunting down strategies (that usually use indicators) to automate, backtest, and hopefully implement in MT4.
Unfortunately, most strategies are complete bulls*** and the select cases that are shown to "prove" success are limited.
These strategy sources often do not provide useful analytics either.
I want to change that approach to trading! We can really benefit each other and the community by being methodical about backtesting
as well as evaluating our results with some kind of scoring heuristic.
As for what that standardized process looks like..well I'm still working on it.
I'm pretty much on Tv for multiple hours of the day, screening strategies via Pinescript and I'd like to start sharing my progress!
This is a new series I'd like to start on consistently losing strategies. I'll make all the code public, so if you think I've made a blunder
or approached a problem the wrong way, then drop me a DM or paste your fix into the comments.
//---------------------------STRAT------------------------------
34 EMA Scalping strategy (ref. forextradingstrategies4u )
How you're supposed to trade it:
BUY:
1. Market is in an down trend as shown by the 34 EMA
2. Price breaks above a downwards trend line
3. Price breaks above the 34 EMA
4. Look for a very bullish candlestick or chart pattern
SELL:
1. Look for the 34 EMA to show we are in an uptrend
2. Price breaks below an upwards sloping trend line
3. Price breaks below 34 EMA
4. Look for a bearish candlestick or a chart pattern
//---------------------------CONC------------------------------
Q: Why does it fail?
A: I believe this strategy relies too much on subjective input (aka, trendlines).
Q: Why does it fail as an algo?
A: The 34 EMA is no more predictive than any other EMA, although it does a good job at filtering out noise.
Q: Should I try it out?
A: No, it's trash. This is the proof that it is trash.

RSI with Visual Buy/Sell Setup | Corrective/Impulsive IndicatorRSI with Visual Buy/Sell Setup | 40-60 Support/Resistance | Corrective/Impulsive Indicator v2.15
|| RSI - The Complete Guide PDF ||
Modified Zones with Colors for easy recognition of Price Action.
Resistance @ downtrend = 60
Support @ uptrend = 40
Over 70 = Strong Bullish Impulse
Under 30 = Strong Bearish Impulse
Uptrend : 40-80
Downtrend: 60-20
--------------------
Higher Highs in price, Lower Highs in RSI = Bearish Divergence
Lower Lows in price, Higher Lows in RSI = Bullish Divergence
--------------------
Trendlines from Higher/Lower Peaks, breakout + retest for buy/sell setups.
###################
There are multiple ways for using RSI, not only divergences, but it confirms the trend, possible bounce for continuation and signals for possible trend reversal.
There's more advanced use of RSI inside the book RSI: The Complete Guide
Go with the force, and follow the trend.
"The Force is more your friend than the trend"

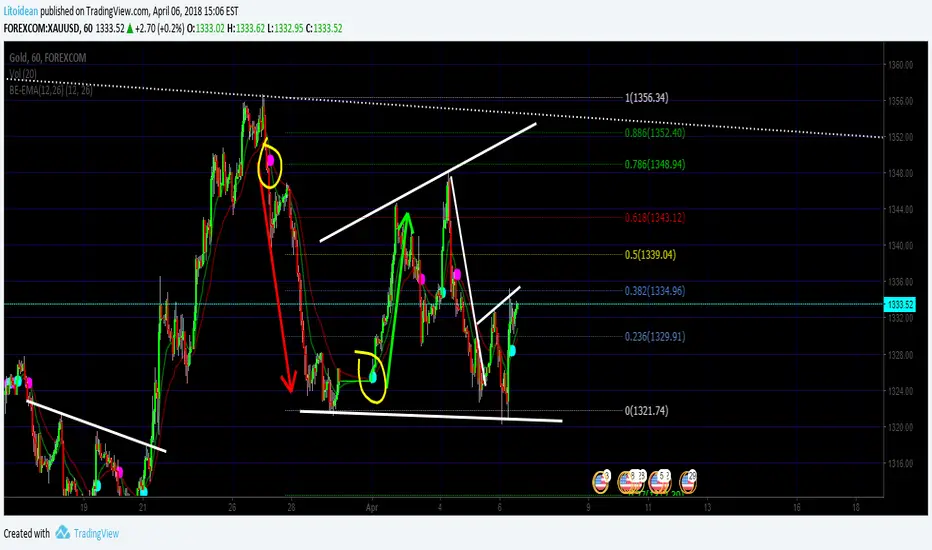
BE-EMA(12,26) (Blue Empire Exponential Moving Average)
Simple EMA where you get a CROSS mark between EMA 12 and EMA 26.
Each time a cross happens, a spot gets created.
If it's cyan, it goes up.
If it's magenta, it goes down.
I'm studying Trading at Blue Empire Academy, if you want to know more send me a PM.
Wave Analysis study the wave's behavior and tries to predict by using trendlines, elliot waves, fibonacci retracements, and EMAs basically.
In this Indicator, It's a confirmation when EMA 12 goes over to confirm the price may go up. and Vice versa.
Hope you like, please share if you think it's useful and comment if you think this can be better.
Thank you again for reading
>> This is just an indicator, it doesn't predict the future. Use it at your own risk. <<
##########
All the credits to @tracks, a genius who helped me polish the code. :] thank you.
ETH/BTC MMAs Daytrade strategy 15min UT 0.05% feesPlayed around with Moving Averages, with the goal to bounce on trendlines and trend reversals.
Time Unit : 15 min
Candle Type : Heikin Ashi
Commission : 0.05% on trades (Binance fees)
Initial capital : 1k €
Do you think this could work?

Bat MACDWorks on Bullish divergence indicators and is identical to MACD during an uptrend, works best on 2H or higher timeframes.
Incorporates a SL which can be changed at will. SL is also used as a buy signal on lower timeframe crossovers.
Uses 6H MACD to differentiate between up and downtrends.
Recommend to take profits at pivots, trendlines instead of strategy's position which is delayed.
Signals on downtrend best used when SL is flat.

Scalping Swing Trading Tool R1-4 by JustUncleLDescription:
This study project is a "Scalping Swing trading Tool" and is an alternative to the "Scalping Pullback Tool R1". It is designed for a two pane TradingView chart layout :
the first pane set to 15min Time Frame;
the second pane set to 1min Time Frame(TF).
The tools incorporates the majority of the indicators needed to analyse and scalp Trends for Swings, PullBacks and reversals on 15min charts and 1min charts.
Incorporated within this tool are the following indicators:
1. The following EMAs are drawn automatically:
Green = EMA89 (15min TF) = EMA75 (1min TF)
Blue = EMA200 (15min TF) = EMA180 (1min TF)
Black = EMA633 (15min TF) = EMA540 (1min TF)
2. The 10EMA (default) High/Low+Close Price Action Channel (PAC), the PAC channel
display is disabled by default.
3. Optionally display Fractals and optional Fractal levels
4. Optional HH, LH, LL, HL finder.
5. Coloured coded Bar high lighting based on the PAC:
blue = bar closed above PAC
red = bar closed below PAC
gray = bar closed inside PAC
lime Line = EMA10 of bar close
6. Pivot points (disables Fractals automatically when selected) with optional labels.
7. EMA5-12 Channel is displayed by default.
8. EMA12-36 Ribbon is displayed by default
9. Optionally display EMA36 and PAC instead of EMA12-36 Ribbon.
Set up and hints:
I am unable to provide a full description here, as Pullback Trading incorporates a full trading Methodology, there are a number of articles and books written on the subject.
Set to two pane TradingView chart, set first pane to 15Min and second to 1min.
Set the chart to Heikin Ashi Candles (optional).
I also add a "Sweetspot Gold2" indicator to the chart as well to help with support and resistance finding and shows where the important "00" lines are.
Use the EMA200 on the 15min pane as the anchor. So when prices above EMA200 we only trade long (buy) and when prices below the EMA200 we only trade short (sell).
On the 15min chart draw any obvious Vertical Trend Lines (VTL), use Pivots point as a guide.
On the 15min chart what we’re looking for price to Pullback into the EMA5-12 Channel or EMA12-36 ribbon, we draw Trendlines uitilising the Pivot points or Fractals to guide your TL drawing.
On the 15min chart look for the trend to resume and break through the drawn TL. The bar color needs to change back to the trend direction colour to confirm as a break.
Now this break can be traded as a 15min trade or now look to the 1min chart.
On the 1min chart draw any Pullback into any of the EMAs.
On the 1min chart look for the trend to resume and break through the drawn TL. The bar color needs to change back to the trend direction colour to confirm as a break.
Now this break can be traded as a 1min trade.
There is also an option to select Pristine (ie Ideal) filtered Fractals, which look like tents or V shape 5-candle patterns. These are actually used to calculate the Pivot points as well.
Other than the "SweetSpot Gold2" indicator, you should not need any other indicator to successfully trade trends for Pullbacks and reversals. If you really want another indicator use the AO (Awesome Oscillator) as it is momentum based.

Scalping PullBack Tool R1 by JustUncleLDescription
This study project is a Scalping Pullback trading Tool that incorporates the majority of the indicators needed to analyse and scalp Trends for Pull Backs and reversals on 1min, 5min or 15min charts. The set up utilies Heikin Ashi candle charts. Incorporated within this tool are the following indicators:
1. Major industry (Banks) recognised important EMAs in an EMA Ribbon:
Green = EMA89
Blue = EMA200
Black = EMA633
2. The 36EMA (default) High/Low+Close Price Action Channel (PAC).
3. Fractals
4. HH, LH, LL, HL finder to help with drawing Trend lines and mini Trend Lines.
5. Coloured coded Bar high lighting based on the PAC:
blue = bar closed above PAC
red = bar closed below PAC
gray = bar closed inside PAC
red line = EMA36 of bar close
Setup and hints:
Set the chart to Heikin Ashi Candles.
Add "Sweetspot Gold10" indicator to the chart as well to help with support and resistance finding and shows where the important "00" and "0" lines are.
When price is above the PAC(blue bars) we are only looking to buy as price comes back to the PAC
When price is below the PAC(red bars), we are only looking to sell when price comes back to the PAC
What we’re looking for when price comes back into the PAC we draw mini Trendlines utilising the Fractals and HH/LL points to guide your TL drawing.
Now look for the trend to pull back and break the drawn TL. That's is when we place the scalp trade.
So we are looking for continuation signals in terms of a strong, momentum driven pullbacks (normally short term 10-20 pips) of the EMA36.
The other EMAs are there to check for other Pullbacks when EMA36 is broken.
Other than the SweetSpot Gold10 indicator, you should not need any other indicator to scalp the pullbacks.
References:
Fractals V8 by RicardoSantos
Price Action Trading System v0.3 by JustUncleL
SweetSpot Gold10 R1 by JustUncleL
www.swing-trade-stocks.com
www.forexstrategiesresources.com

Pump_Doctor Trends**You must enable bar colors in the options for the script if you wish to see them**
This indicator is very useful for spotting trends / tops / bottoms.
This is the ultimate altcoin pump spotting tool. Use on higher timeframes for greatest accuracy. If altcoin is newish (ZEC for example), try 4h rather than 1D or 3D.
Green = Uptrend
Red = Downtrend
Gray = Top/local top, bottom/local bottom, or continuation. You will need some knowledge of price action to determine which condition applies.
You can use the oscillator at the bottom as a measure of momentum / trend strength. You can draw trendlines on the oscillator on the top/bottom or the interior.
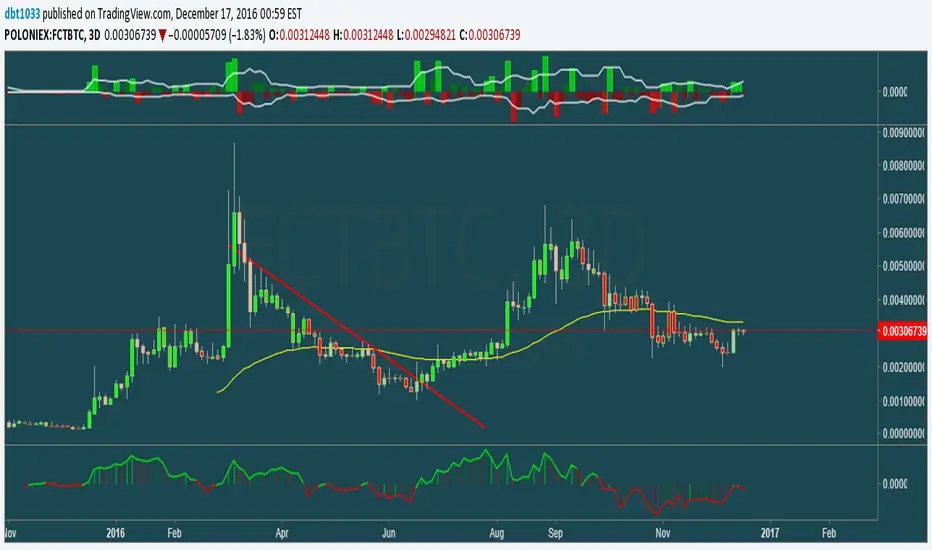

Relative Price Difference [LAVA]EDIT: Look below for updates to the script.
EDIT: After several updates to this script, I think it's safe to say it will work with all timelines. Using hand drawn trendlines, it can predict tops and bottoms with pretty good accuracy.
Shows a change in the relative price difference via percentage on a 0 horizontal. Added a bollinger band to help identify weak areas (orange). If orange starts showing, the current price direction is strong but can reverse harshly. If you are in a weak position, exit here. Otherwise, don't enter a trade after/during orange sessions until a full cycle (up/dn > 1% without orange) has completed. The main line indicator fluctuates according to the price difference. 1% horizontal lines are added to help identify profit taking spots or OTE zones. Ensure the 1% line is crossed completely before you decide to enter/exit. Cross points are identified with crosses if you missed your window, this is the last spot to exit, enter. This indicator doesn't work that well with small time intervals. As always, use more than one indicator to ensure your decision is right. (The colors are ugly so change them if you wish! :)
Advanced Scalping Navigator free by S B PrasadAdvanced Scalping Navigator Lite • Features
by S B Prasad
Advanced Scalping Navigator Lite is a powerful multi-factor scalping and intraday indicator designed to generate high-probability BUY and SELL signals using trend, momentum, volatility, and smart-money concepts.
This FREE version retains the complete core signal engine while limiting certain premium visual and channel features.
🚀 Core Features (Included in Lite Version)
✅ High-Accuracy BUY & SELL Signals
Signals are generated only when multiple technical and structural conditions align, including:
ATR-based trend direction & strength
EMA trend bias
MACD momentum
RSI confirmation
VWAP institutional bias
Ribbon & Hull MA filters
Higher-timeframe (HTF) trend confirmation
Smart-money liquidity sweep validation
Supply & demand zone filtering
Session-based trading filter
✅ Smart-Money Liquidity Sweeps
Detects equal highs/lows and stop-hunt behavior to identify institutional accumulation or distribution before issuing signals.
✅ Supply & Demand Zones
Automatically plots demand and supply zones using pivot-based market structure to improve trade location quality.
✅ Higher-Timeframe (HTF) Confirmation
Filters trades in the direction of the dominant higher-timeframe trend for better probability alignment.
✅ Session Filter (Market Timing Control)
Limits signals to selected market sessions:
Indian Market
London Session
New York Session
✅ Multi-Factor Confirmation Engine
Combines EMA, MACD, RSI, VWAP, Ribbon, and HMA into a weighted factor score to avoid low-quality trades.
✅ Real-Time Dashboard Panel
On-chart dashboard displaying:
Trend direction
Trend strength
Factor alignment score
HTF bias
Zone context
Signal state
Session status
🔒 Features Limited or Disabled in Lite Version
The following premium visuals and channels are not available in the FREE version:
❌ ATR trendline (dynamic support / resistance)
❌ ATR trendline strength coloring
❌ Full ATR channel (upper / average / lower)
❌ Channel fills & premium visual layers
❌ Pivot ATR trend channel visuals
❌ Enhanced trend-zone background fills
🎯 Best For
Intraday traders
Scalpers
Index & stock traders
Futures and options traders
Traders who prefer clean charts with powerful signals
📣 Join Our Telegram (Updates & PRO Access)
👉 Telegram: t.me
💬 For updates, support & PRO version access, join our Telegram.
⚠️ Disclaimer
This indicator is for educational and informational purposes only.
It does not constitute financial advice.
Trading involves risk. Always use proper risk management.

moving_averages# MovingAverages Library - PineScript v6
A comprehensive PineScript v6 library containing **50+ Moving Average calculations** for TradingView.
---
## 📦 Installation
```pinescript
import TheTradingSpiderMan/moving_averages/1 as MA
```
---
## 📊 All Available Moving Averages (50+)
### Basic Moving Averages
| Function | Selector Key | Description |
| -------- | ------------ | ------------------------------------------ |
| `sma()` | `SMA` | Simple Moving Average - arithmetic mean |
| `ema()` | `EMA` | Exponential Moving Average |
| `wma()` | `WMA` | Weighted Moving Average |
| `vwma()` | `VWMA` | Volume Weighted Moving Average |
| `rma()` | `RMA` | Relative/Smoothed Moving Average |
| `smma()` | `SMMA` | Smoothed Moving Average (alias for RMA) |
| `swma()` | - | Symmetrically Weighted MA (4-period fixed) |
### Hull Family
| Function | Selector Key | Description |
| -------- | ------------ | ------------------------------- |
| `hma()` | `HMA` | Hull Moving Average |
| `ehma()` | `EHMA` | Exponential Hull Moving Average |
### Double/Triple Smoothed
| Function | Selector Key | Description |
| -------------- | ------------ | --------------------------------- |
| `dema()` | `DEMA` | Double Exponential Moving Average |
| `tema()` | `TEMA` | Triple Exponential Moving Average |
| `tma()` | `TMA` | Triangular Moving Average |
| `t3()` | `T3` | Tillson T3 Moving Average |
| `twma()` | `TWMA` | Triple Weighted Moving Average |
| `swwma()` | `SWWMA` | Smoothed Weighted Moving Average |
| `trixSmooth()` | `TRIXSMOOTH` | Triple EMA Smoothed |
### Zero/Low Lag
| Function | Selector Key | Description |
| --------- | ------------ | ----------------------------------- |
| `zlema()` | `ZLEMA` | Zero Lag Exponential MA |
| `lsma()` | `LSMA` | Least Squares Moving Average |
| `epma()` | `EPMA` | Endpoint Moving Average |
| `ilrs()` | `ILRS` | Integral of Linear Regression Slope |
### Adaptive Moving Averages
| Function | Selector Key | Description |
| ---------- | ------------ | ------------------------------- |
| `kama()` | `KAMA` | Kaufman Adaptive Moving Average |
| `frama()` | `FRAMA` | Fractal Adaptive Moving Average |
| `vidya()` | `VIDYA` | Variable Index Dynamic Average |
| `vma()` | `VMA` | Variable Moving Average |
| `vama()` | `VAMA` | Volume Adjusted Moving Average |
| `rvma()` | `RVMA` | Rolling VMA |
| `apexMA()` | `APEXMA` | Apex Moving Average |
### Ehlers Filters
| Function | Selector Key | Description |
| ----------------- | --------------- | --------------------------------- |
| `superSmoother()` | `SUPERSMOOTHER` | Ehlers Super Smoother |
| `butterworth2()` | `BUTTERWORTH2` | 2-Pole Butterworth Filter |
| `butterworth3()` | `BUTTERWORTH3` | 3-Pole Butterworth Filter |
| `instantTrend()` | `INSTANTTREND` | Ehlers Instantaneous Trendline |
| `edsma()` | `EDSMA` | Deviation Scaled Moving Average |
| `mama()` | `MAMA` | Mesa Adaptive Moving Average |
| `fama()` | `FAMAVAL` | Following Adaptive Moving Average |
### Laguerre Family
| Function | Selector Key | Description |
| -------------------- | ------------------ | ------------------------ |
| `laguerreFilter()` | `LAGUERRE` | Laguerre Filter |
| `adaptiveLaguerre()` | `ADAPTIVELAGUERRE` | Adaptive Laguerre Filter |
### Special Weighted
| Function | Selector Key | Description |
| ---------- | ------------ | -------------------------------- |
| `alma()` | `ALMA` | Arnaud Legoux Moving Average |
| `sinwma()` | `SINWMA` | Sine Weighted Moving Average |
| `gwma()` | `GWMA` | Gaussian Weighted Moving Average |
| `nma()` | `NMA` | Natural Moving Average |
### Jurik/McGinley/Coral
| Function | Selector Key | Description |
| ------------ | ------------ | --------------------- |
| `jma()` | `JMA` | Jurik Moving Average |
| `mcginley()` | `MCGINLEY` | McGinley Dynamic |
| `coral()` | `CORAL` | Coral Trend Indicator |
### Mean Types
| Function | Selector Key | Description |
| -------------- | ------------ | ------------------------- |
| `medianMA()` | `MEDIANMA` | Median Moving Average |
| `gma()` | `GMA` | Geometric Moving Average |
| `harmonicMA()` | `HARMONICMA` | Harmonic Moving Average |
| `trimmedMA()` | `TRIMMEDMA` | Trimmed Moving Average |
| `cma()` | `CMA` | Cumulative Moving Average |
### Volume-Based
| Function | Selector Key | Description |
| --------- | ------------ | -------------------------- |
| `evwma()` | `EVWMA` | Elastic Volume Weighted MA |
### Other Specialized
| Function | Selector Key | Description |
| ----------------- | --------------- | --------------------------- |
| `hwma()` | `HWMA` | Holt-Winters Moving Average |
| `gdema()` | `GDEMA` | Generalized DEMA |
| `rema()` | `REMA` | Regularized EMA |
| `modularFilter()` | `MODULARFILTER` | Modular Filter |
| `rmt()` | `RMT` | Recursive Moving Trendline |
| `qrma()` | `QRMA` | Quadratic Regression MA |
| `wilderSmooth()` | `WILDERSMOOTH` | Welles Wilder Smoothing |
| `leoMA()` | `LEOMA` | Leo Moving Average |
| `ahrensMA()` | `AHRENSMA` | Ahrens Moving Average |
| `runningMA()` | `RUNNINGMA` | Running Moving Average |
| `ppoMA()` | `PPOMA` | PPO-based Moving Average |
| `fisherMA()` | `FISHERMA` | Fisher Transform MA |
---
## 🎯 Helper Functions
| Function | Description |
| ---------------- | ------------------------------------------------------------- |
| `wcp()` | Weighted Close Price: (H+L+2\*C)/4 |
| `typicalPrice()` | Typical Price: (H+L+C)/3 |
| `medianPrice()` | Median Price: (H+L)/2 |
| `selector()` | **Master selector** - choose any MA by string name |
| `getAllTypes()` | Returns all supported MA type names as comma-separated string |
---
## 🔧 Usage Examples
### Basic Usage
```pinescript
//@version=6
indicator("MA Example")
import quantablex/moving_averages/1 as MA
// Simple calls
plot(MA.sma(close, 20), "SMA 20", color.blue)
plot(MA.ema(close, 20), "EMA 20", color.red)
plot(MA.hma(close, 20), "HMA 20", color.green)
```
### Using the Selector Function (50+ MA Types)
```pinescript
//@version=6
indicator("MA Selector")
import quantablex/moving_averages/1 as MA
// Full list of all supported types:
// SMA,EMA,WMA,VWMA,RMA,SMMA,HMA,EHMA,DEMA,TEMA,TMA,T3,TWMA,SWWMA,TRIXSMOOTH,
// ZLEMA,LSMA,EPMA,ILRS,KAMA,FRAMA,VIDYA,VMA,VAMA,RVMA,APEXMA,SUPERSMOOTHER,
// BUTTERWORTH2,BUTTERWORTH3,INSTANTTREND,EDSMA,LAGUERRE,ADAPTIVELAGUERRE,
// ALMA,SINWMA,GWMA,NMA,JMA,MCGINLEY,CORAL,MEDIANMA,GMA,HARMONICMA,TRIMMEDMA,
// EVWMA,HWMA,GDEMA,REMA,MODULARFILTER,RMT,QRMA,WILDERSMOOTH,LEOMA,AHRENSMA,
// RUNNINGMA,PPOMA,MAMA,FAMAVAL,FISHERMA,CMA
maType = input.string("EMA", "MA Type", options= )
length = input.int(20, "Length")
plot(MA.selector(close, length, maType), "Selected MA", color.orange)
```
### Advanced Moving Averages
```pinescript
//@version=6
indicator("Advanced MAs")
import quantablex/moving_averages/1 as MA
// ALMA with custom offset and sigma
plot(MA.alma(close, 20, 0.85, 6), "ALMA", color.purple)
// KAMA with custom fast/slow periods
plot(MA.kama(close, 10, 2, 30), "KAMA", color.teal)
// T3 with custom volume factor
plot(MA.t3(close, 20, 0.7), "T3", color.yellow)
// Laguerre Filter with custom gamma
plot(MA.laguerreFilter(close, 0.8), "Laguerre", color.lime)
```
---
## 📈 MA Selection Guide
| Use Case | Recommended MAs |
| ---------------------- | ------------------------------------------- |
| **Trend Following** | EMA, DEMA, TEMA, HMA, CORAL |
| **Low Lag Required** | ZLEMA, HMA, EHMA, JMA, LSMA |
| **Volatile Markets** | KAMA, VIDYA, FRAMA, VMA, ADAPTIVELAGUERRE |
| **Smooth Signals** | T3, LAGUERRE, SUPERSMOOTHER, BUTTERWORTH2/3 |
| **Support/Resistance** | SMA, WMA, TMA, MEDIANMA |
| **Scalping** | MCGINLEY, ZLEMA, HMA, INSTANTTREND |
| **Noise Reduction** | MAMA, EDSMA, GWMA, TRIMMEDMA |
| **Volume-Based** | VWMA, EVWMA, VAMA |
---
## ⚙️ Parameters Reference
### Common Parameters
- `src` - Source series (close, open, hl2, hlc3, etc.)
- `len` - Period length (integer)
### Special Parameters
- `alma()`: `offset` (0-1), `sigma` (curve shape)
- `kama()`: `fastLen`, `slowLen`
- `t3()`: `vFactor` (volume factor)
- `jma()`: `phase` (-100 to 100)
- `laguerreFilter()`: `gamma` (0-1 damping)
- `rema()`: `lambda` (regularization)
- `modularFilter()`: `beta` (sensitivity)
- `gdema()`: `mult` (multiplier, 2 = standard DEMA)
- `trimmedMA()`: `trimPct` (0-0.5, percentage to trim)
- `mama()/fama()`: `fastLimit`, `slowLimit`
- `adaptiveLaguerre()`: Uses `len` for adaptation period
---
## 📝 Notes
- All 50+ functions are exported for use in any PineScript v6 indicator/strategy
- The `selector()` function supports **all MA types** via string key
- Use `getAllTypes()` to get a comma-separated list of all supported MA names
- Some MAs (CMA, INSTANTTREND, LAGUERRE, MAMA) don't use `len` parameter
- Use `nz()` wrapper if handling potential NA values in your calculations
---
**Author:** thetradingspiderman
**Version:** 1.0
**PineScript Version:** 6
**Total MA Types:** 50+

Adaptive Market Structure Channel By S B PrasadAdaptive Market Structure Channel (AMSC)
Institutional-Grade Trend, Volatility & Liquidity Framework
Overview
The Adaptive Market Structure Channel (AMSC) is a multi-engine, adaptive trading framework designed to read market structure, volatility, liquidity, and trend strength in real time.
It integrates ATR-based channels, pivot structure, supply–demand zones, liquidity sweeps, multi-factor momentum, and higher-timeframe confirmation into a single, coherent visual system.
AMSC is not a single-indicator strategy.
It is a context-driven decision framework intended to help traders align entries with dominant trend, structural levels, and institutional activity.
Core Components
1️⃣ Adaptive ATR Trend Channel
Dynamic ATR-based support & resistance
Automatically adjusts to volatility
Color-coded trend strength (strong / weak regimes)
Acts as the primary trend bias filter
2️⃣ Pivot-Based ATR Trend Channels
Channels built from confirmed pivot highs and lows
ATR-expanded structure, not fixed slopes
Separates impulse moves from corrections
Useful for trend continuation and pullback trades
3️⃣ Market Structure: Supply & Demand Zones
Automatically plots fresh demand and supply zones
Zones extend forward until violated
Helps identify high-probability reaction areas
Used as a location filter, not a standalone signal
4️⃣ Liquidity Sweep Detection (Smart Money Logic)
Identifies equal high / equal low liquidity pools
Detects stop-hunt style sweeps
Validates sweeps only when price reacts from structure zones
Prevents chasing false breakouts
5️⃣ Multi-Factor Trend Confirmation Engine
Combines:
EMA structure
MACD momentum
RSI regime
VWAP positioning
Optional ribbon & HMA filters
Signals are generated only when a majority of factors align, avoiding single-indicator bias.
6️⃣ Volatility Context (Bollinger Bands)
Provides volatility expansion / contraction context
Helps distinguish trend continuation vs compression
Works as a background regime filter
7️⃣ Higher Timeframe Confirmation
Confirms trend using a user-selected HTF
Prevents counter-trend trades during strong HTF bias
Essential for intraday and swing traders
8️⃣ Session-Aware Trading
Optional India, London, and New York session filters
Signals only during active market participation
Avoids low-liquidity false signals
9️⃣ Professional Dashboard
Real-time display of:
Trend direction
Trend strength
Factor alignment
HTF bias
Active zone
Trade signal
Session status
Designed for quick decision-making, not clutter.
How to Use AMSC (Best Practice)
✔ Trade in the direction of the ATR trend
✔ Enter near demand/supply within the channel
✔ Confirm with factor alignment & HTF bias
✔ Use liquidity sweeps as entry triggers, not signals alone
✔ Avoid trades during low-strength or inactive sessions
AMSC performs best when used as a confluence system, not a mechanical entry-exit robot.
Ideal Use Cases
Intraday index trading
Swing trading in trending markets
Futures & FX structure-based trading
Traders who prefer context over indicators
What AMSC Is NOT
❌ Not a scalping toy
❌ Not a repainting indicator
❌ Not a one-click signal generator
It is built for disciplined traders who understand structure and risk.
Final Note
AMSC is designed to think like the market, not predict it.
Use it to read conditions, not chase signals.
MSC — BEST CLEAN SETUP (RECOMMENDED)
🎯 Design Philosophy
“Context first, signals last.”
The goal is to:
Read trend & structure at a glance
Avoid indicator overload
Let price + zones + channel do the heavy lifting
1️⃣ CORE VISUALS (KEEP ON)
These are non-negotiable.
🔹 Adaptive ATR Trend Channel
✅ ON
Primary trend bias
Use ATR Trendline Color = ON
This alone defines:
Bull vs Bear
Strength vs weakness
👉 If price is above channel → bullish context
👉 If price is below channel → bearish context
🔹 Pivot ATR Trend Channel
✅ ON
Channel fill: ON
Transparency ≥ 85
Purpose:
Visualise trend slope
Spot pullbacks inside trend
👉 Treat channel edges as dynamic structure, not entry signals.
🔹 Supply & Demand Zones
✅ ON
Transparency: 80–85
Zones auto-expire visually when violated
👉 These are your only horizontal levels.
2️⃣ SMART FILTERS (SELECTIVE)
💧 Liquidity Sweep
✅ ON
Lookback: 5
Tolerance: 0.15 ATR
👉 Use sweeps only near zones
❌ Ignore sweeps in the middle of nowhere
⏱ Session Filter
✅ ON
Trade only one session
India (for NSE)
London (for FX)
New York (for US indices)
❌ Do NOT enable multiple sessions simultaneously
🔍 Higher Timeframe (HTF)
✅ ON
Intraday: Daily
Swing: Weekly
👉 If HTF disagrees → no trade
3️⃣ WHAT TO TURN OFF (CRITICAL)
This is where clutter dies.
❌ Bollinger Bands
🚫 OFF by default
Use only when studying volatility compression
Otherwise adds visual noise
❌ Full ATR Channel (Ver 15)
🚫 OFF
Redundant with pivot + ATR trend
Keep only one channel logic
❌ SuperTrend Channel
🚫 OFF
ATR Trend Channel already covers this
❌ Pivot Levels (P, R1, S1…)
🚫 OFF
Zones replace static pivots
Too many horizontal lines = paralysis
❌ Previous Day / Week Levels
🚫 OFF
Turn ON only for index option trading
Otherwise clutter
4️⃣ MOVING AVERAGES (STRICT RULE)
Keep ONLY:
EMA Fast (9)
EMA Slow (21)
Optional:
HMA → ON only for scalping
❌ Do NOT stack multiple MAs visually
5️⃣ DASHBOARD (MINIMAL MODE)
🧭 Dashboard
✅ ON
Position: Top Right
Text Size: Small
Watch only:
Trend
Strength
HTF
Zone
Signal
Ignore factor numbers once confidence develops.
6️⃣ SIGNAL USAGE (DISCIPLINE RULE)
✔ Signal must appear inside a zone
✔ Signal must align with trend & HTF
✔ Signal must be during session
❌ Never take:
Signals mid-channel
Signals against HTF
Signals during flat strength (<30%)
7️⃣ RECOMMENDED PRESETS (COPY THIS)
🔹 Intraday (Clean)
Timeframe: 5m / 15m
HTF: Daily
Session: India / NY
BB: OFF
Full ATR: OFF
SuperTrend: OFF
Pivots: OFF
🔹 Swing (Ultra Clean)
Timeframe: 1H / 4H
HTF: Weekly
Liquidity: ON
Zones: ON
Dashboard: ON (small)
8️⃣ GOLDEN RULE (MOST IMPORTANT)
If you cannot explain the trade using only:
Trend channel
One zone
One sweep
Do not trade it.
🏁 FINAL VERDICT
AMSC is not cluttered by design.
Clutter comes from turning everything ON.
Used correctly:
The chart stays clean
Decisions become obvious
Overtrading disappears
AMSC – TRADE EXECUTION RULEBOOK
Framework rule:
Trend → Structure → Liquidity → Entry → Risk → Exit
1️⃣ MARKET PRE-CONDITIONS (MANDATORY)
❌ NO TRADE unless ALL are TRUE
✅ Trend Filter
ATR Trend Channel = Bull for longs / Bear for shorts
Trend strength ≥ 40%
Price must be on the correct side of the channel
✅ HTF Confirmation
HTF bias must match LTF trend
If HTF is neutral → NO TRADE
✅ Session Filter
Trade only during active session
No first 5 minutes after session open
No last 15 minutes before session close
2️⃣ LOCATION RULE (MOST IMPORTANT)
🔹 Long Trades
Price must be inside or just above a DEMAND zone
Zone must be:
Fresh (not tested more than twice)
Within the Pivot ATR Channel
🔹 Short Trades
Price must be inside or just below a SUPPLY zone
Same freshness rules apply
❌ No zone → no trade
3️⃣ LIQUIDITY CONFIRMATION (ENTRY TRIGGER)
🔹 Long Entry Trigger
At the demand zone, you must see:
✔ Sell-side liquidity sweep
✔ Sweep candle closes bullish
✔ Sweep occurs inside the zone
🔹 Short Entry Trigger
At the supply zone, you must see:
✔ Buy-side liquidity sweep
✔ Sweep candle closes bearish
✔ Sweep occurs inside the zone
4️⃣ ENTRY RULE (EXECUTION)
🔵 LONG ENTRY
Enter BUY when all conditions align and:
Enter at:
Close of the sweep candle OR
50% retrace of the sweep candle (preferred)
🔴 SHORT ENTRY
Enter SELL when:
Enter at:
Close of the sweep candle OR
50% retrace of the sweep candle
5️⃣ STOP-LOSS RULES (NON-NEGOTIABLE)
🔻 Long SL
Place SL at:
Lowest point of the demand zone
OR
Below sweep low − 0.1 ATR (whichever is lower)
🔺 Short SL
Place SL at:
Highest point of the supply zone
OR
Above sweep high + 0.1 ATR (whichever is higher)
❌ Never trail SL early
❌ Never move SL to break-even before partial exit
6️⃣ POSITION SIZE (FIXED RISK ONLY)
Risk per trade: 0.5% – 1% max
If SL distance is large → reduce position size
Do not widen SL to fit position
7️⃣ EXIT RULES (STRUCTURED)
🎯 TARGET 1 (T1 – Protection)
At 1R
Action:
Book 50%
Move SL to Break-Even
🎯 TARGET 2 (T2 – Structure)
Next opposite zone
OR
Pivot ATR Channel mid-line
Book 30%
🎯 FINAL EXIT (TREND FOLLOW)
Exit remaining 20% when:
✔ Opposite liquidity sweep occurs
✔ Price closes beyond Pivot ATR Channel
✔ HTF bias flips
✔ Session ends
8️⃣ NO-TRADE CONDITIONS (ABSOLUTE)
❌ Trend strength < 30%
❌ Zone already tested 3+ times
❌ Liquidity sweep outside zone
❌ Entry candle is oversized (>1.8 ATR)
❌ Trade against HTF
❌ Emotional or revenge trade
9️⃣ ONE-SCREEN TRADE CHECKLIST
Before clicking BUY/SELL:
✔ Trend aligned
✔ HTF aligned
✔ In session
✔ At zone
✔ Sweep confirmed
✔ SL defined
✔ R ≥ 2 possible
If any answer = NO → skip trade
🔒 DISCIPLINE STATEMENT (PRINT THIS)
AMSC does not pay for activity.
It pays for patience, location, and discipline.
🏁 EXPECTED PERFORMANCE (REALISTIC)
Win rate: 45–60%
R:R average: 1:2.5 to 1:4
Drawdown: low
Trade frequency: selective
Adaptive Market Structure Channel — Visual Layout
5
🧭 How to READ the Chart (Left → Right)
1️⃣ Core Trend Context (FIRST thing your eyes see)
ATR Trend Channel
Acts as dynamic support/resistance
Green = bullish regime
Red = bearish regime
No second trendline competing with it
👉 If price is on the wrong side → no trade
2️⃣ Pivot ATR Structure Channel (SECOND layer)
Sloping channel following real swing structure
Shows:
Trend acceleration
Healthy pullbacks
Channel fill is very light (high transparency)
👉 Pullbacks inside this channel are valid
👉 Breaks outside = caution / exit
3️⃣ Supply & Demand Zones (ONLY horizontal objects)
Few, wide, soft-colored zones
No pivot clutter, no fibs, no grids
👉 Trades happen only here
4️⃣ Liquidity Sweep Markers (EVENT-BASED)
Appears only near zones
Indicates stop-hunt, not entry by itself
👉 Sweep + zone + trend = setup
👉 Sweep alone = ignore
5️⃣ Dashboard (Decision Support, not distraction)
Small
Corner-placed
Shows only:
Trend
Strength
HTF bias
Zone
Signal
Session
👉 After experience, you’ll barely look at it
🚫 What You DO NOT See (Very Important)
A clean AMSC chart intentionally avoids:
Multiple moving averages
Pivot levels (P/R/S)
Too many channels
Oscillator panels
Bright fills or thick lines
If your chart looks “busy”, something is ON that should be OFF.
🧠 Mental Model (Keep This Image in Mind)
AMSC chart =
1 dynamic trend
1 structure channel
1 zone
1 liquidity event
1 decision
Anything more → clutter
Anything less → blind trading
✅ Final Visual Checklist (Before Trading)
✔ Chart background visible
✔ Candles clearly readable
✔ Zones visible but not loud
✔ Channel guides the eye
✔ Nothing overlaps price excessively
If yes → you are trading AMSC correctly
