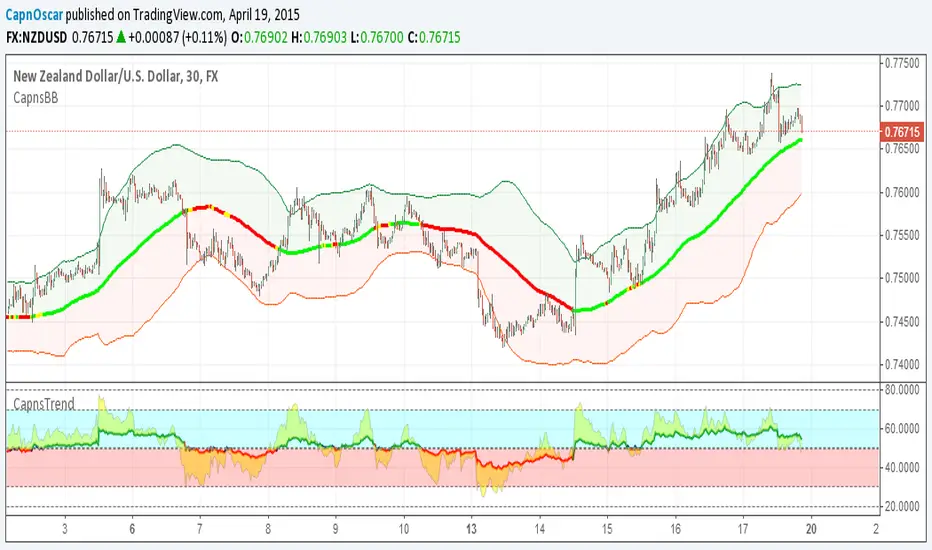
Patient Trendfollower (7)(alpha)Patient Trendfollower consists of 21 and 55 EMA, Commodity Channel Index and Supertrend indicator. It confirms a trend and gives you a signal on a pullback. Original creation worked on 1h EURUSD chart.
►Long setup:
• 21 EMA is above 55 EMA, which is above the Supertrend indicator.
• Commodity Channel Index is an oscillator, which prints into the chart if extreme levels are reached. Green is for a level above 100 or below -100, red is above 140 or below -140 and black is above 180 or below -180.
• If 21 EMA > 55EMA > Supertrend and an oversold signal appear, you can buy into the trend.
• When backtesting on 1h EURUSD, profit target 400 pips worked best with a stop-loss below Supertrend's bottom and the size of your spread.
• A picture shows two valid entries.
: This part still malfunctions and shows red dots over some green ones. It is important to disable red ones in the settings to see green ones.
Some more long signals:
Some short signals:
►Backtesting data with default settings and trading only green CCI signals with mentioned risk management strategy:
• 212 closed trades
• 58.96% profitable with average win trade 348 USD and average loss trade 263 USD when only green signals are followed.
• Profit factor 1.903, Sharpee 0.792
• 20 bars is average for all trades, short trades were 18 bars long on average.
With given data, you can see the strategy is profitable by itself. However, original risk management settings do work only on 1h charts of EURUSD and would need to be adjusted for other instruments based on average volatility.
Even though the profitability is low, you can increase your odds by a great margin, if you properly use price action (impulsive and corrective moves, patterns, bar analysis), if you trade when major exchanges are open, you may also use wave analysis such as Elliot Waves or Market Profiles to predict whether the next day might be a trending day. My backtesting program didn't consider these ideas.
Unfortunately, I won't be making backtesting strategy public with it anytime soon, because it still has some parts that do not work. I am ok with that since I understand the code and know what does malfunction and how. Then, there are parts which I am not sure how to fix yet. This is why the indicator is still considered alpha.
In the future when a strategy is published, you will also be able to set your own overbought/oversold values without entering the code itself and probably some other features. But I am not in a hurry for that. You can give me feedback on UX and try to figure out the best setups for other symbols, it might help to improve the automatic testing script when I know what I should achieve. My main point is to make this public for friends who can already be using it on EURUSD at least.
Close doesn't always have to be 400 pips, you might want to close on a logical level such as strong resistance or a trendline too.
Thanks to:
• @everget for providing Supertrend solution.
• Satik FX who hand-tested the system by hand and reported results in this article . He is my main inspiration for creating the complete indicator as one because I want to be able to show and hide it with a single click. My future scripts will also work as a whole strategy each by itself.
• The number in the script's name comes from Satik's numbering. A mentioned article was his seventh shared strategy.
Search in scripts for "trendline"

super Z Ok I try to make this indicator to be a super trend based on candles MTF , need to be warned that it can repaint , I did not had time to check this issue so i post it as idea only (if such issue exist let me know )
the trendline is not repaint based on VHMA (or volume HMA ) that i posted last time
So it a cool idea to make the supertrend in this way ,but need to be tested further
signals are based on this supertrend

Voss Strategy (Filter + Trend Indicator) [Bitduke]Created strategy based on Voss Predictive Filter, implemented by TradingView user e2e4mfck.
Voss Predictive Filter
This is a relatively new filter from John F. Ehlers’ article, “A Peek Into The Future .” Ehlers describes the calculation of a new filter that could help signal cyclical turning points in markets.
But filter has a negative group delay and while an indicator based on it cannot actually see into the future, it may provide the trader with signals in advance of other indicators.
In mentioned article he tested filter on SPY and at one point in time "it went into a trend mode in January 2019, and the cycle signal failed miserably, signaling a short position during the runup. <...> The only way to minimize the impact of this condition is to employ an additional trend detector."
Thus I've added another Ehlers' based trend based indicator Instantaneous Trendline (thanks to LazyBear for implementation) to minimize the impact of the trend mode and got a good results on XBTUSD pair 4h.
Backtest :
> Range: 2016 - 2020
> XBTUSD
> 4h
> ~20% drawdown
> Sharpe (0.361, not too impressive)
I think it can be improved with Risk Management system and experimenting with various trend following indicators.

Customizable MACD (how to detect a strong convergence)Helloooo traders
I wondered once if a MACD was based on an EMA/EMA/SMA or SMA/SMA/EMA (or WHATEVA/WHATEVA/WHATEVA).
Seems they're so many alternatives out there.
I decided to empower my audience more by choosing the type of moving averages you want for your MACD.
More options doesn't always mean better performance - but who knows - some might find a config that they like with it for their favorite asset/timeframe.
I added also a multi-timeframe component because I'm a nice guy ^^
Convergence is my BEST friend
An oscillator (like MACD) is to measure how strong a momentum is - generally, traders use those indicators to confirm a trend.
So understand that a MACD (or any other indicator not based on convergence ) won't likely be sufficient for doing great on the market.
Combined with your favorite indicator, however, you may get great results.
My indicators fav cocktail is mixing :
1) an oscillator (momentum confirmation)
2) a trendline/key level break (momentum confirmation)
3) adding-up on a different trading method but still converging with the first entry.
The reason I'm deep with convergence detection is because I'm obsessed with removing those fakeout signals. You know which ones I'm talking about :)
Those trades when the market goes sideways but our capital goes South (pun 100% intended) - 2 days later, the price hasn't changed much but some lost some capital due to fees, being overexposed, buying the top/selling the bottom of a range they didn't identify.
It's publicly known that ranges are the worst traders' enemy. It's boring, not fun, and .... end up moving in the direction we expected when we go to sleep or outside.
NO ONE/BROKER/EX-GF is tracking your computer - I checked also for mine as it happened for me way too often in the past.
I surely preferred blaming a few external unknown conditions than improving my TA back in the days #bad #dave
But my backtest sir...
Our backtests show what they're being told to show . A backtest without a stop-loss/hard exit logic will show incredible results.
Then trying that backtest with live trading is like in the Matrix movie - discovering the real world is tough and we must choose between the blue pill (learning how to evaluate properly risk/opportunity caught) and the red pill (increasing the position sizing, not setting a stop loss, holding the positions hoping for the best)
Last few words
Convergences aren't invented because it's cool to mix indicators with others. (it is actually and even fun)
They're created to remove most of the fakeouts . For those that can't be removed - a strong risk management would cut most of the remaining potential big losses.
No system works 100% of the time - so a convergence system needs a back-up plan in case the converged signal is wrong (could be stop-loss, hard exit, reducing position sizing, ...)
Wishing you the BEST and happy beginning of your week
Daveatt

Mawreez' Aggregated DivergencesAutomatically detect regular and hidden divergences in multiple oscillators and visualize them through creative use of the histogram plot. I've open-sourced the code behind the indicator so that any user or their tech-savvy friend may easily add more oscillators of their choice.
Known bugs:
When two divergences occur within the same lookback period, only the first one is found.
There is some overhead when searching for tops and bottoms.
The oscillator and price source are still allowed to cross the trendline connecting their respective tops and bottoms.
Planned features:
Some mechanism to warn for divergences which are still awaiting confirmation.
More sophisticated method for finding tops and bottoms.

RSI + Composite Index [SHK]One of the most powerful indicator based and divergence strategies i have ever seen was made by Constance Brown.
The Composite Index:
The best way to think of the Composite Index as it applies to the RSI is to think of the RSI as Windows 3.0 and the Composite Index as Windows 10. Constance Brown discovered that the RSI, while it does create and detect divergences, does is not as accurate as it could be. It’s a bit of an oxymoron to say this but the RSI is a momentum indicator without any momentum calculation attached to it. The RSI actually misses a significant amount of important moves and even generates some bad moves. What Constance Brown did with the RSI is to input a momentum calculation within the RSI itself.
Usage:
1. Check hidden and regular divergences on RSI+COMPOSITE_INDEX and PRICE+COMPOSITE_INDEX.
2. After finding divergence wait for COMPOSITE_INDEX to cross under/over it's moving averages to trigger.
Useful Note:
"RSI overbought/oversold as filter", "RSI and COMPOSITE_INDEX trendline as trigger", "RSI 50 Over/Under as trend direction detection", ... can be add to this strategy.
Enjoy!

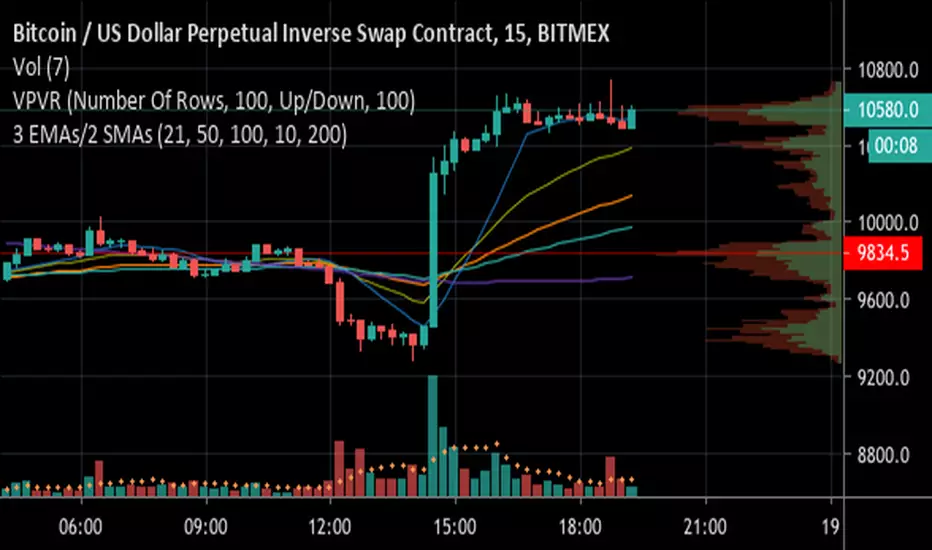
3 EMAs with Crossing Alerts & 2 SMAsHi all,
This is a simple indicator that plots 3 EMA lines and 2MAs of your choice to the screen and has built in alert triggers.
Features:
1) Alerts are triggered when EMAs 1 (Signal line) and 2 (Baseline) cross - a Long signal is called if the cross is above EMA 3 ( Trendline ), a short if the cross is below EMA3
2) Signals are represented visually as a triangle on the chart, below the candles is a long, above is a short
3) TradingView Alerts can be easily set as I have labelled the signals clearly as many other Indicators like this aren’t easy to work out if trying to create alerts to trigger a 3commas bot, for example!
Each EMA is fully customisable and if you wish to take advantage of the alerts, only a few simple rules need to be followed:
EMA1 needs to be less than EMA2.
EMA2 needs to be the same or greater than EMA3
That’s it, happy trading!
Fractal Adaptive Moving Averagewww.stockspotter.com
www.stockspotter.com
www.stockspotter.com
Here we measure the "fractal dimension" in order to differentiate periods of consolidation and trend. The trendline will run relatively flat during ranging price movement and quickly follow trending price action.

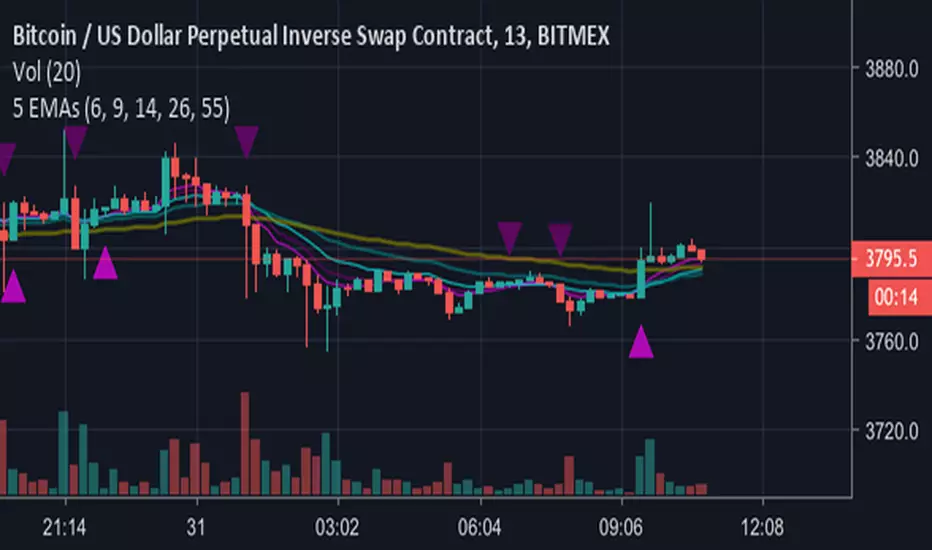
5 EMAs plus Crossing AlertsHi all,
This is a simple indicator that plots 5 EMA lines of your choice to the screen.
Can be used to trigger scalping Bots (stoploss around 0.5% recommended, take profit 1% or higher, please backtest!)
Also can be used for manual scalping, 1 or 2 candles at a time.
Features:
1) Alerts are triggered when EMAs 1 (Signal line) and 2 (Baseline) cross - a Long signal is called if the cross is above EMA 3 (Trendline), a short if the cross is below EMA3
2) Signals are represented visually as a triangle on the chart, below the candles is a long, above is a short
3) TradingView Alerts can be easily set as I have labelled the signals clearly as many other Indicators like this aren’t easy to work out if trying to create alerts to trigger a 3commas bot, for example!
Each EMA is fully customisable and if you wish to take advantage of the alerts, only a few simple rules need to be followed:
EMA1 needs to be less than EMA2.
EMA2 needs to be the same or greater than EMA3
That’s it, happy trading!
Big shout out to B and the gang over at Crypto Trading Group!
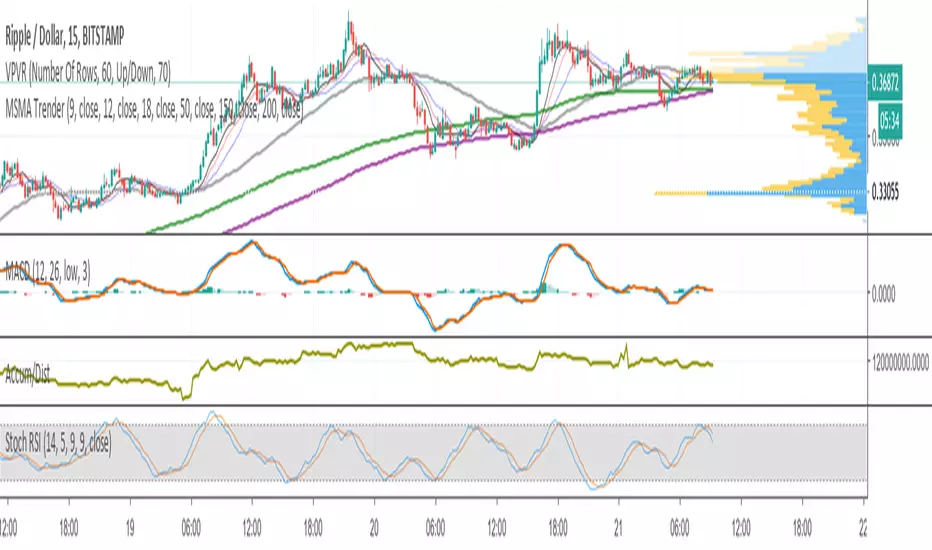
Multi-period Simple Moving Average trenderA plot of 6 SMA's grouped by 3's for short and long views of trading patterns.
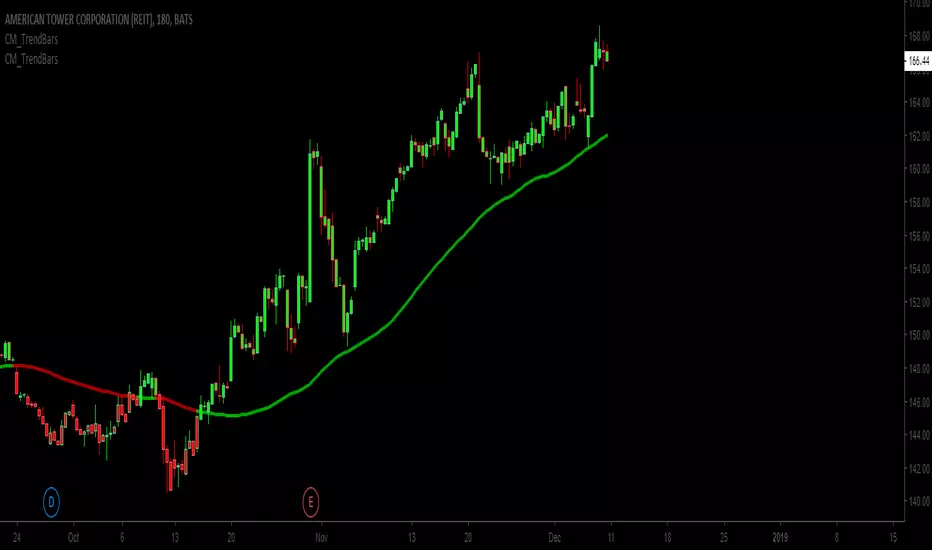
Trend bars with SMA trend linejust changing the colour of the candles based on a SMA trendline
Basic changes made to Chris Moody's trend bars setup
Third attempt by me to do this.
Stochastic MFI (vegeta)Stochastic MFI
Simple Stochastic version of Money Flow indicator
MFI > RSI?
MFI considers volume. Hence, provides more robust signals (most of the times)
How to use the indicator:
More trigger signals valid, more robust the buy/ sell signal
Buy Trigger:
1. Green stoch line direction >45deg up and crosses red stoch line
2. 3 consecutive Heiken Ashi green candles
3. Price is trending w/ established trendline
Sell Trigger:
1. Green stoch line direction <-45deg down and crosses red stoch line
2. 3 consecutive Heiken Ashi red candles
Works better when used on different timeframes (3D, 1D, 6H)
The more valid triggers on different timeframes, the better the signal
P.S:
Got any recommendation for changes? Or just wanna say Hi?
Hit me up on twitter at @vegetavarun
:)

Volume Pressure Composite Average with Bands by @XeL_ArjonaVOLUME PRESSURE COMPOSITE AVERAGE WITH BANDS
Ver. 1.0.beta.10.08.2015
By Ricardo M Arjona @XeL_Arjona
DISCLAIMER:
The Following indicator/code IS NOT intended to be a formal investment advice or recommendation by the author, nor should be construed as such. Users will be fully responsible by their use regarding their own trading vehicles/assets.
The embedded code and ideas within this work are FREELY AND PUBLICLY available on the Web for NON LUCRATIVE ACTIVITIES and must remain as is.
Pine Script code MOD's and adaptations by @XeL_Arjona with special mention in regard of:
Buy (Bull) and Sell (Bear) "Power Balance Algorithm" by :
Stocks & Commodities V. 21:10 (68-72):
"Bull And Bear Balance Indicator by Vadim Gimelfarb"
Adjusted Exponential Adaptation from original Volume Weighted Moving Average (VEMA) by @XeL_Arjona with help given at the @pinescript chat room with special mention to @RicardoSantos
Color Cloud Fill Condition algorithm by @ChrisMoody
WHAT IS THIS?
The following indicators try to acknowledge in a K-I-S-S approach to the eye (Keep-It-Simple-Stupid), the two most important aspects of nearly every trading vehicle: -- PRICE ACTION IN RELATION BY IT'S VOLUME --
A) My approach is to make this indicator both as a "Trend Follower" as well as a Volatility expressed in the Bands which are the weighting basis of the trend given their "Cross Signal" given by the Buy & Sell Volume Pressures algorithm. >
B) Please experiment with lookback periods against different timeframes. Given the nature of the Volume Mathematical Monster this kind of study is and in concordance with Price Action; at first glance I've noted that both in short as in long term periods, the indicator tends to adapt quite well to general price action conditions. BE ADVICED THIS IS EXPERIMENTAL!
C) ALL NEW IDEAS OR MODIFICATIONS to these indicator(s) are Welcome in favor to deploy a better and more accurate readings. I will be very glad to be notified at Twitter or TradingVew accounts at: @XeL_Arjona
Any important addition to this work MUST REMAIN PUBLIC by means of CreativeCommons CC & TradingView. --- All Authorship Rights RESERVED 2015 ---

[Bitcoin] Spot price vs Futures indicatorA handy script to detect opportunities in the futures market during extreme movement.
During rallies, futures usually tend to be US$10 above spot price, on the other hand it can be $1 below spot price when the price starts to decline.
You could also draw a trendline to it :) measuring the amount of risk people are willing to take just to predict future prices in the rally/decline.
Credits to lowstrife for the idea, I'm just implementing it :)
