Advanced Breakout System v2.0Advanced Breakout System v2.0
Developed by: Mohammed Bedaiwi
This script hunts for high-probability breakouts by combining price consolidation zones, volume spikes vs. average volume, smart money flow (OBV), and a Momentum Override for explosive moves that skip consolidation. Additionally, it automatically identifies and plots Support and Resistance levels with price labels to help you visualize market structure.
The system follows a "Watch & Confirm" logic: it first prints a WATCH setup, then a BUY only if price confirms strength.
💡 JUSTIFICATION OF CONCEPTS (MASHUP & ORIGINALITY)
This script is an original mashup combining several analytical concepts to address common breakout failures:
Volatility Compression Engine: Uses built-in functions like ta.highest() and ta.lowest() to mathematically define the setup phase where price volatility is compressed below a user-defined threshold.
Volume Spike Confirmation: The breakout must be confirmed by a volume increase greater than a moving average of volume, signaling strong market interest.
Smart Volume Filter (OBV): This is the key component. By checking if ta.obv is above its own Moving Average, we confirm that accumulation has been occurring during the consolidation period, suggesting institutional positioning before the price break.
Multi-Exit Risk System: Employs dynamic exits (EMA cross, volume dump, bearish pattern) instead of static stop-losses to manage risk adaptively based on real-time market action.
Market Structure Visualization: The script also includes a Support & Resistance engine to plot key swing pivots and price labels for visual context.
✅ STRATEGY RESULTS & POLICY COMPLIANCE
To ensure non-misleading and transparent backtesting results, this strategy is published with the following fully compliant properties:
Dataset Compliance: The backtest is performed on the CMTL Daily (1D) chart across a long history, generating 201 total trades. This significantly exceeds the minimum requirement of 100 trades, providing a robust test dataset.
Risk Control: The strategy uses a conservative order size set to 2% of equity (default_qty_value=2), strictly adhering to the sustainable risk recommendation of 5-10% of equity per trade.
Transaction Costs: Realistic trading conditions are modeled using 0.07% commission and 3 ticks slippage to prevent the overestimation of profitability.
⚙️ VISUAL GUIDE & SIGNAL LOGIC
Key Color Legend (Visual Guide):
WATCH – Setup (Yellow Arrow Down): Potential breakout setup detected.
BUY – Confirmation (Green Arrow Up): Confirmed breakout, triggered when price trades above the high of the WATCH candle.
SELL – Break (Orange Arrow): Short-term trend weakness, triggered when price closes below the Fast EMA (9).
SELL – Dump (Dark Red Arrow): Distribution / volume dump, triggered by a bearish candle with abnormally high volume.
SELL – Pattern (Purple Arrow): Bearish price-action pattern (such as a bearish engulfing).
Support & Resistance Lines (Red/Green): Small horizontal lines plotted at key swing points with exact price labels.
⌨️ INPUTS (DEFAULT SETTINGS)
Entry settings: Consolidation Lookback (default 20) = bars used to detect consolidation. Consolidation Range % (default 12%) = max allowed range size. Volume Spike Multiplier (default 1.2) = factor above average volume to count as a spike. Force Signal on Big Moves (default ON) = forces a WATCH signal on high-momentum moves.
Exit settings: Enable Fast Exit (EMA 9) toggles the SELL – Break signal. Dump Volume Multiplier defines what counts as “dump” volume.
Support & Resistance: Adjustable Pivot Left/Right bars control the sensitivity of the support and resistance lines.
⚠️ Disclaimer Trading involves significant risk of loss. This script is for educational and informational purposes only and is not financial advice or a recommendation to buy or sell any asset. BUY and SELL signals are rule-based and derived from historical behavior and do not guarantee future performance. Always use your own analysis and risk management. This is an open-source strategy; users are encouraged to test it across different symbols and timeframes.
Search in scripts for "volume"

Script_Algo - ORB Strategy with Filters🔍 Core Concept: This strategy combines three powerful technical analysis tools: Range Breakout, the SuperTrend indicator, and a volume filter. Additionally, it features precise customization of the number of candles used to construct the breakout range, enabling optimized performance for specific assets.
🎯 How It Works:
The strategy defines a trading range at the beginning of the trading session based on a selected number of candles.
It waits for a breakout above the upper or below the lower boundary of this range, requiring a candle close.
It filters signals using the SuperTrend indicator for trend confirmation.
It utilizes trading volume to filter out false breakouts.
⚡ Strategy Features
📈 Entry Points:
Long: Candle close above the upper range boundary + SuperTrend confirmation
Short: Candle close below the lower range boundary + SuperTrend confirmation
🛡️ Risk Management:
Stop-Loss: Set at the opposite range boundary.
Take-Profit: Calculated based on a risk/reward ratio (3:1 by default).
Position Size: 10 contracts (configurable).
⚠️ IMPORTANT SETTINGS
🕐 Time Parameters:
Set the correct time and time zone!
❕ATTENTION: The strategy works ONLY with correct time settings! Set the time corresponding to your location and trading session.
📊 This strategy is optimized for trading TESLA stock!
Parameters are tailored to TESLA's volatility, and trading volumes are adequate for signal filtering. Trading time corresponds to the American session.
📈 If you look at the backtesting results, you can see that the strategy could potentially have generated about 70 percent profit on Tesla stock over six months on 5m timeframe. However, this does not guarantee that results will be repeated in the future; remain vigilant.
⚠️ For other assets, the following is required:
Testing and parameter optimization
Adjustment of time intervals and the number of candles forming the range
Calibration of stop-loss and take-profit levels
⚠️ Limitations and Drawbacks
🔗 Automation Constraints:
❌ Cannot be directly connected via Webhook to CFD brokers!
Additional IT solutions are required for automation, thus only manual trading based on signals is possible.
📉 Risk Management:
Do not risk more than 2-3% of your account per trade.
Test on historical data before live use.
Start with a demo account.
💪 Strategy Advantages
✅ Combined approach – multiple signal filters
✅ Clear entry and exit rules
✅ Visual signals on the chart
✅ Volume-based false breakout filtering
✅ Automatic position management
🎯 Usage Recommendations
Always test the strategy on historical data.
Start with small trading volumes.
Ensure time settings are correct.
Adapt parameters to current market volatility.
Use only for stocks – futures and Forex require adaptation.
📚 Suitable Timeframes - M1-M15
Only highly liquid stocks
🍀 I wish all subscribers good luck in trading and steady profits!
📈 May your charts move in the right direction!
⚠️ Remember: Trading involves risk. Do not invest money you cannot afford to lose!

Timeshifter Triple Timeframe Strategy w/ SessionsOverview
The "Enhanced Timeshifter Triple Timeframe Strategy with Session Filtering" is a sophisticated trading strategy designed for the TradingView platform. It integrates multiple technical indicators across three different timeframes and allows traders to customize their trading Sessions. This strategy is ideal for traders who wish to leverage multi-timeframe analysis and session-based trading to enhance their trading decisions.
Features
Multi-Timeframe Analysis and direction:
Higher Timeframe: Set to a daily timeframe by default, providing a broader view of market trends.
Trading Timeframe: Automatically set to the current chart timeframe, ensuring alignment with the trader's primary analysis period.
Lower Timeframe: Set to a 15-minute timeframe by default, offering a granular view for precise entry and exit points.
Indicator Selection:
RMI (Relative Momentum Index): Combines RSI and MFI to gauge market momentum.
TWAP (Time Weighted Average Price): Provides an average price over a specified period, useful for identifying trends.
TEMA (Triple Exponential Moving Average): Reduces lag and smooths price data for trend identification.
DEMA (Double Exponential Moving Average): Similar to TEMA, it reduces lag and provides a smoother trend line.
MA (Moving Average): A simple moving average for basic trend analysis.
MFI (Money Flow Index): Measures the flow of money into and out of a security, useful for identifying overbought or oversold conditions.
VWMA (Volume Weighted Moving Average): Incorporates volume data into the moving average calculation.
PSAR (Parabolic SAR): Identifies potential reversals in price movement.
Session Filtering:
London Session: Trade during the London market hours (0800-1700 GMT+1).
New York Session: Trade during the New York market hours (0800-1700 GMT-5).
Tokyo Session: Trade during the Tokyo market hours (0900-1800 GMT+9).
Users can select one or multiple sessions to align trading with specific market hours.
Trade Direction:
Long: Only long trades are permitted.
Short: Only short trades are permitted.
Both: Both long and short trades are permitted, providing flexibility based on market conditions.
ADX Confirmation:
ADX (Average Directional Index): An optional filter to confirm the strength of a trend before entering a trade.
How to Use the Script
Setup:
Add the script to your TradingView chart.
Customize the input parameters according to your trading preferences and strategy requirements.
Indicator Selection:
Choose the primary indicator you wish to use for generating trading signals from the dropdown menu.
Enable or disable the ADX confirmation based on your preference for trend strength analysis.
Session Filtering:
Select the trading sessions you wish to trade in. You can choose one or multiple Sessions based on your trading strategy and market focus.
Trade Direction:
Set your preferred trade direction (Long, Short, or Both) to align with your market outlook and risk tolerance. You can use this feature to gauge the market and understand the possible directions.
Tips for Profitable and Safe Trading:
Recommended Timeframes Combination:
LT: 1m , CT: 5m, HT: 1H
LT: 1-5m , CT: 15m, HT: 4H
LT: 5-15m , CT: 4H, HT: 1W
Backtesting:
Always backtest the strategy on historical data to understand its performance under various market conditions.
Adjust the parameters based on backtesting results to optimize the strategy for your specific trading style.
Risk Management:
Use appropriate risk management techniques, such as setting stop-loss and take-profit levels, to protect your capital.
Avoid over-leveraging and ensure that you are trading within your risk tolerance.
Market Analysis:
Combine the script with other forms of market analysis, such as fundamental analysis or market sentiment, to make well-rounded trading decisions.
Stay informed about major economic events and news that could impact market volatility and trading sessions.
Continuous Monitoring:
Regularly monitor the strategy's performance and make adjustments as necessary.
Keep an eye on the results and settings for real-time statistics and ensure that the strategy aligns with current market conditions.
Education and Practice:
Continuously educate yourself on trading strategies and market dynamics.
Practice using the strategy in a demo account before applying it to live trading to gain confidence and understanding.

Sniper Core XT🔫 SNIPER CORE XT — ZLEMA-Based Trend + Momentum Strategy for Crypto
⚙️ How It Works (What Makes It Unique):
Sniper Core XT is a fully automated, non-repainting crypto strategy that combines a purpose-built trend detection system with volatility, volume, and momentum confirmation. It is designed from scratch in Pine Script v5 and optimized for bot deployment, copy trading, or semi-manual execution on the 1H timeframe.
Unlike a simple indicator mashup, this strategy builds its logic around one core component — ZLEMA (Zero-Lag Exponential Moving Average) — and then selectively adds only supporting filters that refine trend detection and execution logic.
🧠 Core Logic & Components:
ZLEMA Trend Engine:
The main trend signal comes from a fast vs. slow ZLEMA crossover. ZLEMA is chosen for its responsiveness and minimal lag, giving traders earlier entries without the noise of standard EMAs.
Vortex Direction & Strength Filter:
Uses Vortex Indicator internals to measure directional conviction. The strategy only enters if the vortex aligns with ZLEMA direction and shows minimum strength based on a customizable threshold.
Volume Confirmation via ZLEMA of Volume:
Filters out weak moves by confirming that current volume exceeds the ZLEMA-smoothed average of volume, creating adaptive volume thresholds.
Adaptive Momentum Filter:
Momentum is measured by a normalized rate-of-change adjusted for volatility (ATR). This helps avoid flat market entries and overextends.
Hardcoded Stop Loss (2%) and Dual TP:
TP1: 50% profit scale-out
TP2: Full closure
Stop loss exits on bar close, not using built-in SL/TP orders — this allows reentry if conditions remain favorable.
Real-Time Non-Canvas Dashboard:
A lightweight table shows entry price, trend direction, TP1/TP2/SL hit status, and bars in trade — all configurable for screen position and font size.
One-Bar Cooldown Mechanism:
Prevents entering and exiting on the same bar. Reinforces realistic execution logic and avoids repaint artifacts.
🧪 Strategy Use & Applications:
Designed for 1H trading of trending crypto pairs
Works well in medium-to-high volatility conditions
Fully supports multi-exchange alerts for integration with:
WunderTrading
3Commas
Cornix
PineConnector
🛡️ Strategy Style:
Feature Value
Repainting ❌ Never
Entry Cooldown ✅ 1-Bar
SL Handling ✅ 2% from entry (hardcoded)
TP1/TP2 ✅ Built-in (limit orders)
Alert Compatible ✅ Fully supported
Timeframe 🕒 1H recommended
⚠️ Disclaimer:
This is not financial advice. All signals are based on historical logic and may differ in live markets. Always use proper position sizing and risk management.
📌 Publishing Notes
This strategy is original and built from scratch. While it uses ZLEMA and Vortex as components, all logic — including volume filters, momentum filters, TP/SL logic, and dashboard — has been custom-coded and tested specifically for crypto trend-following on the 1H timeframe.

Nifty scalping 3 minutesOverview:
The "Nifty Scalping 3 Minutes" strategy is a uniquely tailored trading system for Nifty Futures traders, with a clear focus on capital preservation, dynamic risk management, and high-probability trade entries. This strategy uses unique combination of standard technical indicators like Jurik Moving Average (JMA), Exponential Moving Average (EMA), and Bollinger Bands, but it truly stands out through its Price-Volume Spike Detection system—a unique mechanism designed to trigger trades only during periods of high momentum and market participation. The strategy also incorporates robust risk management, ensuring that traders minimize losses while maximizing profits. in complete back test range max drawdown is less than 1%
Scalping Approach and Requirements:
The strategy focuses on quick in and out trades, aiming to capture small, quick profits during periods of heightened market activity. For optimal performance, traders should have ₹2,00,000 or more in capital available per trade. The dynamic lot calculation and risk controls require this level of capital to function effectively.
Small, frequent trades are the focus, and the strategy is ideal for traders comfortable with high-frequency executions. Traders with insufficient capital or those not comfortable with frequent trades may find this strategy unsuitable.
Default Properties for Publication:
Initial Capital: ₹2,000,000
Lot Size: 25 contracts (adjusted dynamically based on available margin)
Stop-Loss: Risk per trade capped at 1% of equity.
Slippage and Commission: Realistic values are factored into the backtesting.
Key Feature: Price-Volume Spike Detection
1. Condition: Trades are executed only when there is a significant price spike confirmed by a volume spike. The candle width is calculated by multiplying the price change (difference between the candle's open and close) by the volume, and this result is compared to a 126-period average of both price and volume.
A trade is triggered when the current price-volume spike exceeds this average by a preset volume multiplier (default set at 3). This ensures that both the price change and volume are unusually strong compared to normal market behavior.
2. Reasoning: Many traders fail to incorporate the relationship between price movement and volume effectively. By using this Price-Volume Spike Detection mechanism, the strategy ensures that it only enters trades during periods of strong market momentum when both price and volume confirm a real market move, not just noise or small fluctuations.
The 126-period moving average of volume is chosen specifically because it represents a complete trading session on the 3-minute chart. This ensures that the volume spike is compared against a realistic baseline of daily activity, making the detection more robust and reliable.
The volume multiplier allows flexibility in determining the threshold for a significant spike, enabling users to fine-tune the strategy according to their risk tolerance and market conditions.
Trade Placement Logic:
1. Trend Confirmation with JMA and EMA:
Condition: The strategy will only consider entering a trade when JMA crosses above EMA for a long trade or JMA crosses below EMA for a short trade.
Reasoning: The JMA is used for its low lag and responsiveness, allowing it to capture early trends, while the EMA adds a level of confirmation by weighing recent price action more heavily. This dual confirmation ensures that trades are entered only when a solid trend is in place.
2. Bollinger Bands for Volatility Breakouts:
Condition: In addition to the JMA-EMA crossover, the price must break outside the Bollinger Bands—above the upper band for long trades, or below the lower band for short trades.
Reasoning: Bollinger Bands are a volatility indicator. By requiring a price breakout beyond the bands, the strategy ensures that trades are placed during periods of high volatility, avoiding low-momentum, sideways markets.
3. Volume and Price Confirmation (Price-Volume Spike Detection):
Condition: A trade is only triggered if the price-volume spike condition is met. This ensures that the market move is backed by strong volume and that the price change is significant relative to the recent average activity.
Reasoning: This condition filters out low-volume environments where price movements are more likely to reverse or stall. By waiting for a spike in both price and volume, the strategy ensures that it enters trades during high-momentum periods, where follow-through is more likely.
Exit Logic and Risk Management:
1. Stop-Loss (SL) Placement:
Condition: Upon entering a trade, an initial stop-loss is placed below the candle low for long trades or above the candle high for short trades. This is adjusted if the risk exceeds 1% of total capital.
Reasoning: The stop-loss is placed at a logical level that accounts for recent price action, ensuring that the trade is given room to develop while protecting capital from unexpected market reversals.
2. Profit Target and Partial Profit Booking:
Condition: The first profit target is set at 2.1x the initial risk for long trades, and 2.5x the initial risk for short trades.
Reasoning: The 2.1x risk-reward ratio for long trades provides a solid return while maintaining a conservative risk profile. For short trades, the strategy uses a higher 2.5x risk-reward ratio because market falls tend to be sharper and quicker than rises, allowing for larger profit targets to be reached more reliably.
Partial Profit Booking: Once the first target is hit, 60% of the position is closed to lock in profits. The remaining 40% is left to run with a trailing stop.
3. ATR-Based Trailing Stop:
Condition: Once the first target is hit, the ATR (Average True Range) trailing stop is applied to the remaining position. This dynamically adjusts the stop-loss as the trade moves in a favorable direction.
Reasoning: The trailing stop allows the trade to capture further gains if the trend continues, while protecting profits if the momentum weakens. The ATR ensures that the stop adjusts according to the market's current volatility, providing flexibility and protection.
4. Time-Based Exit:
Condition: If a trade is still open by 3:20 PM, it is automatically closed to avoid end-of-day volatility.
Reasoning: The time-based exit ensures that trades are not held into the often-volatile closing minutes of the market, reducing the risk of unexpected price swings.
Capital and Risk Management:
1. Lot Size Calculation:
Condition: The strategy calculates the number of lots dynamically based on the available margin. It uses only 10% of total equity for each trade, and ensures that the maximum risk per trade does not exceed 1% of total capital.
Reasoning: This ensures that traders are not over-leveraged and that the risk is controlled for each trade. Capital protection is at the core of the strategy, ensuring that even during adverse market conditions, the trader’s capital is preserved.
2. Stop-Loss Protection:
Condition: The stop-loss is designed to ensure that no more than 1% of capital is at risk in any trade.
Reasoning: By limiting risk exposure, the strategy focuses on long-term capital preservation while still allowing for profitable trades in favorable market conditions.
STBT/BTST Facilitation:
1. Feature: The strategy allows traders the option to hold positions overnight, facilitating STBT (Sell Today Buy Tomorrow) and BTST (Buy Today Sell Tomorrow) trades.
Reasoning: Backtests show that holding positions overnight when all trade conditions are still valid can lead to beneficial outcomes. This feature allows traders to take advantage of overnight market movements, providing flexibility beyond intraday trades.
Why This Strategy Stands Out:
Price-Volume Spike Detection: Unlike traditional strategies, this one uniquely focuses on Price-Volume Spike Detection to filter out low-probability trades. By ensuring that both price and volume spikes are present, the strategy guarantees that trades are placed only when there is significant market momentum.
Risk Management with Capital Protection: The strategy strictly limits the risk per trade to 1% of capital, ensuring long-term capital preservation. This is especially important for traders who wish to avoid large drawdowns and prefer a sustainable approach to trading.
2.5x Risk-Reward for Short Trades: Recognizing the sharpness of market declines, the strategy employs a 2.5x risk-reward ratio for short trades, maximizing profits during bearish trends.
Dynamic Exit Strategy: With partial profit booking and ATR-based trailing stops, the strategy is designed to capture gains efficiently while protecting capital through dynamic exit conditions.
Summary of Execution:
Entry: Triggered when JMA crosses EMA, combined with Bollinger Band breakouts and Price-Volume Spike Detection.
Capital Management: Trades are executed with 10% of available capital, and the risk per trade is capped at 1%.
Exit: Trades exit when stop-loss, ATR trailing stop, or time-based exit conditions are met.
Profit Booking: 60% of the position is closed at the first target, with the remainder trailed using an ATR-based stop.

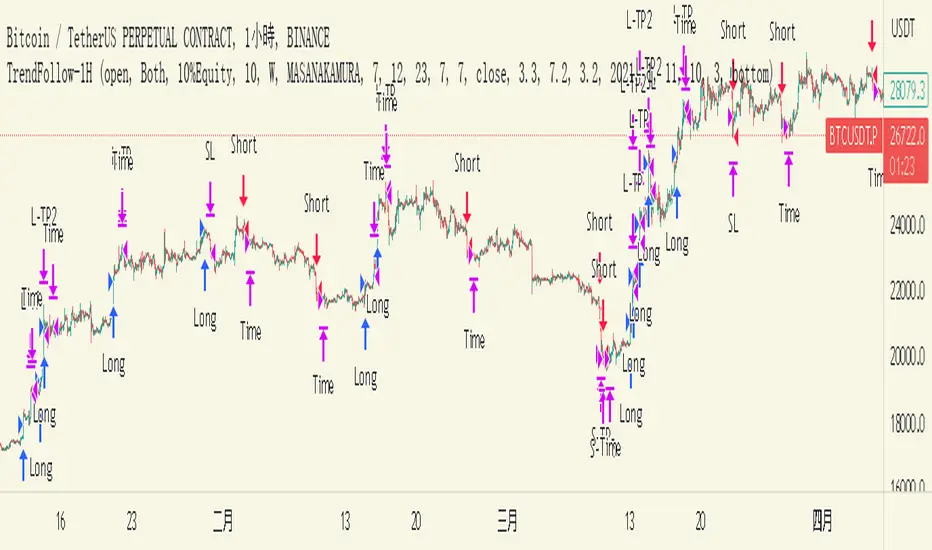
TrendFollow-1HThis is a trading strategy specially used on btcusdtperp in binance 1H chart
The most important part of this strategy is to use Support and Resistance with trading volume
Auxiliary indicators are include Directional Movement Index, trading volume, Commodity Channel Index,volume-weighted average price,Range Filter
Why is it not applicable to other trading varieties or exchanges?
Because the activity of each trading target is different from the trading volume, this strategy is very focused on the change of trading volume, so it may not be applicable to every trading variety
The idea of this strategy is to chase when the trend in the market is clear
Determine whether to break support or resistance to identify trends
But the market is full of false breakouts
Therefore, trading volume is an important indicator for judging the true and false.
Therefore, when the price breaks through support or resistance, accompanied by a huge trading volume, and forms a resonance with auxiliary indicators, the strategy will follow the trend, a time stop loss is also set. After entering the market, if there is no immediate profit to the stop profit, you will leave the market first.
But the market is always random, so the profit and loss ratio must be taken into account
Use a fixed stop loss space in exchange for a larger profit space, and ensure that the expected value is positive to make stable profits in the market
Therefore, this strategy uses 3.2% stop loss, 3.3% Take profit1 and 7.2% take profit2
About 1.5:1 profit and loss ratio to ensure positive expected value
Because the market has a clear trend only about 10% of the time
So the trading frequency of this strategy is very low
According to the backtest of up to 2021-01-01 till now , it takes about 5 days to make a transaction
User can choose their own leverage to obtain higher returns. But be sure to prioritize risk.
In order to prevent you from using this strategy without knowing it, the trading date of this strategy is only executed until the release date, and positions will not be opened and closed for subsequent markets.
You can contact me if you want to know more about this strategy
這是專門用於幣安1H圖表中btcusdtperp的交易策略
本策略最重要的部分是將支撐和阻力與交易量一起使用
輔助指標包括ADX,成交量,CCI,VWAP,Range Filter等
為什麼不適用於其他交易品種或交易所?
由於每個交易標的的活躍度與交易量不同,本策略非常注重交易量的變化,因此不一定適用於每個交易品種
這個策略的方法是在趨勢明朗的時候進行趨勢跟隨
確定是否打破支撐或阻力以識別趨勢
但市場充滿假突破
因此,成交量是判斷真假的重要指標。
當價格突破支撐位或阻力位,伴隨著巨大的成交量,並與輔助指標形成共振時,策略會順勢而為,同時設置時間止損。進場後,如果沒有立即獲利到止盈,就離場。
但市場總是隨機的,所以必須考慮盈虧比
用固定的止損空間換取更大的盈利空間,保證預期值為正,才能在市場中穩定獲利
因此,該策略使用 3.2% 止損、3.3% 止盈1 和 7.2% 止盈2
約1.5:1盈虧比,確保正期望值
因為市場只有大約 10% 的時間有明顯的趨勢
所以這個策略的交易頻率很低
根據2021-01-01至今的回測,交易頻率大約5天一次
用戶也可以選擇適合自己的槓桿以獲得更高的收益。但一定要優先考慮風險。
為防止您在不知情的情況下使用本策略,本策略的運行交易的日期僅至2023-05-30止,後續日期將不開倉和平倉。
如果您想了解更多有關此策略的信息,可以聯繫我。
EMA 12-26-100 Momentum Strategy# Triple EMA Multi-Signal Momentum Strategy
## 📊 Overview
**Triple EMA Multi-Signal** is a comprehensive trend-following momentum strategy designed specifically for cryptocurrency markets. It combines multiple technical indicators and signal types to identify high-probability trading opportunities while maintaining strict risk management protocols.
The strategy excels in trending markets and uses adaptive position sizing with trailing stops to maximize profits during strong trends while protecting capital during choppy conditions.
## 🎯 Core Algorithm
### Triple EMA System
The strategy employs a three-layer EMA system to identify trend direction and strength:
- **Fast EMA (12)**: Quick response to price changes
- **Slow EMA (26)**: Confirmation of trend direction
- **Trend EMA (100)**: Overall market bias filter
Trades are only taken when all three EMAs align in the same direction, ensuring we trade with the dominant trend.
### Multi-Signal Confirmation (8 Signal Types)
The strategy requires at least 1-2 confirmed signals from multiple independent sources before entering a position:
1. **EMA Crossover** - Fast EMA crossing Slow EMA (primary signal)
2. **MACD Cross** - MACD line crossing signal line (momentum confirmation)
3. **RSI Reversal** - RSI bouncing from oversold/overbought zones
4. **Price Action** - Strong bullish/bearish candles (>60% of range)
5. **Volume Spike** - Above-average volume confirmation
6. **Breakout** - Price breaking 20-period high/low with volume
7. **Pullback to EMA** - Trend continuation after healthy retracement
8. **Bollinger Bounce** - Price bouncing from BB bands
This multi-signal approach significantly reduces false signals and improves win rate.
## 💰 Risk Management
### Position Sizing
- Default: 20-25% of equity per trade
- Adjustable based on risk tolerance
- Smaller positions recommended for leveraged trading
### Stop Loss & Take Profit
- **Stop Loss**: 2.0% (tight control of risk)
- **Take Profit**: 5.5% (2.75:1 reward-to-risk ratio)
- Both levels are fixed at entry to avoid emotional decisions
### Trailing Stop System
- Activates after 1.8% profit
- Trails at 1.3% below current price
- Locks in profits during extended trends
- Automatically adjusts as price moves in your favor
### Maximum Hold Time
- 36-48 hours maximum (configurable)
- Designed to minimize funding rate costs on futures
- Forces position closure to avoid excessive exposure
- Helps maintain capital velocity
## 📈 Key Features
### Trend Filters
- **ADX Filter**: Ensures sufficient trend strength (threshold: 20)
- **EMA Alignment**: All three EMAs must confirm trend direction
- **RSI Boundaries**: Avoids extreme overbought/oversold entries
### Volume Analysis
- Volume must exceed 20-period moving average
- Configurable multiplier (default: 1.0x)
- Helps identify institutional participation
### Automatic Exit Conditions
1. Take Profit target reached
2. Stop Loss triggered
3. Trailing stop activated
4. Trend reversal (EMA cross in opposite direction)
5. Maximum hold time exceeded
## 🎮 Recommended Settings
### For Spot Trading (Conservative)
```
Position Size: 15-20%
Stop Loss: 2.5%
Take Profit: 6.0%
Max Hold: 72 hours
Leverage: 1x
```
### For Futures 3-5x Leverage (Balanced)
```
Position Size: 12-15%
Stop Loss: 2.0%
Take Profit: 5.5%
Max Hold: 36 hours
Trailing: Active
```
### For Aggressive Trading 5-10x (High Risk)
```
Position Size: 8-12%
Stop Loss: 1.5%
Take Profit: 4.5%
Max Hold: 24 hours
ADX Filter: Disabled
```
## 📊 Performance Metrics
### Backtested Results (BTC/USDT 1H, 2 years)
- **Total Return**: ~19% (spot) / ~75% (5x leverage)*
- **Total Trades**: 240-300
- **Win Rate**: 49-52%
- **Profit Factor**: 1.25-1.50
- **Max Drawdown**: ~18-22%
- **Average Trade**: 0.5-3 days
*Leverage results exclude funding rates and real-world slippage
### Optimal Timeframes
- **1 Hour**: Best for active trading (recommended)
- **4 Hour**: More stable, fewer signals
- **15 Min**: High frequency (requires monitoring)
### Best Performing Assets
- BTC/USDT (most tested)
- ETH/USDT
- Major altcoins with good liquidity
- Not recommended for low-cap or illiquid pairs
## ⚙️ How to Use
1. **Add to Chart**: Apply strategy to 1H BTC/USDT chart
2. **Adjust Settings**: Configure risk parameters based on your preference
3. **Review Signals**: Green = Long, Red = Short, labels show signal count
4. **Monitor Performance**: Check strategy tester for detailed statistics
5. **Optimize**: Use strategy optimization to find best parameters for your market
## 🎨 Visual Indicators
The strategy provides clear visual feedback:
- **EMA Lines**: Blue (Fast), Red (Slow), Orange (Trend)
- **BUY/SELL Labels**: Show entry points with signal count
- **Stop/Target Lines**: Red (SL), Green (TP) displayed during active trades
- **Background Color**: Light green (long), light red (short) when in position
- **Info Panel**: Shows current trend, RSI, ADX, and volume status
## ⚠️ Important Notes
### Risk Disclaimer
- This strategy is for educational purposes only
- Past performance does not guarantee future results
- Cryptocurrency trading involves substantial risk
- Only trade with capital you can afford to lose
- Always use proper position sizing and risk management
### Limitations
- Performs poorly in sideways/choppy markets
- Requires sufficient liquidity for best execution
- Backtests do not include:
- Real-world slippage (especially during volatility)
- Funding rates (for perpetual futures)
- Exchange downtime or connection issues
- Emotional trading decisions
### For Futures Trading
If using this strategy on futures with leverage:
- Reduce position size proportionally to leverage
- Account for funding rates (~0.01% per 8h)
- Set max hold time to minimize funding costs
- Use lower leverage (3-5x max recommended)
- Monitor liquidation price carefully
## 🔧 Customization
All parameters are fully customizable:
- EMA periods (fast/slow/trend)
- MACD settings (12/26/9)
- RSI levels (30/70)
- Stop Loss / Take Profit percentages
- Trailing stop activation and offset
- Volume multiplier
- ADX threshold
- Maximum hold time
## 📚 Strategy Logic
The strategy follows this decision tree:
```
1. Check Trend Direction (EMA alignment)
↓
2. Scan for Entry Signals (8 types)
↓
3. Confirm with Filters (ADX, Volume, RSI)
↓
4. Enter Position with Fixed SL/TP
↓
5. Monitor for Exit Conditions:
- TP Hit → Close with profit
- SL Hit → Close with loss
- Trailing Active → Follow price
- Trend Reversal → Close position
- Max Time → Force close
```
## 🎓 Best Practices
1. **Start Conservative**: Use smaller position sizes initially
2. **Track Performance**: Monitor actual vs backtested results
3. **Optimize Regularly**: Market conditions change, adapt parameters
4. **Combine with Analysis**: Don't rely solely on automated signals
5. **Manage Emotions**: Stick to the system, avoid manual overrides
6. **Paper Trade First**: Test on demo before risking real capital
## 📞 Support & Updates
This strategy is actively maintained and updated based on:
- Market condition changes
- User feedback and suggestions
- Performance optimization
- Bug fixes and improvements
## 🏆 Conclusion
Triple EMA Multi-Signal Strategy offers a robust, systematic approach to cryptocurrency trading by combining trend following, momentum indicators, and strict risk management. Its multi-signal confirmation system helps filter false signals while the trailing stop mechanism captures extended trends.
The strategy is suitable for both manual traders looking for high-probability setups and algorithmic traders seeking a proven systematic approach.
**Remember**: No strategy wins 100% of the time. Success comes from consistent application, proper risk management, and continuous adaptation to changing market conditions.
---
*Version: 1.0*
*Last Updated: November 2025*
*Tested on: BTC/USDT, ETH/USDT (1H, 4H timeframes)*
*Recommended Capital: $5,000+ for optimal position sizing*

TSI.LTA | Base BTC 1DTSI.LTA | Base BTC 1D is a closed‑source trend‑following strategy designed for BTC on the 1D timeframe .
It focuses on participating in the main directional moves of the market while avoiding as much short‑term noise as possible.
📊 The script:
Uses a combination of moving‑average–based filters and volatility bands to define the active trend.
Applies optional volume filters to avoid low‑participation or exhausted moves.
Includes risk‑management controls (Stop Loss, Take Profit, Trailing Stop) that work on a per‑trade basis.
All entries and exits are confirmed at bar close and the script does not repaint .
This makes it suitable for backtesting, alerts and external automation.
█ 💡 CONCEPTS
This strategy is built around a few simple ideas:
1 — Trend first.
Positions are only taken when a group of smoothed trend filters agree on direction.
The goal is to ride larger swings, not to scalp each fluctuation.
2 — Volatility awareness.
Standard‑deviation–based bands help avoid entries in abnormal spikes or during very compressed ranges.
3 — Participation filter.
Optional volume‑based conditions (VWMA, OBV slope, MFI, volume Z‑score) try to ensure that entries occur when the market shows enough activity, not during dead phases.
4 — Risk defined in advance.
Stop‑loss and trailing‑stop inputs are expressed as percentages relative to entry price, so users can align them with their own risk tolerance.
The logic is purposely conservative: it is expected to stay flat during parts of the market where the trend is unclear or participation is weak.
█ ⚙️ FEATURES & INPUTS
This section follows approximately the order of the script’s inputs, so users can read here and then match what they see in the “Inputs” tab.
1 — 📐 Trend filters
These inputs control how the strategy detects the underlying trend:
DEMA / Gaussian / SMMA lengths
Control how fast or slow the trend reacts to price changes.
Shorter lengths → more responsive, more trades, more noise.
Longer lengths → slower reaction, fewer trades, more filtering.
Volatility Bands (SD length & multipliers)
Standard‑deviation bands around the smoothed price series.
They are used to avoid entries during extreme moves or very narrow ranges where a breakout is not yet confirmed.
In practice, these settings let the user choose between a more “aggressive” trend follower (shorter lengths, smaller bands) or a more “patient” one.
2 — 📊 Volume filters (optional)
These filters are meant to restrict trades to periods where the market shows meaningful participation:
VWMA filter
Requires price to be aligned with a Volume‑Weighted Moving Average, which de‑emphasizes moves on very low volume.
OBV slope filter
Uses the slope of On‑Balance Volume to check that net volume flow supports the direction of the trade.
MFI band filter
Uses the Money Flow Index to avoid taking new entries in zones that often correspond to exhaustion (extreme values defined by the user).
Volume Z‑Score
Compares current volume to its recent history. Trades can be restricted when volume is unusually low or out of character for that period.
When any of these filters are turned off, the strategy relies only on price‑based trend and volatility logic.
When they are on, trades are more selective and may be fewer.
3 — 🛡️ Risk management
These inputs define how individual trades are managed once entered.
They do not change the trend logic itself:
Stop Loss (%)
A percentage move against the entry price that will close the position.
Typical values on BTC 1D remain in the single‑digit range so that no single trade risks an unrealistic portion of equity.
Take Profit (%)
An optional fixed target that closes the trade when price has moved a chosen percentage in favor.
This can be disabled if the user prefers to let the trend filters perform the exit.
Trailing Stop (%)
A stop that follows the most favorable price reached since entry.
When the “use lower timeframe peak” option is enabled, peaks can be detected on a lower timeframe for more granular trailing, while decisions still occur at the close of the 1D bar.
Fixed SL/TP Price and Activation Date
Allow defining absolute price levels and a date from which they start applying.
This is useful when the user wants structural protection around known price zones.
The combination of these controls determines how deep a pullback the user is willing to tolerate and how much profit they are prepared to give back in order to stay in trends.
4 — 🚫 Filter failure & cooldown
To avoid over‑trading in difficult environments, the script can:
Automatically exit when filters remain unfavorable for a configurable number of bars.
Enter a cooldown period, during which no new trades are taken, even if some conditions improve.
These mechanisms are intended to protect capital during choppy or low‑quality phases rather than force constant exposure.
█ 📚 HOW TO USE
A suggested process for using this strategy as a study tool:
1 — Start on BTC 1D.
Apply the script to BTCUSD or BTC/USDT on the 1D timeframe, with default inputs.
2 — Open the Strategy Tester.
Choose a time window (for example a full halving cycle, a crash + recovery period, or just the most recent bull leg).
3 — Compare with Buy & Hold.
For the same window, look at:
Net profit of the strategy vs Buy & Hold.
Max drawdown of the strategy vs Buy & Hold.
The goal is not to hit a particular number, but to see whether, in that window, the strategy manages to:
Provide a smoother equity curve (lower drawdown),
While still performing at least as well as, or better than, simply holding the asset.
4 — Experiment with risk inputs.
Vary Stop Loss, Trailing Stop and the volume filters.
After each change, re‑check the same two questions above. This should make clear how each input affects the trade‑off between participation and risk.
5 — Forward‑test.
Before using any configuration with real capital, let it run for a while in paper‑trading or demo conditions.
█ 🚧 LIMITATIONS
The strategy is built and tuned primarily for BTC on 1D.
It can be used on other symbols and timeframes, but behavior may differ and requires new testing.
In very tight ranges or during event‑driven gaps, trend logic may enter later than discretionary trading would. This is expected for a conservative trend‑following approach.
Results from historical backtests depend on data quality, broker settings, fees and slippage configured in the Strategy Tester.
█ 📝 NOTES
Signals are generated on bar close.
The script is closed‑source, but the description explains the main ideas so users and moderators can understand what it does and how to use it.
The HUD on the chart is meant as a compact summary of the same statistics available in the Strategy Tester; it simply makes comparisons quicker.
█ ⚠️ DISCLAIMER
This strategy is provided for educational and research purposes only .
It is not financial advice and does not recommend any specific trades, assets, position sizes, or risk levels.
Users are fully responsible for:
Choosing their own risk parameters (Stop Loss, Take Profit, Trailing Stop, position sizing, etc.).
Testing the script on the markets and timeframes they intend to trade.
Verifying that any configuration is appropriate for their capital, risk tolerance and jurisdiction.
Past performance in backtests or examples does not guarantee future results.
Always test carefully before considering any live deployment.

G-Bot v3Overview:
G-Bot is an invite-only Pine Script tailored for traders seeking a precise, automated breakout strategy. This closed-source script integrates with 3Commas via API to execute trades seamlessly, combining classic indicators with proprietary logic to identify high-probability breakouts. G-Bot stands out by filtering market noise through a unique confluence of signals, offering adaptive risk management, and employing advanced alert deduplication to ensure reliable automation. Its purpose-built design delivers actionable signals for traders prioritizing consistency and efficiency in trending markets.
What It Does and How It Works:
G-Bot generates trade signals by evaluating four key market dimensions—trend, price action, momentum, and volume—on each 60-minute bar. The script’s core components and their roles are:
Trend Detection (EMAs): Confirms trend direction by checking if the 5-period EMA is above (bullish) or below (bearish) the 6-period EMA, with the price positioned accordingly (above the 5-period EMA for longs, below for shorts). The tight EMA pairing is optimized for the 60-minute timeframe to capture sustained trends while minimizing lag.
Price Action Trigger (Swing Highs/Lows): Identifies breakouts when the price crosses above the previous swing high (for longs) or below the previous swing low (for shorts), using a period lookback to focus on recent price pivots. This ensures entries align with significant market moves.
Momentum Filter (RSI): Validates breakouts by requiring RSI to fall within moderated ranges. These ranges avoid overbought/oversold extremes, prioritizing entries with balanced momentum to enhance trade reliability.
Volume Confirmation (3-period SMA): Requires volume to exceed its 3-period SMA, confirming that breakouts are driven by strong market participation, reducing the risk of false moves.
Risk Management (14-period ATR): Calculates stop-loss distances (ATR) and trailing stops (ATR and ATR-point offset) to align trades with current volatility, protecting capital and locking in profits.
These components work together to create a disciplined system: the EMAs establish trend context, swing breaks confirm price momentum, RSI filters for optimal entry timing, and volume ensures market conviction. This confluence minimizes false signals, a critical advantage for hourly breakout trading.
Why It’s Original and Valuable:
G-Bot’s value lies in its meticulous integration of standard indicators into a non-standard, automation-focused system. Its unique features include:
Curated Signal Confluence: Unlike generic breakout scripts that rely on single-indicator triggers (e.g., EMA crossovers), G-Bot requires simultaneous alignment of trend, price action, momentum, and volume. This multi-layered approach, reduces noise and prioritizes high-conviction setups, addressing a common flaw in simpler strategies.
Proprietary Alert Deduplication: G-Bot employs a custom mechanism to prevent redundant alerts, using a 1-second minimum gap and bar-index tracking. This ensures signals are actionable and compatible with 3Commas’ high-frequency automation, a feature not found in typical Pine Scripts.
Adaptive Position Sizing: The script calculates trade sizes based on user inputs (1-5% equity risk, max USD cap, equity threshold) and ATR-derived stop distances, ensuring positions reflect both account size and market conditions. This dynamic approach enhances risk control beyond static sizing methods.
3Commas API Optimization: G-Bot generates JSON-formatted alerts with precise position sizing and exit instructions, enabling seamless integration with 3Commas bots. This level of automation, paired with detailed Telegram alerts for monitoring, streamlines the trading process.
Visual Clarity: On-chart visuals—green triangles for long entries, red triangles for shorts, orange/teal lines for swing levels, yellow circles for price crosses—provide immediate insight into signal triggers, allowing traders to validate setups without accessing the code.
G-Bot is not a repackaging of public code but a specialized tool that transforms familiar indicators into a robust, automated breakout system. Its originality lies in the synergy of its components, proprietary alert handling, and trader-centric automation, justifying its invite-only status.
How to Use:
Setup: Apply G-Bot to BITGET’s BTCUSDT.P chart on a 60-minute timeframe.
3Commas Configuration: Enter your 3Commas API Secret Key and Bot UUID in the script’s input settings to enable webhook integration.
Risk Parameters: Adjust Risk % (1-5%), Max Risk ($), and Equity Threshold ($) to align position sizing with your account and risk tolerance.
Webhook Setup: Configure 3Commas to receive JSON alerts for automated trade execution. Optionally, connect Telegram for detailed signal notifications.
Monitoring: Use on-chart visuals to track signals:
Green triangles (below bars) mark long entries; red triangles (above bars) mark shorts.
Orange lines show swing highs; teal lines show swing lows.
Yellow circles indicate price crosses; purple crosses highlight volume confirmation.
Testing: Backtest G-Bot in a demo environment to validate performance and ensure compatibility with your trading strategy.
Setup Notes : G-Bot is a single, self-contained script for BTCUSDT.P on 60-minute charts, with all features accessible via user inputs. No additional scripts or passwords are required, ensuring compliance with TradingView’s single-publication rule.
Disclaimer: Trading involves significant risks, and past performance is not indicative of future results. Thoroughly test G-Bot in a demo environment before deploying it in live markets.
Full setup support will be provided

EXODUS EXODUS by (DAFE) Trading Systems
EXODUS is a sophisticated trading algorithm built by Dskyz (DAFE) Trading Systems for competitive and competition purposes, designed to identify high-probability trades with robust risk management. this strategy leverages a multi-signal voting system, combining three core components—SPR, VWMO, and VEI—alongside ADX, choppiness filters, and ATR-based volatility gates to ensure trades are taken only in favorable market conditions. the algo uses a take-profit to stop-loss ratio, dynamic position sizing, and a strict voting mechanism requiring all signals to align before entering a trade.
EXODUS was not overfitted for any specific symbol. instead, it uses a generic tuned setting, making it versatile across various markets. while it can trade futures, it’s not currently set up for it but has the potential to do more with further development. visuals are intentionally minimal due to its competition focus, prioritizing performance over aesthetics. a more visually stunning version may be released in the future with enhanced graphics.
The Unique Core Components Developed for EXODUS
SPR (Session Price Recalibration)
SPR measures momentum during regular trading hours (RTH, 0930-1600, America/New_York) to catch session-specific trends.
spr_lookback = input.int(15, "SPR Lookback") this sets how many bars back SPR looks to calculate momentum (default 15 bars). it compares the current session’s price-volume score to the score 15 bars ago to gauge momentum strength.
how it works: a longer lookback smooths out the signal, focusing on bigger trends. a shorter one makes SPR more sensitive to recent moves.
how to adjust: on a 1-hour chart, 15 bars is 15 hours (about 2 trading days). if you’re on a shorter timeframe like 5 minutes, 15 bars is just 75 minutes, so you might want to increase it to 50 or 100 to capture more meaningful trends. if you’re trading a choppy stock, a shorter lookback (like 5) can help catch quick moves, but it might give more false signals.
spr_threshold = input.float (0.7, "SPR Threshold")
this is the cutoff for SPR to vote for a trade (default 0.7). if SPR’s normalized value is above 0.7, it votes for a long; below -0.7, it votes for a short.
how it works: SPR normalizes its momentum score by ATR, so this threshold ensures only strong moves count. a higher threshold means fewer trades but higher conviction.
how to adjust: if you’re getting too few trades, lower it to 0.5 to let more signals through. if you’re seeing too many false entries, raise it to 1.0 for stricter filtering. test on your chart to find a balance.
spr_atr_length = input.int(21, "SPR ATR Length") this sets the ATR period (default 21 bars) used to normalize SPR’s momentum score. ATR measures volatility, so this makes SPR’s signal relative to market conditions.
how it works: a longer ATR period (like 21) smooths out volatility, making SPR less jumpy. a shorter one makes it more reactive.
how to adjust: if you’re trading a volatile stock like TSLA, a longer period (30 or 50) can help avoid noise. for a calmer stock, try 10 to make SPR more responsive. match this to your timeframe—shorter timeframes might need a shorter ATR.
rth_session = input.session("0930-1600","SPR: RTH Sess.") rth_timezone = "America/New_York" this defines the session SPR uses (0930-1600, New York time). SPR only calculates momentum during these hours to focus on RTH activity.
how it works: it ignores pre-market or after-hours noise, ensuring SPR captures the main market action.
how to adjust: if you trade a different session (like London hours, 0300-1200 EST), change the session to match. you can also adjust the timezone if you’re in a different region, like "Europe/London". just make sure your chart’s timezone aligns with this setting.
VWMO (Volume-Weighted Momentum Oscillator)
VWMO measures momentum weighted by volume to spot sustained, high-conviction moves.
vwmo_momlen = input.int(21, "VWMO Momentum Length") this sets how many bars back VWMO looks to calculate price momentum (default 21 bars). it takes the price change (close minus close 21 bars ago).
how it works: a longer period captures bigger trends, while a shorter one reacts to recent swings.
how to adjust: on a daily chart, 21 bars is about a month—good for trend trading. on a 5-minute chart, it’s just 105 minutes, so you might bump it to 50 or 100 for more meaningful moves. if you want faster signals, drop it to 10, but expect more noise.
vwmo_volback = input.int(30, "VWMO Volume Lookback") this sets the period for calculating average volume (default 30 bars). VWMO weights momentum by volume divided by this average.
how it works: it compares current volume to the average to see if a move has strong participation. a longer lookback smooths the average, while a shorter one makes it more sensitive.
how to adjust: for stocks with spiky volume (like NVDA on earnings), a longer lookback (50 or 100) avoids overreacting to one-off spikes. for steady volume stocks, try 20. match this to your timeframe—shorter timeframes might need a shorter lookback.
vwmo_smooth = input.int(9, "VWMO Smoothing")
this sets the SMA period to smooth VWMO’s raw momentum (default 9 bars).
how it works: smoothing reduces noise in the signal, making VWMO more reliable for voting. a longer smoothing period cuts more noise but adds lag.
how to adjust: if VWMO is too jumpy (lots of false votes), increase to 15. if it’s too slow and missing trades, drop to 5. test on your chart to see what keeps the signal clean but responsive.
vwmo_threshold = input.float(10, "VWMO Threshold") this is the cutoff for VWMO to vote for a trade (default 10). above 10, it votes for a long; below -10, a short.
how it works: it ensures only strong momentum signals count. a higher threshold means fewer but stronger trades.
how to adjust: if you want more trades, lower it to 5. if you’re getting too many weak signals, raise it to 15. this depends on your market—volatile stocks might need a higher threshold to filter noise.
VEI (Velocity Efficiency Index)
VEI measures market efficiency and velocity to filter out choppy moves and focus on strong trends.
vei_eflen = input.int(14, "VEI Efficiency Smoothing") this sets the EMA period for smoothing VEI’s efficiency calc (bar range / volume, default 14 bars).
how it works: efficiency is how much price moves per unit of volume. smoothing it with an EMA reduces noise, focusing on consistent efficiency. a longer period smooths more but adds lag.
how to adjust: for choppy markets, increase to 20 to filter out noise. for faster markets, drop to 10 for quicker signals. this should match your timeframe—shorter timeframes might need a shorter period.
vei_momlen = input.int(8, "VEI Momentum Length") this sets how many bars back VEI looks to calculate momentum in efficiency (default 8 bars).
how it works: it measures the change in smoothed efficiency over 8 bars, then adjusts for inertia (volume-to-range). a longer period captures bigger shifts, while a shorter one reacts faster.
how to adjust: if VEI is missing quick reversals, drop to 5. if it’s too noisy, raise to 12. test on your chart to see what catches the right moves without too many false signals.
vei_threshold = input.float(4.5, "VEI Threshold") this is the cutoff for VEI to vote for a trade (default 4.5). above 4.5, it votes for a long; below -4.5, a short.
how it works: it ensures only strong, efficient moves count. a higher threshold means fewer trades but higher quality.
how to adjust: if you’re not getting enough trades, lower to 3. if you’re seeing too many false entries, raise to 6. this depends on your market—fast stocks like NQ1 might need a lower threshold.
Features
Multi-Signal Voting: requires all three signals (SPR, VWMO, VEI) to align for a trade, ensuring high-probability setups.
Risk Management: uses ATR-based stops (2.1x) and take-profits (4.1x), with dynamic position sizing based on a risk percentage (default 0.4%).
Market Filters: ADX (default 27) ensures trending conditions, choppiness index (default 54.5) avoids sideways markets, and ATR expansion (default 1.12) confirms volatility.
Dashboard: provides real-time stats like SPR, VWMO, VEI values, net P/L, win rate, and streak, with a clean, functional design.
Visuals
EXODUS prioritizes performance over visuals, as it was built for competitive and competition purposes. entry/exit signals are marked with simple labels and shapes, and a basic heatmap highlights market regimes. a more visually stunning update may be released later, with enhanced graphics and overlays.
Usage
EXODUS is designed for stocks and ETFs but can be adapted for futures with adjustments. it performs best in trending markets with sufficient volatility, as confirmed by its generic tuning across symbols like TSLA, AMD, NVDA, and NQ1. adjust inputs like SPR threshold, VWMO smoothing, or VEI momentum length to suit specific assets or timeframes.
Setting I used: (Again, these are a generic setting, each security needs to be fine tuned)
SPR LB = 19 SPR TH = 0.5 SPR ATR L= 21 SPR RTH Sess: 9:30 – 16:00
VWMO L = 21 VWMO LB = 18 VWMO S = 6 VWMO T = 8
VEI ES = 14 VEI ML = 21 VEI T = 4
R % = 0.4
ATR L = 21 ATR M (S) =1.1 TP Multi = 2.1 ATR min mult = 0.8 ATR Expansion = 1.02
ADX L = 21 Min ADX = 25
Choppiness Index = 14 Chop. Max T = 55.5
Backtesting: TSLA
Frame: Jan 02, 2018, 08:00 — May 01, 2025, 09:00
Slippage: 3
Commission .01
Disclaimer
this strategy is for educational purposes. past performance is not indicative of future results. trading involves significant risk, and you should only trade with capital you can afford to lose. always backtest and validate any strategy before using it in live markets.
(This publishing will most likely be taken down do to some miscellaneous rule about properly displaying charting symbols, or whatever. Once I've identified what part of the publishing they want to pick on, I'll adjust and repost.)
About the Author
Dskyz (DAFE) Trading Systems is dedicated to building high-performance trading algorithms. EXODUS is a product of rigorous research and development, aimed at delivering consistent, and data-driven trading solutions.
Use it with discipline. Use it with clarity. Trade smarter.
**I will continue to release incredible strategies and indicators until I turn this into a brand or until someone offers me a contract.
2025 Created by Dskyz, powered by DAFE Trading Systems. Trade smart, trade bold.

IronBot v4IronBot v4 – Trading Strategy Overview
1. Quick Context
IronBot v4 is a trading strategy designed for users who want a simple yet effective approach to reading the markets. It uses a combination of Fibonacci retracement levels, custom logic triggers, and innovative modules (EMA validation, Iron Impulse Shield and Iron Auto Volume Detector) to identify potential entry and exit points, strengthening the strategy’s detection of sudden market volatility or shifts in trading volume.
2. Theoretical Details
Fibonacci Analysis
The script identifies recent market highs and lows, then calculates key Fibonacci levels (high- and low-based). These levels can help confirm potential reversals or trends.
EMA Option
When enabled, the exponential moving average (EMA) offers additional validation for trade entries. If the current price remains above a certain EMA threshold, long positions may be favored; conversely, if it stays below the EMA, short positions may be initiated.
IIS (Iron Impulse Shield)
IIS helps to filter out risky trades by measuring recent price shocks or surges. If an extreme movement is detected, the strategy may temporarily disable longs or shorts to avoid false signals.
IAVD (Iron Auto Volume Detector)
This functionality automatically detects the average market volume over a defined period (regardless of the market, since it relies on real data). When entering a position, it ensures that overall volume is high enough to confirm a genuinely active, robust market. By providing an additional filter, it can strengthen the decision-making process whenever the market’s participation level is in question.
Panel
IronBot v4 displays a real-time backtest panel that summarizes the selected configuration (including the current pair, analysis window, enabled filters), as well as showing net profit, applicable exchange fees, country taxes, and the final net balance. This gives traders an immediate overview of strategy performance and risk metrics.
What Pinescript Adds Visually
The script plots:
Fibonacci levels (highlighting potential reversal zones)
Trend lines indicating bullish (green) or bearish (red) lean
Optional EMA line
Optional Fibonacci forecast lines for anticipating future moves
Automatic labeling of entry, take-profit, and stop-loss levels, indicating the profit percentage of each trade.
3. Explanation of Inputs
The strategy exposes multiple inputs that can be toggled or configured by the user:
Analysis Window : Dictates how many bars to consider for high/low calculations and the fib retracement thresholds.
TRADES
Display TP/SL: For displaying Take profits and Stop loss.
Display Forecast: When enabled, this feature calculates and projects possible future Fibonacci retracements using historical data, helping traders anticipate potential upcoming trade setups.
Leverage: Only used for the Panel and not for trades. Lets you amplify your position size; higher leverage increases potential gains but also heightens risk. TradingView strategy is using properties for doing this.
Exchange Maker Fees & Exchange Taker Fees: Only used for the Panel and not for trades. Define the percentage cost applied by your exchange for maker and taker trades, respectively. These fees are accounted for in final profit calculations of the Panel.
Country Tax: Only used for the Panel and not for trades. Specifies a tax percentage to be deducted from net profits.
STOP LOSS and TAKE PROFITS
Stop-Loss & Take-Profit Parameters: Controls the percentage distances at which the strategy will exit positions. Additionally, you can configure up to four distinct take-profit levels (TP1 through TP4). Each level should be higher target than the previous one, and you can assign a specific percentage of the total position to close at each TP, ensuring the sum equals 100%. A break-even feature is also available when multiple TPs are used.
EMA
EMA (Exponential Moving Average) Option: When enabled, the strategy opens long trades only if the current price is above the specified EMA length, and opens short trades only if it is below that threshold.
PANELS
Show Panel: For displaying the backtest integrated panel.
IRON IMPULSE SHIELD (IIS)
IIS (Iron Impulse Shield) Option: When enabled, IIS continuously monitors recent price volatility depending on the analysis window set. If the market experiences an extreme surge or drop beyond a specified threshold, IIS temporarily blocks new long or short positions.
IRON AUTO VOLUME DETECTOR (IAVD)
IAVD (Iron Auto Volume Detector) Option: When enabled, it continuously measures the average market volume over a special period, irrespective of the specific trading pair. This ensures that IronBot v4 focuses on markets with robust participation, reducing the likelihood of entering trades during low-liquidity conditions.
By changing these values, IronBot v4 reacts differently to market structure and risk management requirements. Stop-loss and take-profit levels will adjust accordingly, while advanced filters (like EMA or IIS) influence when trades can open.
4. TradingView Strategy Properties
IronBot v4 uses the built-in TradingView “strategy” functionality. In particular:
Order Placement: The code calls strategy.entry() and strategy.close() for direct orders, ensuring signals are sent immediately (no limit orders are used). This helps connect with exchange signal bots for automated execution.
Initial Capital: The code uses initial capital defined in properties for calculating Net balance in the integrated panel.
On bar close: This strategy fill orders on bar close.
Pyramiding: This strategy can take only 1 successive trade in the same direction
Be careful to configure your leverage input depending on your strategy properties.
5. Visualization
5. Purpose & Disclaimer
This script is for educational purposes only and does not constitute financial advice. Past performance does not guarantee future results. Always confirm your own risk tolerance and consult a financial professional before placing live trades. Trading leveraged products can involve substantial risk of loss.

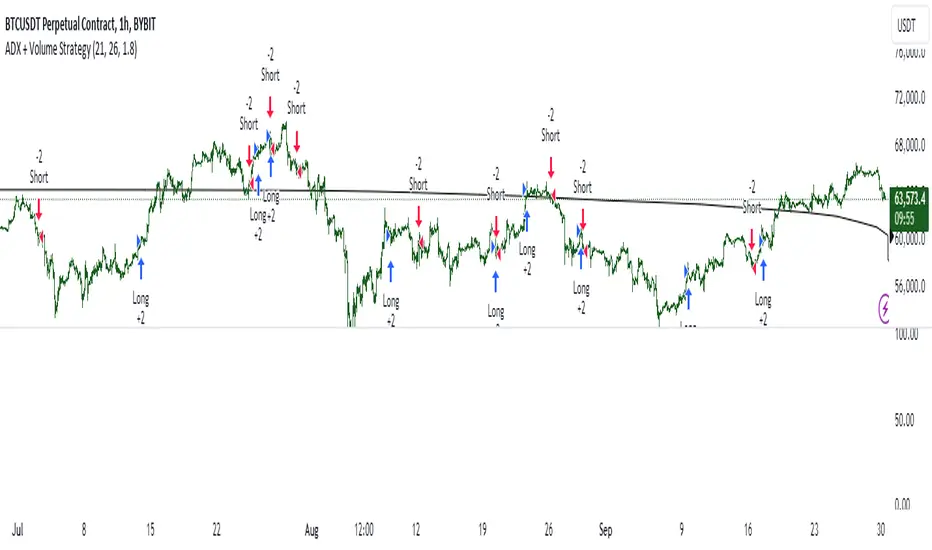
ADX + Volume Strategy### Strategy Description: ADX and Volume-Based Trading Strategy
This strategy is designed to identify strong market trends using the **Average Directional Index (ADX)** and confirm trading signals with **Volume**. The idea behind the strategy is to enter trades only when the market shows a strong trend (as indicated by ADX) and when the price movement is supported by high trading volume. This combination helps filter out weaker signals and provides more reliable entries into positions.
### Key Indicators:
1. **ADX (Average Directional Index)**:
- **Purpose**: ADX is a technical indicator that measures the strength of a trend, regardless of its direction (up or down).
- **Usage**: The strategy uses ADX to determine whether the market is trending strongly. If ADX is above a certain threshold (default is 25), it indicates that a strong trend is present.
- **Directional Indicators**:
- **DI+ (Directional Indicator Plus)**: Indicates the strength of the upward price movement.
- **DI- (Directional Indicator Minus)**: Indicates the strength of the downward price movement.
- ADX does not indicate the direction of the trend but confirms that a trend exists. DI+ and DI- are used to determine the direction.
2. **Volume**:
- **Purpose**: Volume is a key indicator for confirming the strength of a price movement. High volume suggests that a large number of market participants are supporting the movement, making it more likely to continue.
- **Usage**: The strategy compares the current volume to the 20-period moving average of the volume. The trade signal is confirmed if the current volume is greater than the average volume by a specified **Volume Multiplier** (default multiplier is 1.5). This ensures that the trade is supported by strong market participation.
### Strategy Logic:
#### **Entry Conditions:**
1. **Long Position** (Buy):
- **ADX** is above the threshold (default is 25), indicating a strong trend.
- **DI+ > DI-**, signaling that the market is trending upward.
- The **current volume** is greater than the 20-period average volume multiplied by the **Volume Multiplier** (e.g., 1.5), indicating that the upward price movement is backed by sufficient market activity.
2. **Short Position** (Sell):
- **ADX** is above the threshold (default is 25), indicating a strong trend.
- **DI- > DI+**, signaling that the market is trending downward.
- The **current volume** is greater than the 20-period average volume multiplied by the **Volume Multiplier** (e.g., 1.5), indicating that the downward price movement is backed by strong selling activity.
#### **Exit Conditions**:
- Positions are closed when the opposite signal appears:
- **For long positions**: Close when the short conditions are met (ADX still above the threshold, DI- > DI+, and the volume condition holds).
- **For short positions**: Close when the long conditions are met (ADX still above the threshold, DI+ > DI-, and the volume condition holds).
### Parameters:
- **ADX Period**: The period used to calculate ADX (default is 14). This controls how sensitive the ADX is to price movements.
- **ADX Threshold**: The minimum ADX value required for the strategy to consider the market trend as strong (default is 25). Higher values focus on stronger trends.
- **Volume Multiplier**: This parameter adjusts how much higher the current volume needs to be compared to the 20-period moving average for the signal to be valid. A value of 1.5 means the current volume must be 50% higher than the average volume.
### Example Trade Flow:
1. **Long Trade Example**:
- ADX > 25, confirming a strong trend.
- DI+ > DI-, confirming that the trend direction is upward.
- The current volume is 50% higher than the 20-period average volume (multiplied by 1.5).
- **Action**: Enter a long position.
2. **Short Trade Example**:
- ADX > 25, confirming a strong trend.
- DI- > DI+, confirming that the trend direction is downward.
- The current volume is 50% higher than the 20-period average volume.
- **Action**: Enter a short position.
### Strengths of the Strategy:
- **Trend Filtering**: The strategy ensures that trades are only taken when the market is trending strongly (confirmed by ADX) and that the price movement is supported by high volume, reducing the likelihood of false signals.
- **Volume Confirmation**: Using volume as confirmation provides an additional layer of reliability, as volume spikes often accompany sustained price moves.
- **Dual Signal Confirmation**: Both trend strength (ADX) and volume conditions must be met for a trade, making the strategy more robust.
### Weaknesses of the Strategy:
- **Limited Effectiveness in Range-Bound Markets**: Since the strategy relies on strong trends, it may underperform in sideways or non-trending markets where ADX stays below the threshold.
- **Lagging Nature of ADX**: ADX is a lagging indicator, which means that it may confirm the trend after it has already begun, potentially leading to late entries.
- **Volume Requirement**: In low-volume markets, the volume multiplier condition may not be met often, leading to fewer trade opportunities.
### Customization:
- **Adjust the ADX Threshold**: You can raise the threshold if you want to focus only on very strong trends, or lower it to capture moderate trends.
- **Adjust the Volume Multiplier**: You can change the multiplier to be more or less strict. A higher multiplier (e.g., 2.0) will require a stronger volume spike to confirm the signal, while a lower multiplier (e.g., 1.2) will allow more trades with weaker volume confirmation.
### Summary:
This ADX and Volume strategy is ideal for traders who want to follow strong trends while ensuring that the trend is supported by high trading volume. By combining a trend strength filter (ADX) and volume confirmation, the strategy aims to increase the probability of entering profitable trades while reducing the number of false signals. However, it may underperform in range-bound markets or in markets with low volume.
CVD Divergence Strategy.1.mmThis is the matching Strategy version of Indicator of the same name.
As a member of the K1m6a Lions discussion community we often use versions of the Cumulative Volume Delta indicator
as one of our primary tools along with RSI, RSI Divergences, Open interest, Volume Profile, TPO and Fibonacci levels.
We also discuss visual interpretations of CVD Divergences across multiple time frames much like RSI divergences.
RSI Divergences can be identified as possible Bullish reversal areas when the RSI is making higher low points while
the price is making lower low points.
RSI Divergences can be identified as possible Bearish reversal areas when the RSI is making lower high points while
the price is making higher high points.
CVD Divergences can also be identified the same way on any timeframe as possible reversal signals. As with RSI, these Divergences
often occur as a trend's momentum is giving way to lower volume and areas when profits are being taken signaling a possible reversal
of the current trending price movement.
Hidden Divergences are identified as calculations that may be signaling a continuation of the current trend.
Having not found any public domain versions of a CVD Divergence indicator I have combined some public code to create this
indicator and matching strategy. The calculations for the Cumulative Volume Delta keep a running total for the differences between
the positive changes in volume in relation to the negative changes in volume. A relative upward spike in CVD is created when
there is a large increase in buying vs a low amount of selling. A relative downward spike in CVD is created when
there is a large increase in selling vs a low amount of buying.
In the settings menu, the is a drop down to be used to view the results in alternate timeframes while the chart remains on current timeframe. The Lookback settings can be adjusted so that the divs show on a more local, spontaneous level if set at 1,1,60,1. For a deeper, wider view of the divs, they can be set higher like 7,7,60,7. Adjust them all to suit your view of the divs.
To create this indicator/strategy I used a portion of the code from "Cumulative Volume Delta" by @ contrerae which calculates
the CVD from aggregate volume of many top exchanges and plots the continuous changes on a non-overlay indicator.
For the identification and plotting of the Divergences, I used similar code from the Tradingview Technical "RSI Divergence Indicator"
This indicator should not be used as a stand-alone but as an additional tool to help identify Bullish and Bearish Divergences and
also Bullish and Bearish Hidden Divergences which, as opposed to regular divergences, may indicate a continuation.

Slight Swing Momentum Strategy.Introduction:
The Swing Momentum Strategy is a quantitative trading strategy designed to capture mid-term opportunities in the financial markets by combining swing trading principles with momentum indicators. It utilizes a combination of technical indicators, including moving averages, crossover signals, and volume analysis, to generate buy and sell signals. The strategy aims to identify market trends and capitalize on price momentum for profit generation.
Highlights:
The strategy offers several key highlights that make it unique and potentially attractive to traders:
Swing Trading with Momentum: The strategy combines the principles of swing trading, which aim to capture short-to-medium-term price swings, with momentum indicators that help identify strong price trends and potential breakout opportunities.
Technical Indicator Optimization: The strategy utilizes a selection of optimized technical indicators, including moving averages and crossover signals, to filter out the noise and focus on high-probability trading setups. This optimization enhances the strategy's ability to identify favourable entry and exit points.
Risk Management: The strategy incorporates risk management techniques, such as position sizing based on equity and dynamic stop loss levels, to manage risk exposure and protect capital. This helps to minimize drawdowns and preserve profits.
Buy Condition:
The buy condition in the strategy is determined by a combination of factors, including A1, A2, A3, XG, and weeklySlope. Let's break it down:
A1 Condition: The A1 condition checks for specific price relationships. It verifies that the ratio of the highest price to the closing price is less than 1.03, the ratio of the opening price to the lowest price is less than 1.03, and the ratio of the highest price to the previous day's closing price is greater than 1.06. This condition looks for a specific pattern indicating potential bullish momentum.
A2 Condition: The A2 condition checks for price relationships related to the closing price. It verifies that the ratio of the closing price to the opening price is greater than 1.05 or that the ratio of the closing price to the previous day's closing price is greater than 1.05. This condition looks for signs of upward price movement and momentum.
A3 Condition: The A3 condition focuses on volume. It checks if the current volume crosses above the highest volume over the last 60 periods. This condition aims to identify increased buying interest and potentially confirms the strength of the potential upward price movement.
XG Condition: The XG condition combines the A1 and A2 conditions and checks if they are true for both the current and previous bars. It also verifies that the ratio of the closing price to the 5-period EMA crosses above the 9-period SMA of the same ratio. This condition helps identify potential buy signals when multiple factors align, indicating a strong bullish momentum and potential entry point.
Weekly Trend Factor: The weekly slope condition calculates the slope of the 50-period SMA over a weekly timeframe. It checks if the slope is positive, indicating an overall upward trend on a weekly basis. This condition provides additional confirmation that the stock is in an upward trend.
When all of these conditions align, the buy condition is triggered, indicating a favourable time to enter a long position.
Sell Condition:
The sell condition is relatively straightforward in the strategy:
Sell Signal: The sell condition simply checks if the closing price crosses below the 10-period EMA. When this condition is met, it indicates a potential reversal or weakening of the upward price momentum, and a sell signal is generated.
Backtest Outcome:
The strategy was backtested over the period from January 22nd, 1999 to May 3rd, 2023, using daily candlestick charts for the NASDAQ: NVDA. The strategy used an initial capital of 1,000,000 USD, The order quantity is defined as 10% of the equity. The strategy allows for pyramiding with 1 order, and the transaction fee is set at 0.03% per trade. Here are the key outcomes of the backtest:
Net Profit: 539,595.84 USD, representing a return of 53.96%.
Percent Profitable: 48.82%
Total Closed Trades: 127
Profit Factor: 2.331
Max Drawdown: 68,422.70 USD
Average Trade: 4,248.79 USD
Average Number of Bars in Trades: 11, indicating the average duration of the trades.
Conclusion:
In conclusion, the Swing Momentum Strategy is a quantitative trading approach that combines swing trading principles with momentum indicators to identify and capture mid term trading opportunities. The strategy has demonstrated promising results during backtesting, including a significant net profit and a favourable profit factor.

Sine Wave TheoryThere are some ideas out there that the market is like a collection of quantum events and that it could all be broken down into sine waves. I created this script to put that to the test.
The idea is simple, I tested 3 different factors that could be put into sine wave form.
1.) Bar Change
2.) Volume Average Change
3.) Coin Flip
For the bar change, I simply allow the sine wave to move upwards or downwards if the bars have changed color in their sequence. For example, if there were 3 red bars and 1 green bar, it would not move the sine wave up or down until the green bar appeared.
For the average volume change, it was the same idea, except that the sine wave could only move up or down if the volume had moved up or below the average value of the length given for calculating the average volume.
Finally, the coin flip simply simulates flipping a coin, and allows the sine wave to move one direction or the other once it has a side that is different from the previous chosen side. For example, heads, heads, heads, tails (once it flipped to tails, this would allow it to move a direction).
The sine wave trading theory that I watched claimed that if you know the correct sine wave # (which is how large the peak is, and/or the sine wave count which is how many peaks and valleys occur) that you can successfully predict future trades. Their claims that the reason it does not look like a perfect sine wave for these events is because there is different amounts of trading going on, thus the timing will be slightly off.
I am posting this to disagree with their ideas. For example, if you select to turn on trading for coin flip and turn off bar change, you will see the coin flip did better on the default settings!
It just so happens that any setting will eventually be good, making all the sine wave variations just completely random if you win or not.
I posted this to demonstrate how silly trading sine waves is. The real trick is using cosine and tangent waves... lol j/k
I hope this helps someone avoid this scam concept.
SSL-Extendido-Estrategia por Neil--
DESCRIPTION
SSL Strategy with ATR, Volume, ADX, TakeProfit, Profit Cycle Indicator and Extended Trend Control.
The component is based on moving averages, its effectiveness is greater in long periods: 4H, 1D, 1S
HOW DOES IT WORK
The component works with a fluctuation band in which the price moves, it consists of an upper moving average of 10 periods and a lower moving average of 8 periods, both configurable according to the volatility of the asset. Since the band has little width, prices trigger buy and sell alerts frequently, but the component has a trend control based on SMA, EMA, VWAP, HMA that allows to take advantage of the intermediate trend of the asset and cancel the early buy alerts and sale, maximizing the development of the parabola, additionally the component allows to confirm the entries with indicators such as: ATR (valatility), Volume and ADX (direction strength), this to achieve entries with a greater probability of success.
WHY USE IT
Its configuration is simple, it requires adjusting few parameters and although it is ideal for long-term operations, it allows periodic take profit, under the philosophy of profit evaluation at present point and not profit evaluation at future point, ensuring income in less time. additionally it has a visual profit indicator, which allows you to graphically see if a money generation cycle (buy or sell) is a winner or a loser, it also allows you to operate according to the general trend of the asset, that is, you can adjust the behavior of the resource to carry out purchase and sale operations or only purchase or only sale. This component not only graphically indicates when to take profit (takeProfit), but it is responsible for closing the current operation and opening a new operation in the same direction. This is the ideal resource for automated alert-based trading against platforms such as 3Commas.
HOW TO USE IT
Press the "Indicators" option, go to the "Public Library" segment, write the name "SSL-Extendido-Estrategia por Neil", double-click on the record and it will be added to your work panel, now, all that remains is to configure its parameters and use it. By pressing the Reset Values Option, you will have a basic configuration that respects the fundamental concepts of trading and the use of multiple indicators in a single study.
--
DESCRIPCIÓN
Estrategia SSL con ATR, Volume, ADX, TakeProfit, indicador de ciclo de ganancia y control de tendencia extendida.
El componente se basa en medias moviles, su efectividad es mayor en temporalidades largas: 4H,1D,1S
COMO FUNCIONA
El componente trabaja con una banda de fluctuación en la que se mueve el precio, consta de una media movil superior de 10 periodos y una media movil inferior de 8 periodos, ambas configurables segun la volatilidad del activo. Dado que la banda tiene poca amplitud, los precios gatillan alertas de compra y venta frecuentemente, pero el componente posee un control de tendencia basado en SMA, EMA, VWAP, HMA que permite aprovechar la tendencia intermedia del activo y anular las alertas tempranas de compra y venta, maximizando el dearrollo de la parabola, adicionalmente el componente permite confirmar las entradas con indicadores como: ATR (valatilidad), Volumen y ADX (fuerza de la dirección), esto para lograr entradas con mayor probabilidad de exito.
POR QUÉ USARLO
Su configuración es simple, requiere ajustar pocos parametros y aunque es ideal para operaciones de temporalidad larga, permite efectuar take profit periodicos, bajo la filosofía de evaluación de ganancia a punto presente y no evaluación de ganancia a punto futuro, asegurando ingresos en menor tiempo, adicionalmente posee un idicador de ganancia visual, que permite ver graficamente si un ciclo de generación de dinero (compra o venta) es ganador o perdedor, tambien permite operar segun la tendencia general del activo, es decir que usted puede ajustar el comportamiento del recurso para efectuar operaciones de compra y venta o solo compra o solo venta. Este componente no solo indica gráficamente cuando tomar ganancias (takeProfit), sino que se encarga de cerrar la operación en curso y abrir una nueva operación en la misma dirección. Este es el recurso ideal para efectuar trading automatizado basado en alertas, contra plataformas como 3Commas.
COMO USARLO
Presione la opción "Indicadores", ubíquese en el segmento "Libreria Publica", escriba el nombre "SSL-Extendido-Estrategia por Neil", haga doble clic sobre el registro y lo tendrá agregado en su panel de trabajo, ahora, solo resta configurar sus parámetros y usarlo. Presionando la opción Reestablecer Valores, ya tendrá una configuración básica que respeta los conceptos fundamentales del trading y el uso de múltiple de indicadores un un solo estudio.

HYE Trend Hunter [Strategy]*** Stratejinin Türkçe ve İngilizce açıklaması aşağıya eklenmiştir.
HYE Trend Hunter
In this strategy, two of the most basic data (price and volume) necessary for detecting trends as early as possible and entering the trade on time are used. In this context, the approaches of some classical and new generation indicators using price and volume have been taken into account.
The strategy is prepared to generate buy signals only. The following steps were followed to generate the buy and exit signals.
1-) First of all, the two most basic data of the strategy, “slow leading line” and “fast leading line” need to be calculated. For this, we use the formula of the “senkou span A” line of the indicator known as the Ichimoku Cloud. We also need to calculate lines known as tenkan sen and kijun sen in ichimoku because they are used in the calculation of this formula.
The high and low values of the candles are taken into account when calculating the Tenkansen, Kijunsen and Senkou Span A lines in the Ichimoku cloud. In this strategy, the highest and lowest values of the periodic VWAP are taken into account when calculating the "slow leading line" and "fast leading line". (The periodic vwap formula was coded and made available by @neolao on tradingviev). Also, in the ichimoku cloud, while the Senkou Span A line is plotted 26 periods into the future, we consider the values of the fast and slow leading lines in the last candle in this strategy.
ORIGINAL ICHIMOKU SPAN A FORMULA
Tenkansen = (Highest high of the last 9 candles + Lowest low of the last 9 candles) / 2
Kijunsen = (Highest high of the last 26 candles + Lowest low of the last 26 candles) / 2
Senkou Span A = Tenkansen + Kijunsen / 2
HYE TREND HUNTER SPAN A FORMULA*
Tenkansen = (Highest VWAP of the last 9 candles + Lowest VWAP of the last 9 candles) / 2
Kijunsen = (Highest VWAP of the last 26 candles + Lowest VWAP of the last 26 candles) / 2
Senkou Span A = Tenkansen + Kijunsen / 2
* We use the original ichimoku values 9 and 26 for the slow line, and 5 and 13 for the fast line. These settings can be changed from the strategy settings.
2-) At this stage, we have 2 lines that we obtained by using the formula of the ichimoku cloud, one of the most classical trend indicators, and by including the volume-weighted average price.
a-) Fast Leading Line (5-13)
b-) Slow Leading Line (9-26)
For the calculation we will do soon, we get a new value by taking the average of these two lines. Using this value, which is the average of the fast and slow leading lines, we plot the Bollinger Bands indicator, which is known as one of the most classic volatility indicators of technical analysis. Thus, we are trying to understand whether there is a volatility change in the market, which may mean the presence of a trend start. We will use this data in the calculation of buy-sell signals.
In the classical Bollinger Bands calculation, the standard deviation is calculated by applying a multiplier at the rate determined by the user (2 is used in the original settings) to the moving average calculated with the “closing price”, and this value is added or subtracted from the moving average and upper band and lower band lines are drawn.
In the HYE Trend Hunter Strategy, instead of the moving average calculated with the closing price in the Bollinger Band calculation, we consider the average of the fast and slow leading lines calculated in the 1st step and draw the Bollinger upper and lower bands accordingly. We use the values of 2 and 20 as the standard deviation and period, as in the original settings. These settings can also be changed from the strategy settings.
3-) At this stage, we have fast and slow leading lines trying to understand the trend direction using VWAP, and Bollinger lower and upper bands calculated by the average of these lines.
In this step, we will use another tool that will help us understand whether the invested market (forex, crypto, stocks) is gaining momentum in volume. The Time Segmented Volume indicator was created by the Worden Brothers Inc. and coded by @liw0 and @vitelot on tradingview. The TSV indicator segments the price and volume of an investment instrument according to certain time periods and makes calculations on comparing these price and volume data to reveal the buying and selling periods.
To trade in the buy direction on the HYE Trend Hunter Strategy, we look for the TSV indicator to be above 0 and above its exponential moving average value. TSV period and exponential moving average period settings (13 and 7) can also be changed in the strategy settings.
BUY SIGNAL
1-) Fast Leading Line value should be higher than the Fast Leading Line value in the previous candle.
2-) Slow Leading Line value should be higher than the Slow Leading Line value in the previous candle.
3-) Candle Closing value must be higher than the Upper Bollinger Band.
4-) TSV value must be greater than 0.
5-) TSV value must be greater than TSVEMA value.
EXIT SIGNAL
1-) Fast Leading Line value should be lower than the Fast Leading Line value in the previous candle.
2-) Slow Leading Line value should be lower than the Slow Leading Line value in the previous candle.
TIPS AND WARNINGS
1-) The standard settings of the strategy work better in higher timeframes (4-hour, daily, etc.). For lower timeframes, you should change the strategy settings and find the best value for yourself.
2-) All lines (fast and slow leading lines and Bollinger bands) except TSV are displayed on the strategy. For a simpler view, you can hide these lines in the strategy settings.
3-) You can see the color changes of the fast and slow leading lines as well as you can specify a single color for these lines in the strategy settings.
4-) It is an strategy for educational and experimental purposes. It cannot be considered as investment advice. You should be careful and make your own risk assessment when opening real market trades using this strategy.
_______________________________________________
HYE Trend Avcısı
Bu stratejide, trendlerin olabildiğince erken tespit edilebilmesi ve zamanında işleme girilebilmesi için gerekli olan en temel iki veriden (fiyat ve hacim) yararlanılmaktadır. Bu kapsamda, fiyat ve hacim kullanan bazı klasik ve yeni nesil indikatörlerin yaklaşımları dikkate alınmıştır.
Strateji yalnızca alış yönlü sinyaller üretecek şekilde hazırlanmıştır. Alış ve çıkış sinyallerinin üretilmesi için aşağıdaki adımlar izlenmiştir.
1-) Öncelikle, stratejinin en temel iki verisi olan “yavaş öncü çizgi” ve “hızlı öncü çizgi” hesaplamasının yapılması gerekiyor. Bunun için de Ichimoku Bulutu olarak bilinen indikatörün “senkou span A” çizgisinin formülünü kullanıyoruz. Bu formülün hesaplamasında kullanılmaları nedeniyle ichimoku’da tenkan sen ve kijun sen olarak bilinen çizgileri de hesaplamamız gerekiyor.
Ichimoku bulutunda Tenkansen, Kijunsen ve Senkou Span A çizgileri hesaplanırken mumların yüksek ve düşük değerleri dikkate alınıyor. Bu stratejide ise “yavaş öncü çizgi” ve “hızlı öncü çizgi” hesaplanırken periyodik VWAP’ın en yüksek ve en düşük değerleri dikkate alınıyor. (Periyodik vwap formülü, tradingviev’de @neolao tarafından kodlanmış ve kullanıma açılmış). Ayrıca, ichimoku bulutunda Senkou Span A çizgisi geleceğe yönelik çizilirken (26 mum ileriye dönük) biz bu stratejide öncü çizgilerin son mumdaki değerlerini dikkate alıyoruz.
ORJİNAL ICHIMOKU SPAN A FORMÜLÜ
Tenkansen = (Son 9 mumun en yüksek değeri + Son 9 mumun en düşük değeri) / 2
Kijunsen = (Son 26 mumun en yüksek değeri + Son 26 mumun en düşük değeri) / 2
Senkou Span A = Tenkansen + Kijunsen / 2
HYE TREND HUNTER SPAN A FORMÜLÜ*
Tenkansen = (Son 9 mumun en yüksek VWAP değeri + Son 9 mumun en düşük VWAP değeri) / 2
Kijunsen = (Son 26 mumun en yüksek VWAP değeri + Son 26 mumun en düşük VWAP değeri) / 2
Senkou Span A = Tenkansen + Kijunsen / 2
* Yavaş çizgi için orijinal ichimoku değerleri olan 9 ve 26’yı kullanırken, hızlı çizgi için 5 ve 13’ü kullanıyoruz. Bu ayarlar, strateji ayarlarından değiştirilebiliyor.
2-) Bu aşamada, elimizde en klasik trend indikatörlerinden birisi olan ichimoku bulutunun formülünden faydalanarak, işin içinde hacim ağırlıklı ortalama fiyatı da sokmak suretiyle elde ettiğimiz 2 çizgimiz var.
a-) Hızlı Öncü Çizgi (5-13)
b-) Yavaş Öncü Çizgi (9-26)
Birazdan yapacağımız hesaplama için bu iki çizginin de ortalamasını alarak yeni bir değer elde ediyoruz. Hızlı ve yavaş öncü çizgilerin ortalaması olan bu değeri kullanarak, teknik analizin en klasik volatilite indikatörlerinden birisi olarak bilinen Bollinger Bantları indikatörünü çizdiriyoruz. Böylelikle piyasada bir trend başlangıcının varlığı anlamına gelebilecek volatilite değişikliği var mı yok mu anlamaya çalışıyoruz. Bu veriyi al-sat sinyallerinin hesaplamasında kullanacağız.
Klasik Bollinger Bantları hesaplamasında, “kapanış fiyatıyla” hesaplanan hareketli ortalamaya, kullanıcı olarak belirlenen oranda (orijinal ayarlarında 2 kullanılır) bir çarpan uygulanarak standart sapma hesaplanıyor ve bu değer hareketli ortalamaya eklenip çıkartılarak üst bant ve alt bant çizgileri çiziliyor.
HYE Trend Avcısı stratejisinde, Bollinger Bandı hesaplamasında kapanış fiyatıyla hesaplanan hareketli ortalama yerine, 1. adımda hesapladığımız hızlı ve yavaş öncü çizgilerin ortalamasını dikkate alıyoruz ve buna göre bollinger üst ve alt bantlarını çizdiriyoruz. Standart sapma ve periyot olarak yine orijinal ayarlarında olduğu gibi 2 ve 20 değerlerini kullanıyoruz. Bu ayarlar da strateji ayarlarından değiştirilebiliyor.
3-) Bu aşamada, elimizde VWAP kullanarak trend yönünü anlamaya çalışan hızlı ve yavaş öncü çizgilerimiz ile bu çizgilerin ortalaması ile hesaplanan bollinger alt ve üst bantlarımız var.
Bu adımda, yatırım yapılan piyasanın (forex, kripto, hisse senedi) hacimsel olarak ivme kazanıp kazanmadığını anlamamıza yarayacak bir araç daha kullanacağız. Time Segmented Volume indikatörü, Worden Kardeşler şirketi tarafından oluşturulmuş ve tradingview’de @liw0 ve @vitelot tarafından kodlanarak kullanıma açılmış. TSV indikatörü, bir yatırım aracının fiyatını ve hacmini belirli zaman aralıklarına göre bölümlere ayırarak, bu fiyat ve hacim verilerini, alış ve satış dönemlerini ortaya çıkarmak için karşılaştırmak üzerine hesaplamalar yapar.
HYE Trend Avcısı stratejisinde alış yönünde işlem yapmak için, TSV indikatörünün 0’ın üzerinde olmasını ve kendi üstel hareketli ortalama değerinin üzerinde olmasını arıyoruz. TSV periyodu ve üstel hareketli ortalama periyodu ayarları da (13 ve 7) strateji ayarlarından değiştirilebiliyor.
ALIŞ SİNYALİ
1-) Hızlı Öncü Çizgi değeri bir önceki mumdaki Hızlı Öncü Çizgi değerinden yüksek olmalı.
2-) Yavaş Öncü Çizgi değeri bir önceki mumdaki Yavaş Öncü Çizgi değerinden yüksek olmalı.
3-) Kapanış Değeri, Üst Bollinger Bandı değerinden yüksek olmalı.
4-) TSV değeri 0’dan büyük olmalı.
5-) TSV değeri TSVEMA değerinden büyük olmalı.
ÇIKIŞ SİNYALİ
1-) Hızlı Öncü Çizgi değeri bir önceki mumdaki Hızlı Öncü Çizgi değerinden düşük olmalı.
2-) Yavaş Öncü Çizgi değeri bir önceki mumdaki Yavaş Öncü Çizgi değerinden düşük olmalı.
İPUÇLARI VE UYARILAR
1-) Stratejinin standart ayarları, yüksek zaman dilimlerinde (4 saatlik, günlük vs.) daha iyi çalışıyor. Düşük zaman dilimleri için strateji ayarlarını değiştirmeli ve kendiniz için en iyi değeri bulmalısınız.
2-) Stratejide tüm çizgiler (hızlı ve yavaş öncü çizgiler ile bollinger bantları) -TSV dışında- açık olarak gelmektedir. Daha sade bir görüntü için bu çizgilerin görünürlüğünü strateji ayarlarından gizleyebilirsiniz.
3-) Hızlı ve yavaş öncü çizgilerin renk değişimlerini görebileceğiniz gibi bu çizgiler için tek bir renk olarak da strateji ayarlarında belirleme yapabilirsiniz.
4-) Eğitim ve deneysel amaçlı bir stratejidir. Yatırım tavsiyesi olarak değerlendirilemez. Bu stratejiyi kullanarak gerçek piyasa işlem açarken dikkatli olmalı ve kendi risk değerlendirmenizi yapmalısınız.

Sentiment OscillatorPrice moves when there are more market takers than there are market makers at a certain price (i.e. price moves up when there are more market buys than limit sells and vice versa). The idea of this indicator is to show the ratio between market takers and market makers in a way that is intuitive to technical analysis methods, and hopefully revealing the overall sentiment of the market in doing so. You can use it in the same way you would other oscillators (histogram crossing zero, divergences, etc). The main difference between this and most volume-weighted indicators is that the price is divided by volume instead of multiplied by it, thus giving you a rough idea of how much "effort" it took to move the price. My hypothesis is that when more volume is needed to move the price, that means bulls and bears are not in agreement of what the "fair price" should be for an asset (e.g. if the candle closes only a bit higher than its open but there's a huge spike in volume, that tells you that a majority of the market are starting to think the price is too high and they've started selling).
Methods of Calculation
1. Price Change Per Volume
The main method this indicator uses to reveal market sentiment is by comparing price change to the volume of trades in a bar.
You will see this calculation plotted in its most basic form by ticking the "Show Bar per Bar Change/Volume" box in the inputs dialog. I personally found that the plots were too noisy and cannot be used in real time reliably due to the fact that there is not much volume at the open of a new bar. I decided to leave in the option to use this method, in case you'd like to experiment with it or get a better grasp of how the indicator works.
2. Exponential Moving Averages
In my quest to smooth out the plotted data, I experimented with exponential moving averages. Applying an EMA on the change per volume data did smooth it out a bit, but still left in a lot of noise. So I worked around it by applying the EMA to the price change first, and then dividing it by the EMA of the volume. The term I use for the result of this calculation is "Market Sentiment" (do let me know if you have a better-fitting term for it ;-)), and I have kept it as an option that you can use in the way you would use other oscillators like CMF, OBV, etc. This option is unticked by default.
3. MACD
I left "Market Sentiment" unchecked as the default option because I thought an easier way to use this indicator would be as a momentum indicator like the MACD . So that's what I turned it into! I applied another EMA on the Market Sentiment, added a slower EMA to subtract from the first, and now we have a MACD line. I added a signal line to subtract from the MACD , and the result is plotted as a histogram... ish . I used area instead of columns for plot style so you don't get confused when comparing with a regular MACD indicator, but you can always change it if an actual histogram is more your taste.
The "histogram" is the main gauge of sentiment change momentum and it is easiest to use, that is why it is the only calculation plotted by default.
Methods of Use
As I have mentioned before, you can use this as you would other oscillators.
-The easiest way to use this indicator is with the Momentum histogram, where crosses over 0 indicate increasing bullish sentiment, and crosses below 0 indicate increasing bearish sentiment. You may also spot occasional divergences with the histogram.
-For the Market Sentiment option, the easiest way to use it is to look for divergences.
-And if you use the "Price Change per Volume of Each Bar", well... I honestly don't know. I guess divergences would be apparent towards the close of a bar, but in realtime, I don't recommend you use this. Maybe if you'd like to study the market movement, looking at historical data and comparing price, volume , and Change per Volume of each bar would come in handy in a pseudo-tape-reading kind of way.
Anyway, that's my explanation of this indicator. The default values were tested on BTC/USDT (Binance) 4h with decent results. You'll have to adjust the parameters for different markets and timeframes.
I have published this as a strategy so you can test out how the indicator performs as you're tweaking the parameters.
I'm aware that the code might not be the cleanest as I have only started learning pine (and code in general) for about a month, so any suggestions to improve the script would be appreciated!
Good luck and happy trading :-)

Full CRYPTO pack macd, rsi, obv, ema strategyThis is a simple, yet very efficient crypto strategy, adapted to 4h time frame, on big coins like ETH and BTC. However it can be adapted to other markets, timeframes etc
For this strategy I use a combination of a trend line, an oscillator, price action and volume.
This strategy has both the opportunity to go long and short.
As well, it has a leverage simulator .
The rules are the next ones:
Long : we check that current candle is ascending and above the moving average, the macd is in positive range, rsi is below overbought level and volume is bigger than the moving avg of volume.
For short, we have the opposite long rules.
If you have any questions, please let me know !

Hilega_Milega_StrategyThis study shows the price action strength using RSI & Moving Averages.
In this study different line indicates below measures---
BlackLine - Strength
Red Line - Volume
GreenLine - Price
1. Volume line is below price and strength then the price may go up.
2. Volume line is above price and strength then the price may go down.
3. Volume line below strength line price may stop going down.
4. Price line above strength then price may go down.
There is a total of 2 zones that indicate the price strength in the red zone price is showing strength ness and in the blue zone, the price is showing weakness.
This study helps to identify if the price is having strength or not if going up or down based on volume.\
Strategy give signal based on above-mentioned line as follows.
Buy - Strength line above volume & price line + Price line crossover Volume line.
Sell - Strength line below volume & price line + Price line crossunder Volume line.

[astropark] VWAP Crosses [strategy]Dear Followers,
today a new Swing and Scalping Strategy based on WVAP , mainly designed for Bitcoin and High-Cap Cryptocurrencies, like Ethereum. It works also on Forex and Stocks.
It works great since 15m and above till 1D. I suggest you to use it on 15m, 30m or 1h timeframes .
VWAP or "Volume Weighted Average Price" is a volume-based indicator similar to a moving average.
This trading indicator is used to identify market resistance and support levels and is represented as a weighted average price for the treaded volumes.
My strategy will help you identify main support-resistance level to be careful of and it will trigger a buy or a sell depending on how price will intereact with vwaps.
green means we are in a bullish trend, in fact it start with a "buy" signal
red means we are in a bearish trend, in fact it start with a "sell" signal
blue means we are in a moment where trend may change, so be careful and always remember that taking profits is awesome and have a stoploss is a must in trading
The user who wants to use this strategy, especially via an automated bot, must always set a stoploss (example 150$ from entry on bitcoin) or use a proper risk management strategy .
This is not the "Holy Grail", so use it with caution. It's highly suggested to use a proper money management .
This script will let you backtest this script and check profitability on your preferred market.
The alarms version of this indicator, which will let you set all notifications you may need in order to be alerted on each triggered signals, can be found by searching for astropark "VWAP Crosses"
This is a premium indicator , so send me a private message in order to get access to this script.
VEST [mcristianrios] StrategyVEST is the intelectual part of two indicators to enter and exit Long or Short trades with ease.
The core functionality will not be fully explained but why VEST?
Volume: There are three configurations base on Volume in order to operate in favor of the market.
Ema vs Ema: There are three configurations base on two EMAs crossing each other.
Super Trend: If trend goes Long why not? Volume and EMA alone are not enough and it works as a filter to avoid not favorable trades. Factor and ATR Length are configurable.
What else do you I to offer? Oh yeah!
Going with the idea of managing risk VEST can enable up to 7 TP signals. So, if profit pips is 100 at 1:1 and take profit 2.5:1 is enabled we'll have: TP: 250pips and SL: 100pips
What markets can this indicator be used on?
Only Forex.
What time-frames can this indicator be used on?
This indicator can be used from 5 minutes up to 37 minutes.
Does Study Indicator repaint?
No
-- It should be configured to send alerts Once Per Bar Close
* Besides that the only functionality of the Study Indicator is to send Alerts *
Does the study indicator fill SL Price and TP Price on alerts?
Yes, it certainly does having one alert per Take Profit.
So can I automate this?
Of course yes! And alert messages are set by default to work with TradingConnector.
As a preview suggested configuration for a Long 2.5:1 operation looks like: long tradesymbol={{ticker}} slprice={{plot("SLLong")}} tpprice={{plot("TPLong25")}}
-----------------------------------------------------------------------------------------
This is not a free to use indicator. Get in touch with me if you would like access to both indicators for a free trial before deciding on a paid access for a period of your choice.
-----------------------------------------------------------------------------------------

💲SuPeR-RePaNoCHa💲 [Backtest]Script for automatic trading (Backtest). This is the second part of the previous RePanoCHa script but with Take Profit.
It Use 6 indicators + volume:
-JURIK MOVING AVERAGE
-RANGE FILTER (from Donovan Wall)
-ADX (ORIGINAL VERSION)
-PARABOLIC SAR
-RSI + VOLUME WEIGHTED
-MACD
-VOLUME
To close the position you can choose between Take Profit only, Trailing Stop only or both at the same time.
