Search in scripts for "vwap"


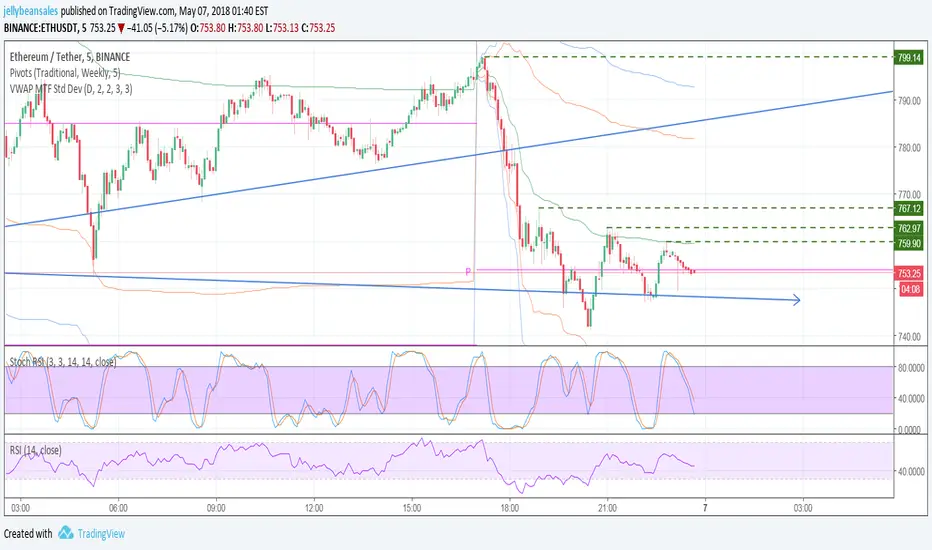
VWAP MTF Std DevIncludes 2 sets of standard deviations, with a variable time frame for Daily (D) Weekly (W) and Monthly(M)
Multi-Timeframe VWAP Master ProThe Multi-Timeframe VWAP Suite is a comprehensive and highly customizable indicator designed for traders who rely on Volume-Weighted Average Price (VWAP) across multiple timeframes and periods. This tool provides a complete suite of VWAP calculations, including daily, weekly, monthly, quarterly, yearly, and custom VWAPs, allowing traders to analyze price action and volume trends with precision. Whether you're a day trader, swing trader, or long-term investor, this indicator offers unparalleled flexibility and depth for your trading strategy.
Multi-Timeframe VWAPs:
Daily, Weekly, Monthly, Quarterly, and Yearly VWAPs: Track VWAP across various timeframes to identify key support and resistance levels.
Customizable Timeframes: Use the SMA timeframe input to adjust the period for moving averages and other calculations.
Previous Period VWAPs:
Previous Daily, Weekly, Monthly, and Quarterly VWAPs: Analyze historical VWAP levels to understand past price behavior and identify potential reversal zones.
Previous Year Quarterly VWAPs: Compare current price action to VWAP levels from specific quarters of the previous year.
Custom VWAPs:
Custom Start Date and Timeframe: Define your own VWAP periods by specifying a start date and timeframe, allowing for tailored analysis.
Dynamic Custom VWAP Calculation: Automatically calculates VWAP based on your custom inputs, ensuring flexibility for unique trading strategies.
Seasonal and Yearly VWAPs:
April, July, and October VWAPs: Analyze seasonal trends by tracking VWAP levels for specific months.
Yearly VWAP: Get a broader perspective on long-term price trends with the yearly VWAP.
SMA Integration:
SMA Overlay: Combine VWAP analysis with a Simple Moving Average (SMA) for additional confirmation of trends and reversals.
Customizable SMA Length and Timeframe: Adjust the SMA settings to match your trading style and preferences.
User-Friendly Customization:
Toggle Visibility and Labels: Easily enable or disable the display of specific VWAPs and their labels to keep your chart clean and focused.
Color Customization: Each VWAP line and label is color-coded for easy identification and can be customized to suit your preferences.
Dynamic Labeling:
Automatic Labels: Labels are dynamically placed on the last bar, providing clear and concise information about each VWAP level.
Customizable Label Text: Labels include detailed information, such as the timeframe or custom period, for quick reference.
Flexible Timeframe Detection:
Automatic Timeframe Detection: The indicator automatically detects new days, weeks, months, and quarters, ensuring accurate VWAP calculations.
Support for Intraday and Higher Timeframes: Works seamlessly on all chart timeframes, from 1-minute to monthly charts.
Previous Year Quarterly VWAPs:
Q1, Q2, Q3, Q4 VWAPs: Compare current price action to VWAP levels from specific quarters of the previous year.
User-Selectable Year: Choose the year for which you want to calculate previous quarterly VWAPs.
Persistent Monthly VWAPs:
Option to Persist Monthly VWAPs Year-Round: Keep monthly VWAP levels visible even after the month ends for ongoing analysis.
Comprehensive Analysis: Combines multiple VWAP timeframes and periods into a single tool, eliminating the need for multiple indicators.
Customizable and Flexible: Tailor the indicator to your specific trading strategy with customizable timeframes, periods, and settings.
Enhanced Decision-Making: Gain deeper insights into price action and volume trends across different timeframes, helping you make more informed trading decisions.
Clean and Organized Charts: Toggle visibility and labels to keep your chart clutter-free while still accessing all the information you need.
Ideal For:
Day Traders: Use daily and intraday VWAPs to identify intraday support and resistance levels.
Swing Traders: Analyze weekly and monthly VWAPs to spot medium-term trends and reversals.
Long-Term Investors: Leverage quarterly and yearly VWAPs to understand long-term price behavior and key levels.
Seasonal Traders: Track April, July, and October VWAPs to capitalize on seasonal trends.
The Multi-Timeframe VWAP Suite is a powerful and versatile tool for traders of all styles and timeframes. With its comprehensive suite of VWAP calculations, customizable settings, and user-friendly design, it provides everything you need to analyze price action and volume trends with precision and confidence. Whether you're looking to fine-tune your intraday strategy or gain a broader perspective on long-term trends, this indicator has you covered.

Swing Anchored Vwap [BigBeluga]🔵 OVERVIEW
Swing Anchored Vwap tracks the market’s directional behavior by anchoring VWAPs (Volume Weighted Average Price) to dynamically detected swing highs and lows. It visually distinguishes the active swing VWAP from historical ones—offering traders a clean view of trend-aligned value zones with clearly marked inflection points.
🔵 CONCEPTS
Swing Anchored VWAPs: VWAPs are initiated from recent swing highs during downtrends and swing lows during uptrends.
Trend Detection: The indicator identifies trend shifts based on the breaking of recent highest or lowest price value.
Trend-Based Coloring:
• Green VWAPs: are drawn from swing lows in uptrends.
• Blue VWAPs: are drawn from swing highs in downtrends.
Sensitivity Control: The Length input defines how far back the script looks to determine swing points—shorter lengths make it more reactive.
🔵 FEATURES
Real-time VWAP projection from the current swing point, updated live.
Historical VWAP traces with slightly faded color to emphasize the current active one.
Swing markers automatically placed on highs/lows where VWAPs are anchored.
Label with price value at the end of each active VWAP line for clarity.
Adaptive color scheme that visually separates uptrend/downtrend zones.
🔵 HOW TO USE
Use active VWAP as a dynamic support/resistance guide during ongoing trends.
Observe breaks or rejections around these VWAPs for trend continuation or reversal clues .
Compare current price position relative to swing VWAPs to assess trend maturity and extension .
Combine with volume analysis or structure to increase conviction at swing points.
🔵 CONCLUSION
Swing Anchored Vwap merges the logic of anchored VWAPs and swing structure into a responsive visual tool. It helps traders stay aligned with the current trend while offering historical context via previous value anchors—ideal for intraday to swing-level analysis.

Volume Spikes + Daily VWAP SD BandsVolume Spikes + Daily VWAP SD Bands
This indicator combines volume spike detection to help traders identify potential absorption zones with daily VWAP and standard deviation bands , key price levels, continuation opportunities, and possible institutional bias.
Features:
Volume Spike Detection
Highlights candles with unusually high volume relative to a configurable SMA.
Optional filters:
Local highs/lows only (Only Use Valid Highs & Lows)
Candle shapes: Hammer / Shooter only
Candle color match: bullish spikes on green, bearish on red
Plots small circles above/below bars for bullish and bearish volume spikes.
Alerts available for both bullish and bearish spikes.
Interpretation: Volume spikes at local highs/lows can indicate absorption, where one side absorbs aggressive buying/selling pressure.
Daily VWAP
Calculates volume-weighted average price (VWAP) for the current day.
Optionally shows previous day’s VWAP for reference.
Plot lines are customizable with optional circles on lines for visual clarity.
Labels on the last bar show exact VWAP values.
Institutional Bias Insight: Price above both current and previous VWAPs may indicate bullish positioning; price below both VWAPs may indicate bearish positioning. Many professional traders consider this a clue to institutional bias, but it’s not guaranteed. Always confirm with volume, delta, or orderflow analysis.
Standard Deviation Bands
Optional x1 and x2 SD bands around the daily VWAP.
Visual fill between bands shows price volatility zones.
Can be used to identify potential support/resistance or absorption zones.
Use Case: Price bounces off first SD band may indicate continuation signals, especially when volume spikes occur at those levels.
Customizable Visuals
Colors for bullish and bearish volume spikes
VWAP and SD band colors and thickness
Optional circles and filled bands for better readability
Alerts
Bullish / Bearish Volume Spikes
Supports TradingView alert system for automated notifications
Advanced Use Cases:
Combine with Cumulative Delta or Orderflow tools to confirm true absorption zones.
Identify high-volume rejection candles signaling possible trend continuation.
Use VWAP positioning relative to price to assess potential institutional bias, keeping in mind it is probabilistic, not guaranteed.
Visualize intraday VWAP levels and volatility with SD bands for better trade timing.
Settings: Fully customizable, including volume multiplier, SMA length, session filter, candle shape, color options, and VWAP/SD display preferences.

Session VWAPS [QuantVue]The Session VWAPS indicator is a designed for traders to enhance their trading analysis by incorporating Volume Weighted Average Price (VWAP) anchored to custom-defined trading sessions.
This indicator automatically plots VWAPs at three critical points of a user defined session:
🔹session start
🔹session high
🔹session low
Additionally, it provides the option to display the VWAPs from previous sessions, offering a look at potential areas of support and resistance.
Anchored VWAP, or Anchored Volume-Weighted Average Price, is a technical analysis tool used to determine the average price of a stock weighted by volume, starting from a specific point in time chosen by the analyst.
Unlike traditional VWAP, which starts at the beginning of the trading session, the anchored VWAP allows traders to select any point on the chart, such as a significant event, price low, high, or a breakout, to begin the calculation.
VWAP incorporates price and volume in a weighted average and can be used to identify areas of support and resistance on the chart.
Indicator Features:
Custom Session Definition:
Users can define their own trading sessions by specifying start and end times, allowing for tailored analysis according to individual trading strategies or market hours.
Anchored VWAP at Three Key Points:
🔹Session Start VWAP: This VWAP is anchored at the start of the defined session.
🔹Session High VWAP: Anchored at the highest price point within the session.
🔹Session Low VWAP: Anchored at the lowest price point within the session.
Previous Session VWAPs:
The indicator can display VWAPs from the previous session, allowing traders to spot potential areas of support and resistance.
Give this indicator a BOOST and COMMENT your thoughts below!
We hope you enjoy.
Cheers!

Central Pivot Ranges (CPR) & 3 x VWAP & BarcolorsThis Script Combines daily, weekly and monthly VWAP (Volume Weighted Average Price) with a intraday, daily, weekly and monthly CPR (Central Pivot Range) - which is considered by some traders as the bread and butter of the market for a reason. A combination of Multiple CPRs and VWAPs from different timeframes can provide you with interesting confluences that can give you more confidence in performing your trades.
CPR Features:
- The option to look at current or developing CPRs.
- A resolution selector for all 4 CPRs
- Options to hide and show Tops, Bottoms and Pivots separately
- Various Styling options
- Alerts
VWAP Features:
- 3 x preset VWAPs set to daily, weekly and monthly
- VWAP Lines from the daily O&C or H&L
- Previous VWAP for S/R
- Line Styling options
General Features:
- Barcolors by pivots crossed or daily, weekly and monthly VWAP.
- Barcolors by daily VWAP additionally contain an O and C check instead of just taking the price above or below the VWAP into consideration.

Machine Learning: VWAP [YinYangAlgorithms]Machine Learning: VWAP aims to use Machine Learning to Identify the best location to Anchor the VWAP at. Rather than using a traditional fixed length or simply adjusting based on a Date / Time; by applying Machine Learning we may hope to identify crucial areas which make sense to reset the VWAP and start anew. VWAP’s may act similar to a Bollinger Band in the sense that they help to identify both Overbought and Oversold Price locations based on previous movements and help to identify how far the price may move within the current Trend. However, unlike Bollinger Bands, VWAPs have the ability to parabolically get quite spaced out and also reset. For this reason, the price may never actually go from the Lower to the Upper and vice versa (when very spaced out; when the Upper and Lower zones are narrow, it may bounce between the two). The reason for this is due to how the anchor location is calculated and in this specific Indicator, how it changes anchors based on price movement calculated within Machine Learning.
This Indicator changes the anchor if the Low < Lowest Low of a length of X and likewise if the High > Highest High of a length of X. This logic is applied within a Machine Learning standpoint that likewise amplifies this Lookback Length by adding a Machine Learning Length to it and increasing the lookback length even further.
Due to how the anchor for this VWAP changes, you may notice that the Basis Line (Orange) may act as a Trend Identifier. When the Price is above the basis line, it may represent a bullish trend; and likewise it may represent a bearish trend when below it. You may also notice what may happen is when the trend occurs, it may push all the way to the Upper or Lower levels of this VWAP. It may then proceed to move horizontally until the VWAP expands more and it may gain more movement; or it may correct back to the Basis Line. If it corrects back to the basis line, what may happen is it either uses the Basis Line as a Support and continues in its current direction, or it will change the VWAP anchor and start anew.
Tutorial:
If we zoom in on the most recent VWAP we can see how it expands. Expansion may be caused by time but generally it may be caused by price movement and volume. Exponential Price movement causes the VWAP to expand, even if there are corrections to it. However, please note Volume adds a large weighted factor to the calculation; hence Volume Weighted Average Price (VWAP).
If you refer to the white circle in the example above; you’ll be able to see that the VWAP expanded even while the price was correcting to the Basis line. This happens due to exponential movement which holds high volume. If you look at the volume below the white circle, you’ll notice it was very large; however even though there was exponential price movement after the white circle, since the volume was low, the VWAP didn’t expand much more than it already had.
There may be times where both Volume and Price movement isn’t significant enough to cause much of an expansion. During this time it may be considered to be in a state of consolidation. While looking at this example, you may also notice the color switch from red to green to red. The color of the VWAP is related to the movement of the Basis line (Orange middle line). When the current basis is > the basis of the previous bar the color of the VWAP is green, and when the current basis is < the basis of the previous bar, the color of the VWAP is red. The color may help you gauge the current directional movement the price is facing within the VWAP.
You may have noticed there are signals within this Indicator. These signals are composed of Green and Red Triangles which represent potential Bullish and Bearish momentum changes. The Momentum changes happen when the Signal Type:
The High/Low or Close (You pick in settings)
Crosses one of the locations within the VWAP.
Bullish Momentum change signals occur when :
Signal Type crosses OVER the Basis
Signal Type crosses OVER the lower level
Bearish Momentum change signals occur when:
Signal Type crosses UNDER the Basis
Signal Type Crosses UNDER the upper level
These signals may represent locations where momentum may occur in the direction of these signals. For these reasons there are also alerts available to be set up for them.
If you refer to the two circles within the example above, you may see that when the close goes above the basis line, how it mat represents bullish momentum. Likewise if it corrects back to the basis and the basis acts as a support, it may continue its bullish momentum back to the upper levels again. However, if you refer to the red circle, you’ll see if the basis fails to act as a support, it may then start to correct all the way to the lower levels, or depending on how expanded the VWAP is, it may just reset its anchor due to such drastic movement.
You also have the ability to disable Machine Learning by setting ‘Machine Learning Type’ to ‘None’. If this is done, it will go off whether you have it set to:
Bullish
Bearish
Neutral
For the type of VWAP you want to see. In this example above we have it set to ‘Bullish’. Non Machine Learning VWAP are still calculated using the same logic of if low < lowest low over length of X and if high > highest high over length of X.
Non Machine Learning VWAP’s change much quicker but may also allow the price to correct from one side to the other without changing VWAP Anchor. They may be useful for breaking up a trend into smaller pieces after momentum may have changed.
Above is an example of how the Non Machine Learning VWAP looks like when in Bearish. As you can see based on if it is Bullish or Bearish is how it favors the trend to be and may likewise dictate when it changes the Anchor.
When set to neutral however, the Anchor may change quite quickly. This results in a still useful VWAP to help dictate possible zones that the price may move within, but they’re also much tighter zones that may not expand the same way.
We will conclude this Tutorial here, hopefully this gives you some insight as to why and how Machine Learning VWAPs may be useful; as well as how to use them.
Settings:
VWAP:
VWAP Type: Type of VWAP. You can favor specific direction changes or let it be Neutral where there is even weight to both. Please note, these do not apply to the Machine Learning VWAP.
Source: VWAP Source. By default VWAP usually uses HLC3; however OHLC4 may help by providing more data.
Lookback Length: The Length of this VWAP when it comes to seeing if the current High > Highest of this length; or if the current Low is < Lowest of this length.
Standard VWAP Multiplier: This multiplier is applied only to the Standard VWMA. This is when 'Machine Learning Type' is set to 'None'.
Machine Learning:
Use Rational Quadratics: Rationalizing our source may be beneficial for usage within ML calculations.
Signal Type: Bullish and Bearish Signals are when the price crosses over/under the basis, as well as the Upper and Lower levels. These may act as indicators to where price movement may occur.
Machine Learning Type: Are we using a Simple ML Average, KNN Mean Average, KNN Exponential Average or None?
KNN Distance Type: We need to check if distance is within the KNN Min/Max distance, which distance checks are we using.
Machine Learning Length: How far back is our Machine Learning going to keep data for.
k-Nearest Neighbour (KNN) Length: How many k-Nearest Neighbours will we account for?
Fast ML Data Length: What is our Fast ML Length? This is used with our Slow Length to create our KNN Distance.
Slow ML Data Length: What is our Slow ML Length? This is used with our Fast Length to create our KNN Distance.
If you have any questions, comments, ideas or concerns please don't hesitate to contact us.
HAPPY TRADING!

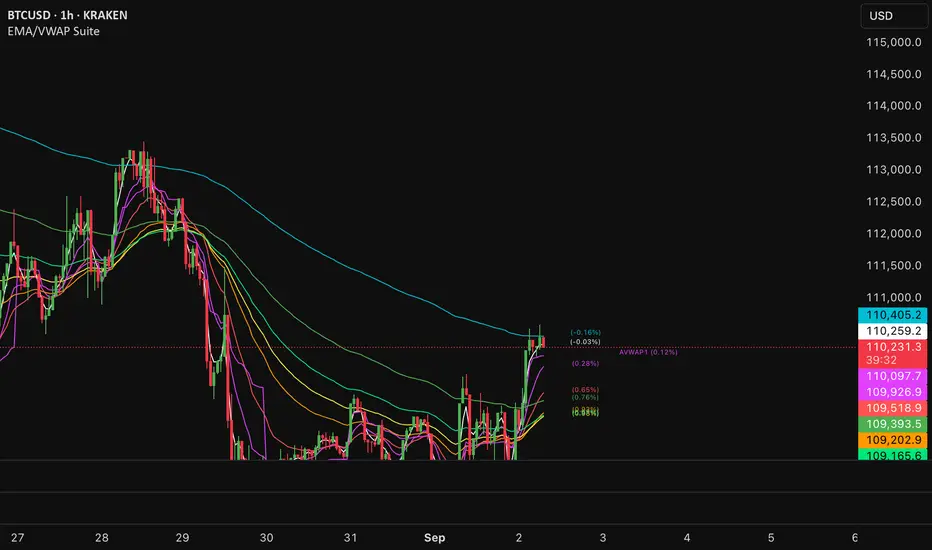
EMA/VWAP SuiteEMA/VWAP Suite
Overview
The EMA/VWAP Suite is a versatile and customizable Pine Script indicator designed for traders who want to combine Exponential Moving Averages (EMAs) and Volume Weighted Average Prices (VWAPs) in a single, powerful tool. It overlays up to eight EMAs and six VWAPs (three anchored, three rolling) on the chart, each with percentage difference labels to show how far the current price is from these key levels. This indicator is perfect for technical analysis, supporting strategies like trend following, mean reversion, and VWAP-based trading.
By default, the indicator displays eight EMAs and a session-anchored VWAP (AVWAP 1, in fuchsia) with their respective percentage difference labels, keeping the chart clean yet informative. Other VWAPs and their bands are disabled by default but can be enabled and customized as needed. The suite is designed to minimize clutter while providing maximum flexibility for traders.
Features
- Eight Customizable EMAs: Plot up to eight EMAs with user-defined lengths (default: 3, 9, 19, 38, 50, 65, 100, 200), each with a unique color for easy identification.
- EMA Percentage Difference Labels: Show the percentage difference between the current price and each EMA, displayed only for visible EMAs when enabled.
- Three Anchored VWAPs: Plot VWAPs anchored to the start of a session, week, or month, with customizable source, offset, and band multipliers. AVWAP 1 (session-anchored, fuchsia) is enabled by default.
- Three Rolling VWAPs: Plot VWAPs calculated over fixed periods (default: 20, 50, 100), with customizable source, offset, and band multipliers.
- VWAP Bands: Optional upper and lower bands for each VWAP, based on standard deviation with user-defined multipliers.
- VWAP Percentage Difference Labels: Display the percentage difference between the current price and each VWAP, shown only for visible VWAPs. Enabled by default to show the AVWAP 1 label.
- Customizable Colors: Each VWAP has a user-defined color via input settings, with labels matching the VWAP line colors (e.g., AVWAP 1 defaults to fuchsia).
Flexible Display Options: Toggle individual EMAs, VWAPs, bands, and labels on or off to reduce chart clutter.
Settings
The indicator is organized into intuitive setting groups:
EMA Settings
Show EMA 1–8 : Toggle each EMA on or off (default: all enabled).
EMA 1–8 Length : Set the period for each EMA (default: 3, 9, 19, 38, 50, 65, 100, 200).
Show EMA % Difference Labels : Enable/disable percentage difference labels for all EMAs (default: enabled).
EMA Label Font Size (8–20) : Adjust the font size for EMA labels (default: 10, mapped to “tiny”).
Anchored VWAP 1–3 Settings
Show AVWAP 1–3 : Toggle each anchored VWAP on or off (default: AVWAP 1 enabled, others disabled).
AVWAP 1–3 Color : Set the color for each VWAP line and its label (default: fuchsia for AVWAP 1, purple for AVWAP 2, teal for AVWAP 3).
AVWAP 1–3 Anchor : Choose the anchor period (“Session,” “Week,” “Month”; default: Session for AVWAP 1, Week for AVWAP 2, Month for AVWAP 3).
AVWAP 1–3 Source : Select the price source (default: hlc3).
AVWAP 1–3 Offset : Set the horizontal offset for the VWAP line (default: 0).
Show AVWAP 1–3 Bands : Toggle upper/lower bands (default: disabled).
AVWAP 1–3 Band Multiplier : Adjust the standard deviation multiplier for bands (default: 1.0).
Rolling VWAP 1–3 Settings
Show RVWAP 1–3 : Toggle each rolling VWAP on or off (default: disabled).
RVWAP 1–3 Color : Set the color for each VWAP line and its label (default: navy for RVWAP 1, maroon for RVWAP 2, fuchsia for RVWAP 3).
RVWAP 1–3 Period Length : Set the period for the rolling VWAP (default: 20, 50, 100).
RVWAP 1–3 Source : Select the price source (default: hlc3).
RVWAP 1–3 Offset : Set the horizontal offset (default: 0).
Show RVWAP 1–3 Bands : Toggle upper/lower bands (default: disabled).
RVWAP 1–3 Band Multiplier : Adjust the standard deviation multiplier for bands (default: 1.0).
VWAP Label Settings
Show VWAP % Difference Labels : Enable/disable percentage difference labels for all VWAPs (default: enabled, showing AVWAP 1 label).
VWAP Label Font Size (8–20) : Adjust the font size for VWAP labels (default: 10, mapped to “tiny”).
How It Works
EMAs : Calculated using ta.ema(close, length) for each user-defined period. Percentage differences are computed as ((close - ema) / close) * 100 and displayed as labels for visible EMAs when show_ema_labels is enabled.
Anchored VWAPs : Calculated using ta.vwap(source, anchor, 1), where the anchor is determined by the selected timeframe (Session, Week, or Month). Bands are computed using the standard deviation from ta.vwap.
Rolling VWAPs : Calculated using ta.vwap(source, length), with bands based on ta.stdev(source, length).
Labels : Updated on each new bar (ta.barssince(ta.change(time) != 0) == 0) to show percentage differences. Labels are only displayed for visible EMAs/VWAPs to avoid clutter.
Color Matching: VWAP labels use the same color as their corresponding VWAP lines, set via input settings (e.g., avwap1_color for AVWAP 1).
Example Use Cases
- Trend Following: Use longer EMAs (e.g., 100, 200) to identify trends and shorter EMAs (e.g., 3, 9) for entry/exit signals.
- Mean Reversion: Monitor percentage difference labels to spot overbought/oversold conditions relative to EMAs or VWAPs.
- VWAP Trading: Use the default session-anchored AVWAP 1 for intraday trading, adding weekly/monthly VWAPs or rolling VWAPs for broader context.
- Intraday Analysis: Leverage the session-anchored AVWAP 1 (enabled by default) for day trading, with bands as support/resistance zones.
Advanced VWAP CalendarThe Advanced VWAP Calendar is a designed to plot Volume Weighted Average Price (VWAP) lines anchored to user-defined and preset time periods, including weekly, monthly, quarterly, and custom anchors. As of August 15, 2025, this indicator provides traders with a robust tool for analyzing price trends relative to volume-weighted averages, with clear labeling and extensive customization options. Below is a summary of its key features and functionality, with technical details and code references updated to focus on user-facing behavior and presentation, while preserving all other aspects of the original summary.
Key Features
Multiple Time Period VWAPs:
Weekly VWAPs: Supports up to five VWAPs for a user-selected month and year, starting at midnight each Monday (e.g., W1 Aug 2025, W2 Aug 2025). Enabled via a single toggle, with anchors automatically set to the first Monday of the chosen month.
Monthly VWAPs: Plots VWAPs for all 12 months of a selected year (e.g., Jan 2025, Feb 2025) or a single user-specified month/year. Labels use month abbreviations (e.g., "Aug 2025").
Quarterly VWAPs: Covers four quarters of a selected year (e.g., Q1 2025, Q2 2025), with options to enable all quarters or individual ones (Q1–Q4).
Legacy VWAPs: Provides monthly and quarterly VWAPs for a user-selected legacy year (e.g., 2024), labeled with a "Legacy" prefix (e.g., "Legacy Jan 2024," "Legacy Q1 2024"), with similar enablement options.
Custom VWAPs: Includes 10 fully customizable VWAPs, each with user-defined anchor times, labels (e.g., "Q1 2025"), colors, line widths (1–5), text colors, bubble styles, text sizes (8–40), and background options.
Clear and Dynamic Labeling:
Labels appear to the right of the chart, showing the VWAP value (e.g., "Q1 2025 123.45").
Weekly labels follow a "W# Month Year" format (e.g., "W1 Aug 2025").
Monthly labels use abbreviated months (e.g., "Aug 2025"), while quarterly labels use "Q# Year" (e.g., "Q3 2025").
Legacy labels include a "Legacy" prefix (e.g., "Legacy Q1 2024").
Labels support customizable text sizes (tiny to huge) and can be displayed with or without a background, with optional bubble styles.
Flexible Customization:
Each VWAP can be enabled or disabled independently, with user inputs for anchor times, labels, and visual properties.
Colors are predefined for weekly (red, orange, blue, green, purple), monthly (varied), quarterly (red, blue, green, yellow), and legacy VWAPs, but custom VWAPs allow any color selection.
Line widths and text sizes are adjustable, ensuring visual clarity and chart readability.
This indicator was a dual effort, code was heavily contributed in effort by AzDxB, major credit and THANKS goes to him www.tradingview.com
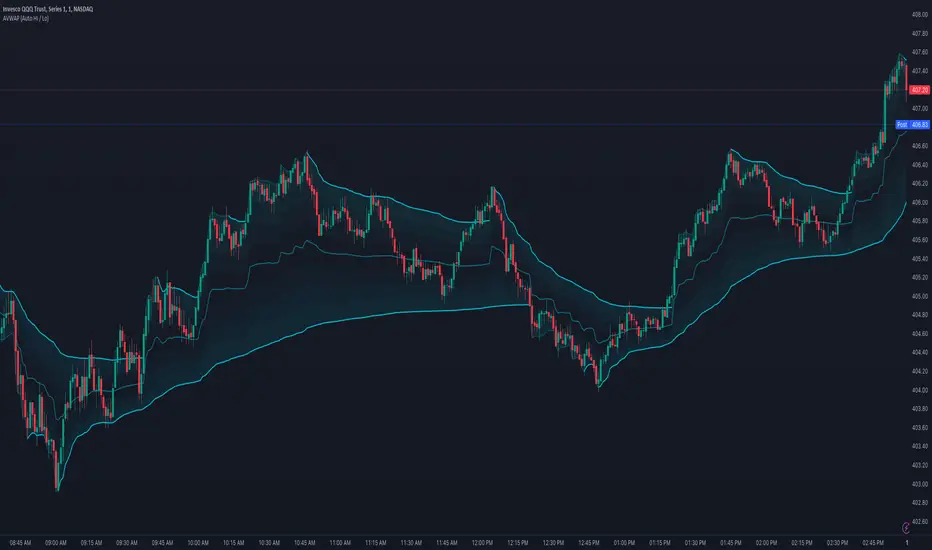
Anchored VWAP (Auto High & Low)OVERVIEW
This script plots, and auto-updates, 3 separate VWAPs: a traditional VWAP, a VWAP anchored to a trends high, and another anchored to a trends low.
VWAP and Anchored VWAPs are commonly used by institutions responsible for the majority of market volume on a given day. Citadel Trading, for example, accounts for approximately 35% of all U.S. listed retail volume , largely executed through program trades over the course of a day, week, or month.
Because VWAP is a prominent market maker tool for executing large trades, day traders can use it to better anticipate trends, mean reversion, and breakouts.
This is most useful on charts with intraday time frames (1 minute, 5 minute etc.) commonly used for day trading. This is not ideal for larger time frames (1 hour or greater) commonly used for swing trading or identifying larger trends.
INPUTS
You can configure:
The size, color, and visibility of 6 different plots (VWAP, High Anchor, Low Anchor, Average of Anchors, Quarter Values, Interim Bands)
How smooth the average displays
INSPIRATION
1. "How To Measure Anything" by Douglas W. Hubbard
2. "Maximum Trading Gains With Anchored VWAP" by Brian Shannon
Better understanding probability and how to analyze risk (first book), as well as the tools market makers use (second book), has completely reframed how I approach day trading.
Previous VWAP Levels by Riotwolftrading The "Previous VWAP" indicator calculates and displays the previous session's Volume Weighted Average Price (VWAP) for five timeframes (Daily, Weekly, Monthly, Quarterly, Yearly).
Each VWAP is plotted as a horizontal line extending to the right edge of the chart, with customizable labels at the right to identify each level. The indicator is designed for traders who want to visualize key price levels from prior periods without cluttering the chart with current VWAPs or additional metrics like standard deviations.
**Functionality**:
- **Calculates Previous VWAPs**: Computes the VWAP for the previous session of each timeframe (Daily, Weekly, Monthly, Quarterly, Yearly) based on the input source (default: `hlc3`) and volume.
- **Visual Style** : Uses `line.new` to draw horizontal lines from five bars back to the current bar, ensuring the lines extend to the right edge of the chart. Labels are placed at the right edge using `label.new` for clear identification.
- **Customization** : Allows users to toggle visibility, adjust line styles, widths, colors, and label sizes, and choose between abbreviated or full label text.
- **Minimalist Design**: Focuses solely on previous VWAPs, omitting current VWAPs, rolling VWAPs, and standard deviation bands to keep the chart clean.
**Intended Use**: This indicator is useful for traders who rely on historical VWAP levels as support/resistance or reference points for trading decisions, particularly in strategies involving mean reversion or breakout trading.
---
### Rules and Features
*VWAP Calculation**:
- The VWAP is calculated as the cumulative sum of price (`src`) multiplied by volume (`sumSrcVol`) divided by the cumulative volume (`sumVol`) for each timeframe.
- The "previous VWAP" is the VWAP value from the prior session, captured when a new session begins (e.g., new day, week, month, etc.).
- The indicator uses the `hlc3` (average of high, low, close) as the default source, but users can modify this in the settings.
**Timeframes**:
- **Daily**: Previous day's VWAP.
- **Weekly**: Previous week's VWAP.
- **Monthly**: Previous month's VWAP.
- **Quarterly**: Previous quarter's VWAP (3 months).
- **Yearly**: Previous year's VWAP (12 months).
- New sessions are detected using `ta.change(time(period))` for each timeframe.
**Line Drawing**:
- Lines are drawn using `line.new` from `time ` (five bars back) to the current bar (`time`), ensuring they extend to the right edge of the chart.
- Lines are updated only on the last confirmed bar (`barstate.islast`) to optimize performance and avoid repainting.
- Previous lines are deleted (`line.delete`) to prevent overlapping or clutter.
**Labels**:
- Labels are drawn at the right edge (`x=time`, `xloc=xloc.bar_time`) with `label.new`.
- Users can choose between abbreviated labels (e.g., "pvD" for Previous Daily VWAP) or full labels (e.g., "Prev Daily VWAP").
- Label sizes are customizable (`tiny`, `small`, `normal`, `large`, `huge`).
- Labels are deleted (`label.delete`) on each update to maintain a clean chart.
5. **Customization Options**:
- **Visibility**: Toggle each VWAP (Daily, Weekly, Monthly, Quarterly, Yearly) on or off.
- **Colors**: Individual color settings for each VWAP line and label (default colors: Daily=#E12D7B, Weekly=#F67B52, Monthly=#EDCD3B, Quarterly=#3BBC54, Yearly=#2665BD).
- **Line Style**: Choose from `solid`, `dotted`, or `dashed` lines.
- **Line Width**: Adjustable from 1 to 4 pixels.
- **Label Settings**: Enable/disable labels, abbreviate text, and select label size.
- **Source**: Customize the price source (default: `hlc3`).
**Performance Optimization**:
- The indicator only updates lines and labels on the last confirmed bar to minimize computational overhead.
- Uses `var` to initialize variables and avoid unnecessary recalculations.
- Deletes previous lines and labels to prevent chart clutter.
---
### Usage Instructions
1. **Add to Chart**:
- In TradingView, go to the Pine Editor, paste the script, and click "Add to Chart."
- The indicator will overlay on the price chart, showing previous VWAP lines and labels.
2. **Configure Settings**:
- Open the indicator settings to customize:
- Toggle visibility of each VWAP timeframe.
- Adjust colors, line style, and width.
- Enable/disable labels, choose abbreviation, and set label size.
- Modify the source if needed (e.g., use `close` instead of `hlc3`).
3. **Interpretation**:
- **Previous VWAPs**: Act as dynamic support/resistance levels based on the prior session's volume-weighted price.
- **Timeframes**: Use shorter timeframes (Daily, Weekly) for intraday/swing trading, and longer timeframes (Monthly, Quarterly, Yearly) for positional trading.
- **Labels**: Identify each VWAP level at the right edge of the chart for quick reference.
4. **Best Practices**:
- Use on charts with sufficient volume data, as VWAP relies on volume (a warning is triggered if no volume data is available).
- Combine with other indicators (e.g., moving averages, RSI) for confirmation in trading strategies.
- Adjust line styles and colors to avoid visual overlap with other chart elements.
---
### Example Use Case
A trader using a 1-hour chart can add the "Previous VWAP" indicator to identify key levels from the prior day, week, or month. For example:
- The Previous Daily VWAP might act as a support level for a bullish trend.
- The Previous Weekly VWAP could serve as a target for a swing trade.
- Labels at the right edge make it easy to identify these levels without cluttering the chart.
This indicator provides a clean, customizable way to visualize previous VWAPs, making it ideal for traders who want historical price context with minimal chart noise. For the complete Pine Script code, refer to the artifact provided in the previous response.

Sniper Mini VWAPThis script plots dynamic, session-based VWAPs for key intraday timeframes:
1H (green), 4H (orange), 8H (purple), and Daily (red).
Each VWAP resets at the start of its own session, giving traders a real-time view of price relative to average volume-weighted value. These lines often act as intraday support, resistance, or liquidity magnets — great for scalping, fade setups, and sniper-style entries.
You can toggle each VWAP on or off for a cleaner chart.
This version does not use anchored VWAPs — it’s designed for traders who need fast feedback as price develops within active sessions.

[MAD] Custom Session VWAP BandsOverview
This indicator helps visualize the Volume Weighted Average Price (VWAP) and its associated standard deviation bands over specified time periods, providing traders with a clear understanding of price trends, volatility, and potential support/resistance levels.
Inputs
Deviation
StDev mult 1: Multiplier for the first standard deviation band (Default: 1.0)
StDev mult 2: Multiplier for the second standard deviation band (Default: 2.0)
StDev mult 3: Multiplier for the third standard deviation band (Default: 3.0)
StDev mult 4: Multiplier for the fourth standard deviation band (Default: 4.0)
Line width: Width of the lines for the bands (Default: 2)
Custom Vwap session reset settings
Many different options are considered when a session is going to be reset.
Plot and Fill Options
Enable Fills: Enable/disable filling between bands.
Plot +4: Enable/disable plotting the +4 standard deviation band.
Plot +3: Enable/disable plotting the +3 standard deviation band.
Plot +2: Enable/disable plotting the +2 standard deviation band.
Plot +1: Enable/disable plotting the +1 standard deviation band.
Plot VWAP: Enable/disable plotting the VWAP line.
Plot -1: Enable/disable plotting the -1 standard deviation band.
Plot -2: Enable/disable plotting the -2 standard deviation band.
Plot -3: Enable/disable plotting the -3 standard deviation band.
Plot -4: Enable/disable plotting the -4 standard deviation band.
How to Use the Indicator
Adding the Indicator
Add the indicator to your chart through your trading platform's indicator menu.
Configuring the VWAP Reset
Specify reset intervals based on time, days of the week, or specific dates.
Adjust the time zone if necessary.
Customizing Standard Deviation Bands
Set the multipliers for the standard deviation bands.
Choose line width for better visualization.
Enabling Plots and Fills
Select which bands to display.
Enable or disable fills between the bands.
Practical Application of VWAP Bands
Understanding VWAP
VWAP is a trading benchmark that calculates the average price a security has traded at throughout the day based on volume and price. It is primarily used for intraday trading but can also offer insights during end-of-day reviews.
Using VWAP for Trading
Intraday Trading
Entry and Exit Points: VWAP can help identify optimal buy and sell points. Buy when the price is above VWAP and sell when it's below.
Support and Resistance: VWAP often acts as a dynamic support/resistance level. Prices tend to revert to VWAP, making it a crucial level for intraday traders.
Trend Confirmation
Uptrends and Downtrends: In an uptrend, the price will generally stay above VWAP. Conversely, in a downtrend, it will stay below. Use this to confirm market direction.
Combining with Other Indicators
Moving Averages and Bollinger Bands: Combining VWAP with these indicators can provide a more robust trading signal, confirming trends and potential reversals.
Setting Stop-Loss and Profit Targets
Conservative Stop Orders: Place stop orders at recent lows for pullback trades.
Profit Targets: Use daily highs or Fibonacci extension levels to set profit targets.
Strategies for Using VWAP
Pullback Strategy
Buy during pullbacks to VWAP in an uptrend, and sell during rallies to VWAP in a downtrend.
Breakout Strategy
Look for breakouts above/below VWAP after the market open to capitalize on new trends.
Momentum Trading
Use VWAP to confirm the strength of a trend. Buy when the price is consistently above VWAP and sell when it's consistently below.
Institutional Strategies
Institutional traders use VWAP to execute large orders without causing significant market impact, ensuring trades are made around the average price.
By incorporating these strategies, traders can better understand market dynamics, make informed trading decisions, and manage their risk effectively.
Some setup possibilities
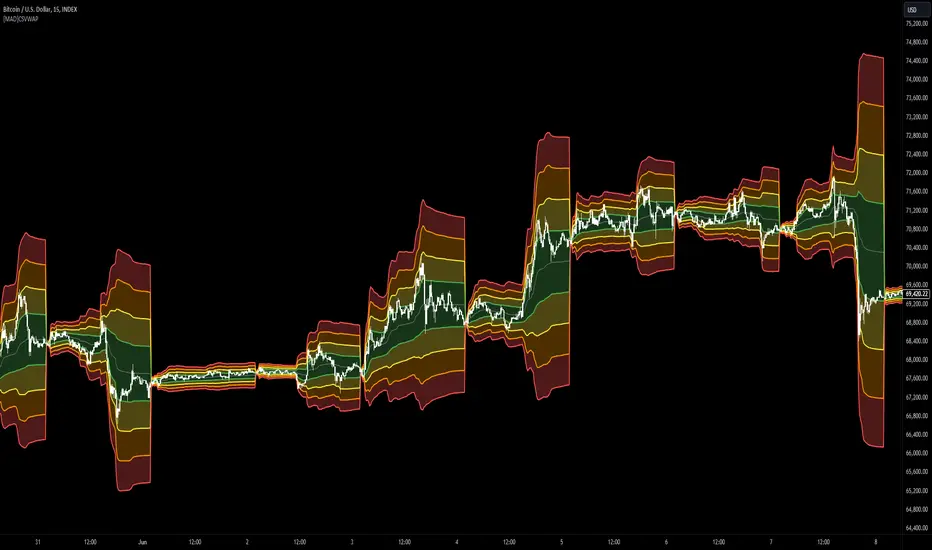
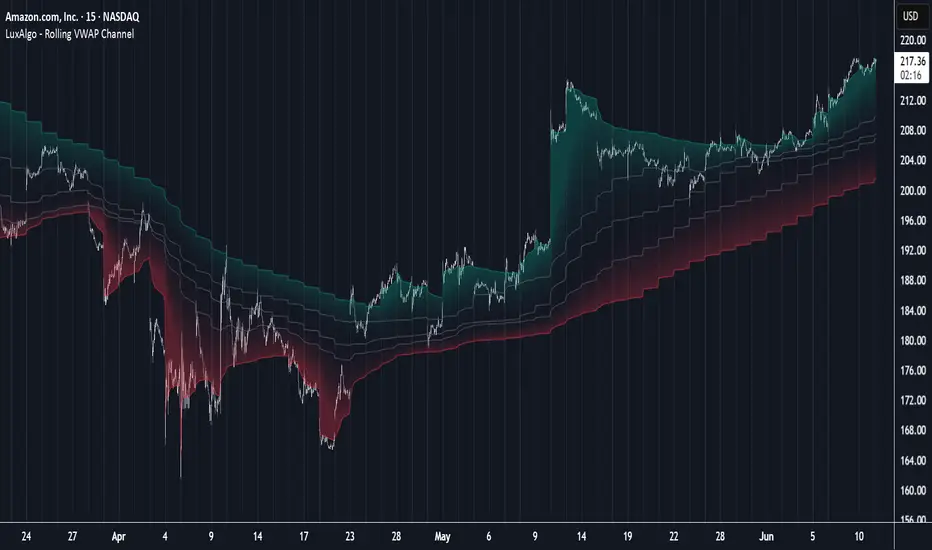
Rolling VWAP Channel [LuxAlgo]The Rolling VWAP Channel indicator creates a channel by analyzing a large number of Volume Weighted Average Prices (VWAPs) and determining a Channel based on percentile linear interpolation throughout the VWAPs.
🔶 USAGE
In this indicator, we have formed a Channel by first calculating multiple VWAPs, each with their respective anchor, then locating prices using "Percentile Linear Interpolation".
Note: Percentile Linear Interpolation locates the price point at which a specified percentage of VWAPs fall below it.
For example, a percentile of 50% would mean that 50% of the VWAP values fall below this price.
This method of analysis is important since the VWAPs are not often evenly distributed; therefore, we are able to draw importance to different levels by analyzing in percentiles.
When visualized, there is typically clustering of the VWAP values, which occurs at any given time, as seen below.
The channel can be tailored to each individual, with full control of each percentile represented in the channel. That being said, a general concept is that these clustered areas are clear results of sideways price action, which would lead us to believe that after interactions at these levels, we should expect to see a directional decision made by the market closely after.
🔶 DETAILS
The Rolling VWAP calculation calculates a user-specified number of VWAPs (up to 500), each anchored to a unique starting point in the chart based on the start of a new timeframe.
Each new timeframe that occurs causes a new VWAP to initialize. When the total number of desired VWAPs is reached, the oldest VWAP is removed and re-initialized, anchored to the current bar. Hence, the name " Rolling " VWAPs
This method allows us to automatically generate and manage large amounts of VWAPs without the need for user interaction.
After we have generated these VWAPs, we are able to run analyses on their returned values, such as the "Percentile Linear Interpolation" mentioned in the section above.
🔶 SETTINGS
Anchor Period: Choose which time period to use as the anchor point to initialize new VWAPs from.
VWAP Source: Choose the source for your VWAPs to calculate.
VWAP Amount: Sets the number of VWAPs to use. After this amount is on the chart, the oldest will be rolled.
🔹 Channel Lines
Toggle: Enable the associated VWAP Channel percentile line.
Percentile: Adjust each line's percentile independently for your needs.
Width: Adjust the width of the associated percentile line.
🔹 Calculation
Calculated Bars: Tells the indicator how many bars to calculate on, for faster calculations with less history, use a lower value. Setting this to 0 will remove the bar constraint.
Adjustable Quad VWAPOverview
A powerful multi-timeframe VWAP indicator that displays four customizable rolling VWAPs with advanced features for comprehensive trend analysis and signal generation.
Key Features
🔧 Four Adjustable VWAPs
Fast VWAP: Default 7 days (1-365 adjustable)
Slow VWAP: Default 30 days (1-365 adjustable)
Medium VWAP: Default 90 days (1-365 adjustable)
Long VWAP: Default 365 days (1-365 adjustable)
[GarufiCommunity] Multi Indicator: VWAPs, MA, Pivot PointsThis script provides a collection of indicators to help traders look at multiple trends while maintaining a consistent configuration, even when jumping around different timeframes and symbols.
Additionally, this collection is particularly useful when trading decisions involve looking at dozens of indicators and analyzing, in aggregate, their confluence.
With this collection of indicators you can configure anchored VWAPs, MA, and Pivot Points:
- Anchored VWAPs: For each you define a fixed time and date to anchor it in the graph, and it stays consistent even when you change the symbol. An example use case can be setting one of the VWAPs to always start on the first candle on January 1st 2021, and a second VWAP a decade prior, so you don’t need to keep manually adjusting/adding VWAPs to the graph. At the moment you can define up to 4 anchored VWAPs.
- MA and Pivot Points: For each you can set independent timeframes, periods, and types, while using a single configuration panel. This helps reduce the amount of clicking needed when trying different configurations, such as testing different MA and Pivot periods and comparing how each behave in the graph (this personally helps me build trust in indicators). Permits use of up to 3 MAs and 2 Pivot Points.
Lastly, this script leverages and reuses modified code from the sources below:
- Médias e Tempos-v.2.1 by VeraLucia (with permission);
- Multiple Anchored VWAP v1.0 by GuilhermeNogueira (with permission);
- Pivot Point by TradingView.

Weekly VwapsThe Weekly Vwaps indicator lets you plot weekly Volume-Weighted Average Price (VWAP) lines for up to six months of your choosing, with years ranging from 2020 to 2050. It’s a focused tool pulled straight from the weekly VWAP section of the Advanced VWAP Calendar indicator, keeping all the same controls and look but expanded to handle more months. You can use it alongside the original indicator if you need extra weekly VWAPs (up to 30 lines total) or run it on its own for a clean, dedicated setup.
How It Works: Six Month Groups: Pick any six months (e.g., Jan 2020, Sep 2025, or Jul 2040) and enable up to five weekly VWAPs per month (W1–W5), starting from Monday midnight.
Default Setup: Loads with September 2025 VWAPs turned on, with other months (August–April 2025) off but ready to enable. All default to 2025.
Customization: Toggle all weeks in a month or pick specific ones. Adjust label sizes (tiny to huge) and line widths (1–5). Colors are teal, fuchsia, red, green, and yellow/orange for weeks 1–5, with clear labels like “W1 Sep 2025 123.45”.
Label Control: A “Show All Labels” switch lets you hide labels to keep your chart tidy.
Intraday Only: Works on intraday timeframes (e.g., 5-minute, 1-hour) for accurate VWAPs.
Why Use It: Add to Advanced VWAP Calendar: If the original’s two-month limit isn’t enough, this adds six more months of weekly VWAPs for deeper analysis.
Standalone Option: Perfect if you only want weekly VWAPs without other features, with flexibility to pick any months and years.
User-Friendly: Ready to go with September 2025 enabled, easy to tweak for past or future data.
Get Started: Add it to your TradingView chart, and September 2025 VWAPs will show up instantly. Adjust months, years, or toggles in the settings to focus on what you need. Test it on intraday charts and use the label toggle to manage clutter. Great for traders wanting precise, customizable weekly VWAPs!
Frozen 4H VWAP – Precision AnchoredFrozen 4H VWAP – Precision Anchored Like Ice
The Frozen 4H VWAP – Precision Anchored delivers a clean, stable, and reliable view of the 4-hour Volume Weighted Average Price, designed for traders who want higher timeframe insights without intrabar noise or repainting.
🔹 Key Features:
Non-Repainting: VWAP value is “frozen” at the close of each 4H candle — no mid-bar updates or flickering.
4H Timeframe Anchoring: Seamlessly pulls 4-hour VWAP values into any timeframe you’re trading on.
Clear Trend Reference: Updates only when a new 4H candle begins, acting as a trustworthy anchor for support/resistance.
Custom Source Option: Choose from different price sources (default: HLC3) to fit your strategy.
Whether you're scalping, day trading, or swing trading, this indicator gives you a powerful edge by grounding your decisions in higher timeframe VWAP data — clear, calm, and frozen in time.

Institutional Session VWAP Bands (Zeiierman)█ Overview
Institutional Session VWAP Bands (Zeiierman) plots a clean, session-aware VWAP that restarts at the “True Close” (end of the first trading hour) for each session you enable (Sydney, Tokyo, London, New York). From that anchor, the script computes a classic volume-weighted average price plus optional standard-deviation bands to frame session fair value and dispersion.
By aligning VWAP to when institutional flows settle (the first hour), you get a reference that matches real execution behavior, yielding more credible pullbacks, retests, and mean-reversion reads inside each session.
█ How It Works
⚪ Session Detection
You choose the sessions (on/off), their UTC-aligned time windows, and colors. The script detects when each session is active on your chart timeframe.
⚪ True-Close Anchoring
At session open the indicator waits. When the first hour completes, it flips the anchor on and starts a fresh VWAP for that session, mirroring how many desks treat the first hour as the real close for the prior day’s positioning.
⚪ VWAP Core
From the true-close anchor, VWAP is calculated in the standard way: cumulative (price × volume) / cumulative volume using your chosen price source (default hlc3).
⚪ VWAP Bands (σ)
Upper/Lower bands are built using a running standard deviation of the price source since the anchor. You control the σ multiplier and line width, and you can optionally fill between the bands.
█ Why Sessions + True-Close Anchoring
⚪ Institutional Timing Matters
A new anchor at the first-hour close reflects where real flows have settled, giving you a session fair-value line that aligns with how many funds evaluate prices intraday.
⚪ Cleaner Session Reads
Because VWAP and σ-bands restart each session, your retests, squeezes, and mean-reversion signals are based on today’s order-flow context, not yesterday’s inertia.
Result: a session-true fair-value with dispersion bands that stay close to the action, improving the quality of pullback entries and risk framing.
█ How to Use
⚪ Session Fair-Value Guide
Treat VWAP as the magnet for intraday value. Impulsive moves away from VWAP that fold back often present retest opportunities.
⚪ σ-Band Reversion & Breaks
Reversion: Tests beyond the upper/lower band that snap back inside can flag exhaustion.
Trend: Price riding the VWAP band in a strong trend
⚪ Session Handoffs
When one session hands to the next, watch how price behaves around the new session’s VWAP Bands after its anchor triggers. Continuation through the new VWAP vs. rejection often sets the tone.
█ Settings
UTC: Choose the timezone used to evaluate session windows (e.g., UTC+2).
Sessions (Sydney, Tokyo, London, New York): Toggle visibility and define each HHMM-HHMM window.
VWAP Price: Source for weighting.
Band Multiplier (σ): Standard deviation multiplier.
█ Related publications
True Close – Institutional Trading Sessions (Zeiierman)
-----------------
Disclaimer
The content provided in my scripts, indicators, ideas, algorithms, and systems is for educational and informational purposes only. It does not constitute financial advice, investment recommendations, or a solicitation to buy or sell any financial instruments. I will not accept liability for any loss or damage, including without limitation any loss of profit, which may arise directly or indirectly from the use of or reliance on such information.
All investments involve risk, and the past performance of a security, industry, sector, market, financial product, trading strategy, backtest, or individual's trading does not guarantee future results or returns. Investors are fully responsible for any investment decisions they make. Such decisions should be based solely on an evaluation of their financial circumstances, investment objectives, risk tolerance, and liquidity needs.

Anchored VWAP Pinch & Handoff, Intervals, and Signals"Anchored VWAP Pinch & Handoff, Intervals, and Signals" is an AVWAP toolbox for those who like to use various VWAP trading techniques. The indicator is currently comprised of the following three sections:
• The Pinch & Handoff section (shown above on chart) allows manually setting an upper and lower AVWAP (Pinch) along with an additional AVWAP (Handoff) by entering dates or by dragging the vertical anchor lines to the desired significant events on chart. Each of these three AVWAPs can also be set to show zones above and/or below by a percentage or standard deviation amount. The theory behind this method is that the upper and lower AVWAPs may act as dynamic support and resistance levels, effectively creating a price range or channel. As price moves between these two VWAP levels, it becomes squeezed or consolidated within that range. Further conjecture is that the longer the price remains within the range of the two anchored VWAP values, the higher the potential for an explosive breakout. Traders using this strategy may interpret the prolonged consolidation as a period of price compression, with the expectation that a significant move in either direction is likely to occur. Traders employing the AVWAP Pinch strategy might look for specific chart patterns or additional confirmation signals to enter a trade. For example, a breakout above the upper anchored VWAP level could trigger a long trade, while a breakdown below the lower anchored VWAP level could signal a short trade. Stop-loss orders and profit targets are typically set based on the trader's risk tolerance and the volatility of the asset. The third AVWAP (Handoff) is typically set after price has broken through the Pinch, and is used as a new level of support or resistance. The "Pinch & Handoff" phrase is believed to have been coined by Brian Shannon, who has popularized this method.
• The Intervals section (shown above on chart) is comprised of six periodic AVWAPs which cyclically reset. Their default settings are 1 Day, 2 Days, 1 Week, 1 Month, 1 Quarter, and 1 Year. They each may be set to desired period and when they are enabled the VWAPs whose periods are lower than the current chart timeframe are automatically hidden. For example a 1 Day AVWAP is not useful on a 1 Week chart so it would be hidden from that timeframe. When using AVWAPs from higher timeframes it may be helpful to set your chart to "Scale price chart only". This can be enabled by right clicking on your chart's price column and then left clicking "Scale price chart only" to enable that option.
• The Auto section (shown above on chart) is comprised of two automatic Anchored VWAPs. There are choices for setting anchors automatically based upon Highest Source, Highest Volume, Lowest Source, Lowest Volume, Pivot High, and Pivot Low. Because these two VWAPs work retroactively they are drawn with lines instead of plots. There is currently a limitation of 500 lines that may be drawn at any given time and the logic within this indicator uses a line for every bar of VWAP that is drawn, so if the combined length of both of these VWAPs exceeds 500 bars the earliest lines would disappear. For typical use of looking for the highest high in the last 50 bars or the last fractal this limitation should not be an issue.
---
All of the plots have been titled including hidden plots that are generated for the AVWAP line drawings. All of the various types of AVWAP within the indicator should be available as choices within the Alert creation dialog if use of alerts is desired.
---
NOTICE: This is an example script and not meant to be used as an actual strategy. By using this script or any portion thereof, you acknowledge that you have read and understood that this is for research purposes only and I am not responsible for any financial losses you may incur by using this script!

srd786-Intraday VWAP Price Action IndicatorDISCLAIMER
This Pine Script indicator does not constitute financial advice; it is just intended for educational and informational purposes. It functions as a tool for technical analysis that could help traders spot possible trading opportunities. It is crucial to remember that participating in financial markets has a number of risks that might result in large losses and are not suitable for all investors.
Users are encouraged to conduct their own thorough investigation and analysis prior to using this indicator. Avoiding trading with money that one cannot afford to lose is essential. It is also advised to seek advice from a certified financial expert. Users must use suitable risk management techniques and recognize that past success does not guarantee future outcomes.
Any losses, damages, or other consequences resulting from the usage of this indicator are not the author's responsibility. The user is ultimately responsible for all trading decisions, therefore using this tool is at their own risk.
INTRODUCTION
The “srd786-Intraday VWAP Price Action Indicator” is a sophisticated Pine Script (version 6) trading tool designed for intraday traders who focus on New York session trading hours. This indicator combines multiple technical analysis concepts including Volume Weighted Average Price (VWAP), Average True Range (ATR) for risk management, swing point detection for support/resistance identification, and momentum analysis through RSI. The primary objective is to generate high-probability long and short signals based on price action confluence with trend, momentum, and key structural levels.
1.
VWAP (Volume Weighted Average Price): Shows the "fair" average price based on both price and trading volume.
2.
ATR (Average True Range): Measures how much the price typically moves each day.
3.
Trend Analysis: Identifies whether the market is going up, down, or sideways.
4.
Momentum Indicators: Shows how strong the current price movement is.
5.
Support & Resistance: Identifies key price levels where the price might stop or reverse.
6.
Swing Points: Finds significant turning points in the price.
This indicator is specifically optimized for the New York trading session (9:30 AM to 4:00 PM ET), making it particularly suitable for traders who focus on US market hours. It provides a complete trading framework that includes not only signal generation but also precise trade management levels including entry prices, stop-loss orders, and profit targets based on a configurable reward-to-risk ratio.
The philosophy behind this indicator is confluence-based trading. Rather than relying on a single indicator or condition, it requires multiple factors to align before generating a trade signal. This approach filters out lower-probability setups and focuses only on high-quality opportunities where price action, trend direction, momentum, and key technical levels all point in the same direction.
CORE CONCEPT AND METHODOLOGY
Volume Weighted Average Price (VWAP)
VWAP is the cornerstone of this indicator's trading methodology. Unlike a simple moving average that treats all price bars equally, VWAP incorporates volume data into its calculation, giving more weight to bars with higher trading volume. This makes VWAP a more accurate representation of the true average price where the most significant trading activity occurred.
The calculation of VWAP is performed using the built-in 'ta.vwap()' function, which computes the cumulative volume-weighted average price from the beginning of the session. For intraday traders, VWAP serves as a critical reference point that indicates whether the current price is trading at a premium (above VWAP) or discount (below VWAP) relative to the session's volume-weighted average.
In this indicator, the VWAP source is configurable through the 'vwapSource' parameter, with the default being HLC3 (High + Low + Close / 3). This source selection allows traders to experiment with different price types such as typical price, weighted close, or even custom sources to suit their trading style and market preferences.
Average True Range (ATR) for Risk Management
The Average True Range, calculated using 'ta.atr()', measures market volatility by decomposing the current range of price movement. ATR does not indicate price direction;
instead, it quantifies the degree of price movement or volatility over a specified period. In this indicator, ATR serves dual purposes: determining the distance for limit orders and calculating stop-loss levels.
The 'atrLength' parameter (default: 14) controls the lookback period for the ATR calculation. A shorter length makes the indicator more responsive to recent volatility, while a longer length provides a smoother average that may be more suitable for less volatile markets. The 'atrMultiplier' (default: 1.5) determines how many ATR units away the stop-loss is placed from the entry price, allowing traders to adjust their risk exposure based on current market conditions.
Swing Detection and Support/Resistance
Swing points represent significant turning points in price action where the market has temporarily exhausted its directional momentum. This indicator uses pivot high and pivot low calculations to identify swing highs and swing lows, which then form the basis for dynamic support and resistance levels.
The 'swingLength' parameter (default: 5) defines how many bars to the left and right of a potential pivot point must be lower (for pivot highs) or higher (for pivot lows) to confirm the swing point. This lookback period helps filter out minor price fluctuations and focuses on more significant structural levels.
Support and resistance levels are stored in arrays ('swingHighArray' and 'SwingLowArray'), with the most recent swing points serving as the primary reference levels. The 'srLookback' parameter (default: 20) controls the overall lookback window and also determines how many
swing points to maintain in each array, ensuring that only relevant historical levels are considered.
Breakout Detection
When a price moves past a major support or resistance level, this is known as a price breakout. This price breakout suggests that there is a possibility of a new trend direction heading forward.Breakout detection eliminates noise, as little price fluctuations or volatility may momentarily drive prices past a threshold without authentic conviction.Detection of breakouts affirms robustness when the price above the threshold by 2%, indicating genuine market interest, and mitigates whipsaws to prevent placing trades based on transient price swings.
The Breakout Tolerance parameter, set by default to 2%, regulates the breakout tolerance for the indicator. A price closure above the current high plus a minor tolerance buffer (usually 2%) indicates a potential continuation of upward movement, classified as a Bullish Breakout. Conversely, when the price closes below the recent low plus a minor tolerance buffer (usually 2%), it suggests that the price may continue to decline, which is classified as a Bearish Breakout Down.
Trend Identification
Trend determination is accomplished through an Exponential Moving Average (EMA) with a configurable length ('trendMaLength', default: 9). The indicator classifies trend into three
states: BULLISH (price above EMA with confirmation from the previous bar), BEARISH (price below EMA with confirmation), and SIDEWAYS (price crossing or near the EMA).
The EMA is chosen over simple moving averages because it responds more quickly to recent price changes while still providing enough smoothing to filter out noise. The confirmation requirement (both current and previous bar must be on the same side of the EMA) reduces false signals during periods of choppy price action.
Momentum Analysis
Momentum is measured using the Relative Strength Index (RSI) with a configurable length ('momentumLength', default: 9). RSI values are categorized into five states to provide nuanced momentum readings: STRONG BULL (RSI above 70), BUILDING (RSI between 55 and 70), NEUTRAL (RSI between 45 and 55), WEAKENING (RSI below 45), and STRONG BEAR (RSI below 30).
This momentum categorization allows traders to distinguish between strong trending conditions (STRONG BULL/BEAR) and transitions (BUILDING/WEAKENING), providing context for trade signals and helping to avoid entering positions during momentum divergences.
CONFIGURATION PARAMETERS
VWAP Settings
The 'vwapSource' parameter determines which price value is used in the VWAP calculation. The default value of 'hlc3' (High + Low + Close / 3) provides a balanced representation of each bar's price action. Traders can modify this to use typical price ('high + low + close / 3'), weighted close ('high + low + close + close / 4'), or other price types depending on their analytical preferences.
ATR Settings
The 'atrLength' parameter sets the lookback period for the Average True Range calculation. The default of 14 periods is standard across most trading platforms and timeframes, providing a good balance between responsiveness and smoothness. The 'atrMultiplier' parameter (default: 1.5) scales the ATR value to determine stop-loss distances. A multiplier of 1.5 means the stop-loss is placed 1.5 ATR units away from the entry price, providing enough buffer to accommodate normal volatility while limiting risk.
Trade Settings
The 'rrRatio' parameter (default: 3.0) establishes the reward-to-risk ratio for trade targets. A ratio of 2.0 means the profit target is twice the distance of the stop-loss from the entry price. The 'limitOrderDistance' parameter (default: 0.5) determines how far below (for long trades)
or above (for short trades) the current close the limit order is placed, measured in ATR units. This allows traders to enter positions at better prices while waiting for pullbacks.
Swing Detection Settings
The 'swingLength' parameter (default: 5) controls pivot identification sensitivity. Higher values identify more significant swing points but may miss shorter-term opportunities. The 'showSwings' boolean parameter toggles the visual display of swing high and low points on the chart.
Support & Resistance Settings
The 'srLookback' parameter (default: 20) defines how many bars back to search for swing points and support/resistance levels. The 'breakoutTolerance' parameter (default: 0.02 or 2%) adds a small buffer to breakout detection to account for minor penetration of support/resistance levels due to price spikes or slippage.
Trend & Momentum Settings
The 'trendMaLength' parameter (default: 9) sets the EMA length for trend determination, while 'momentumLength' (default: 9) sets the RSI lookback period. Both should be at least 5 periods for meaningful calculations.
Table Settings
The 'showTable' parameter (default: true) enables the display of two information tables that provide real-time data on Indicator values and trade levels.
SIGNAL GENERATION LOGIC
Long Signal Conditions
A long signal is generated when all the following conditions are simultaneously true:
1.
Session Filter: The trade must occur during New York session hours (9:30 AM - 4:00 PM ET).
2.
Trend Confirmation: The trend must be BULLISH (price above EMA with confirmation).
3.
Price Position: Current price must be above VWAP, indicating bullish price action.
4.
Breakout or No Resistance: Either price is breaking out above resistance level with tolerance, or there is no prior resistance level to overcome.
5.
Momentum Alignment: Momentum must be either STRONG BULL or BUILDING.
This confluence of conditions ensures that long trades are only taken when the market is trending higher, price is confirming strength by trading above VWAP, and momentum is supportive of continued upward movement.
Short Signal Conditions
A short signal is generated when all the following conditions are simultaneously true:
1.
Session Filter: The trade must occur during New York session hours
2.
Trend Confirmation: The trend must be BEARISH (price below EMA with confirmation)
3.
Price Position: Current price must be below VWAP, indicating bearish price action
4.
Breakout or No Support: Either price is breaking down below support level with tolerance, or there is no prior support level to overcome
5.
Momentum Alignment: Momentum must be either STRONG BEAR or WEAKENING
Similar to long signals, short trades require alignment across multiple timeframes and analytical approaches, filtering out counter-trend trades and focusing on high-probability setups.
TRADE MANAGEMENT FRAMEWORK
Entry Price Calculation
For long trades, the limit order price is calculated as: 'Close - (ATR Value × Limit Order Distance)'. This places the entry price below the current close, allowing traders to buy on dips while maintaining a favorable entry price. For short trades, the limit order is placed above the current close: 'Close + (ATR Value × Limit Order Distance)'.
The limit order distance is expressed in ATR units, making it adaptive to current volatility conditions. In more volatile markets, the limit order will be placed further from the current price, while in calmer markets, it will be closer.
Stop-Loss Placement
Stop-loss levels are calculated using the ATR multiplier to ensure adaptive risk management. For long trades: 'Entry Price - (ATR Value × ATR Multiplier)'. For short trades: 'Entry Price + (ATR Value × ATR Multiplier)'.
This adaptive approach to stop-loss placement means that in volatile markets, stops are wider to avoid being stopped out by normal price fluctuations, while in quieter markets, stops are tighter to limit potential losses. The default multiplier of 1.5 provides approximately 1.5 times the average true range of protection.
Target Price Calculation
Profit targets are determined by the reward-to-risk ratio: 'Entry Price + (ATR Stop Distance × RR Ratio)' for long trades and 'Entry Price - (ATR Stop Distance × RR Ratio)' for short trades. The default ratio of 2.0 means the target is twice the distance of the stop-loss, providing a favorable risk-reward profile.
New York Session Tracking
The indicator includes specialized logic for tracking the New York session open price. When a new NY session begins (determined by the 'isNewNySession' variable), the current open price is recorded and maintained throughout the session. This provides a reference point for measuring intraday directional bias from the session's starting level.
INFORMATION TABLES
Indicators Table
This table displays the current price, VWAP value, NY session open price, support level,resistance level, ATR, ATR-scaled stop distance, current trend classification, momentum state with RSI value, and breakout status. All values are color-coded based on their bullish or bearish implications. The VWAP cell is color-coded green if price is above VWAP (bullish) and red if below (bearish), providing instant visual confirmation of price's position relative to this critical level.
Trade Levels Table
This table shows current signal status (LONG, SHORT, or WAIT), limit order distance in ATR units, calculated limit order price, stop-loss level, and target price with the reward-to-risk ratio displayed. The signal cell is highlighted in green for long signals and red for short signals.
ALERT CONDITIONS
The indicator includes four alert conditions that can be configured in TradingView:
1.
LONG Signal: Triggers when a long signal is generated, providing entry price, stop-loss, and target information.
2.
SHORT Signal: Triggers when a short signal is generated with corresponding trade details.
3.
Breakout Up: Notifies when price breaks out above resistance level.
4.
Breakout Down: Notifies when price breaks down below support level.
These alerts enable traders to receive notifications via TradingView's alert system without continuously monitoring the charts.
USAGE EXAMPLES AND TRADING SCENARIOS
Strong Bullish Trend with VWAP Support
In this scenario, price has been trading above the 9-period EMA for multiple bars, confirming a bullish trend. The current price is above VWAP, indicating buyers are willing to pay a premium. A recent swing low has established a support level, and RSI is reading 65, indicating building momentum without being overextended. When price breaks above the recent swing high resistance with a 2% tolerance, the indicator generates a long signal. The trader places a limit order below the current bar's close (0.5 ATR units) and sets the stop-loss 1.5 ATR units below the entry, with a target 2.0 times the stop distance away.
Short Setup During Volatile Session
During a particularly volatile NY session, price gaps down below VWAP early in the day. The 9-period EMA is declining, and both current and previous bars are below it, confirming a bearish trend. The RSI has dropped to 28, indicating strong bearish momentum. A recent swing high serves as resistance, and when price breaks below the swing low support level, the indicator generates a short signal. The trader enters on a limit order placed 0.5 ATR units above the current price, with the stop-loss 1.5 ATR units above the entry and the target at a 2.0 reward-to-risk ratio.
Avoiding Counter-Trend Trades
Consider a scenario where price is above VWAP and the RSI reads 72 (overbought), but the price is below the 9-period EMA and the previous bar was also below the EMA. In this case, the trend is classified as BEARISH (or SIDEWAYS) despite the bullish price position relative to VWAP. The indicator will not generate a long signal because the trend condition is not met, protecting the trader from what could be a bear trap or continuation pattern.
No Prior Levels Scenario
At the beginning of a trading session or after significant volatility has cleared prior swing points, there may be no established support or resistance levels in the lookback window. In this case, the breakout condition 'or na(resistanceLevel)' allows long signals to be generated without requiring a resistance level to be broken, enabling traders to participate in emerging trends without waiting for prior levels to form.
BEST PRACTICES AND TIPS
Timeframe Selection
This indicator is optimized for intraday timeframes (1-minute to 60-minute charts) and specifically for NY session trading. Higher timeframes may produce more reliable signals but fewer opportunities, while lower timeframes will generate more signals but with potentially lower reliability. Traders should backtest on their preferred timeframe before trading live.
Market Conditions
The indicator performs best in trending markets with clear directional bias. During ranging or sideways markets, the trend condition may oscillate frequently, and VWAP may oscillate around price, reducing signal quality. Consider filtering signals or reducing position size during low-volatility, range-bound conditions.
Parameter Optimization
While the default parameters have been selected for general applicability, traders should consider optimizing certain parameters for specific markets or instruments. For highly volatile instruments like crude oil or natural gas, increasing the 'atrMultiplier' to 2.0 or 2.5 may provide more appropriate risk management. For less volatile instruments like certain forex pairs, reducing the multiplier to 1.0 or 1.2 may improve signal quality.
Multiple Timeframe Analysis
For enhanced performance, traders can analyze the trend on a higher timeframe (such as 15-minute or hourly) while taking signals on a lower timeframe (such as 5-minute or 1-minute). This multi-timeframe approach ensures that signals are aligned with the larger trend direction.
Risk Management
While the indicator provides calculated stop-loss levels, traders should consider their overall position sizing and portfolio risk. The ATR-based stops provide a market-adaptive approach, but individual risk tolerance and account size should ultimately determine position sizing. The 2.0 reward-to-risk ratio is fixed but can be adjusted based on personal preferences or the specific characteristics of the instrument being traded.
INTEGRATION WITH TRADINGVIEW
Adding the Indicator
To add this indicator to a TradingView chart, paste the code into the Pine Script editor and click "Add to Chart." The indicator will appear in the chart's sidebar and begin calculating immediately once sufficient historical data is available.
Configuring Alerts
To set up alerts, right-click on any of the alert conditions in the indicator's settings panel (long signal, short signal, breakout up, or breakout down) and select "Add Alert." Configure the alert frequency and notification methods (push notification, email, webhook, etc.) according to your preferences.
Customization
All input parameters can be adjusted through the indicator's settings panel without modifying the source code. Traders can experiment with different VWAP sources, ATR lengths and multipliers, swing detection parameters, and table display options to suit their trading style and market preferences.
LIMITATIONS AND CONSIDERATIONS
Session Dependency
The indicator is specifically designed for NY session trading and will not generate signals outside these hours. Traders focused on other sessions or 24-hour markets may need to modify the session string to match their trading hours.
Historical Data Requirements
The indicator requires sufficient historical data to accurately calculate swing points and support/resistance levels. On lower timeframe charts with limited history, the initial signals may be less reliable until adequate swing points are identified.
Lag in Swing Detection
By definition, swing points are confirmed after the price has moved away from them, introducing some lag into support/resistance identification. Traders should be aware that the most recent swing point may not be confirmed until several bars after it occurs.
Not Financial Advice
This indicator is a technical analysis tool and should not be construed as financial advice. Traders are responsible for their own research and risk management decisions. Past performance of any trading system does not guarantee future results.
SUMMARY
The code follows a logical flow:
•
Version and Declaration: Pine Script version 6 indicator declaration with overlay enabled
•
Input Parameters: All user-configurable settings grouped by category
•
Session Logic: New York session tracking and open price recording
•
Core Calculations: VWAP, ATR, EMA, RSI, swing points
•
Support/Resistance Logic: Array-based storage and retrieval of swing levels
•
Trend and Momentum Classification: Categorization of current market state
•
Signal Generation: Confluence-based long and short conditions
•
Trade Level Calculations: Entry, stop-loss, and target pricing
•
Visual Plots: Hidden plots for alert data access
•
Information Tables: Real-time display of key values
•
Alert Conditions: Four configurable alert triggers
This structured approach ensures clarity, maintainability, and extensibility for future modifications or enhancements.
