VWAP and IVP Volatility Screener AlertVWAP and IVP Volatility Screener Alert is a multi-asset, institutional-grade market scanner that combines Auto-Anchored VWAP, Implied Volatility Percentile (IVP), Choppiness Index, Strike Price Structure, and Volume Profile (POC / Value Area) to generate high-probability trade signals across multiple symbols.
Designed for traders who rely on volatility regimes, VWAP interactions, trend confirmation, and strike-based price behavior, this tool automatically evaluates up to 10 assets simultaneously and displays actionable BUY/SELL conditions in a unified dashboard and screener panel.
Key Features
1. Multi-Asset Screener (10 Symbols)
Scans FX, indices, commodities, and metals. Displays RSI, ADX, trend, score, volatility regime, VWAP/POC/Value Area position, IVP, and Choppiness. Custom strike increments per asset.
2. Auto-Anchored VWAP System
Auto anchors by Session, Day, Week, Month, or Auto. Includes VWAP bands and bounce detection to show when price is Above, Below, or interacting with VWAP.
3. Volume Profile + POC / Value Area
Generates intraday/session POC, VAH, and VAL. Detects breaks, retests, and bounce signals.
4. IV Percentile (IVP) Engine
Converts realized volatility into IVP and classifies regimes (EXT.HI → EXT.LO). Supports Favorable, Extreme, and High-Volatility modes for different trading styles.
5. Choppiness Index (CHOP)
Identifies trending vs ranging conditions and feeds directly into scoring and alerts.
6. 11-Criteria Alert System
Alert logic includes RSI, ADX, trend, volume, VWAP, POC/VA, strike proximity, std-dev breaks, IVP, CHOP, and score thresholds. Supports Score-Based or Multi-Criteria modes.
7. Price-to-Strike Mapping
Rounds price to the correct strike ladder, detecting reversals, continuation, breakout levels, and helping frame stop-loss/TP zones.
8. Session-Aware Filtering
Filters signals for Asian, London, and NY sessions with custom timezone support.
Search in scripts for "vwap"

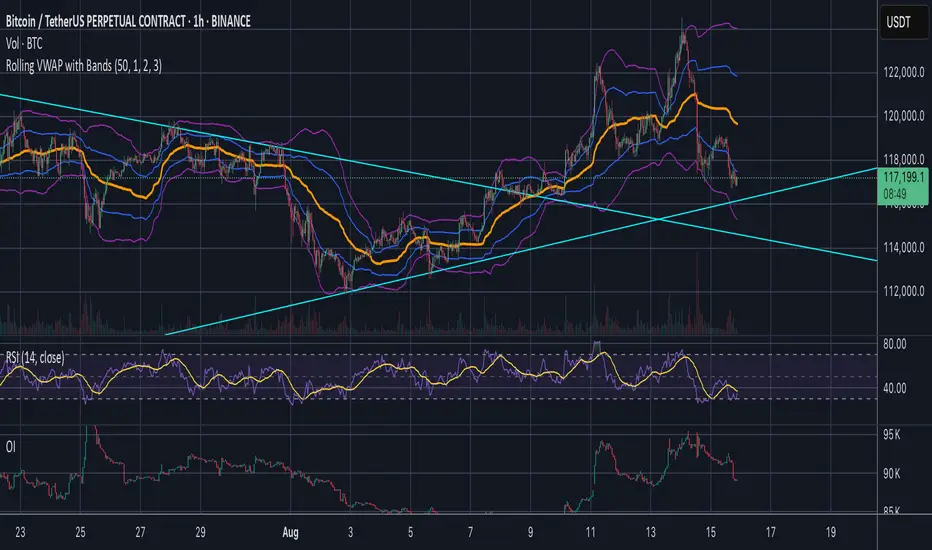
Jose's Rolling VWAP with BandsRolling VWAP with Customizable Deviation Bands
This indicator plots a rolling Volume Weighted Average Price (VWAP) over a user-defined lookback period, rather than resetting each day or from a fixed anchor point. The rolling calculation makes it act more like a moving average — but weighted by volume — providing a smoother, more adaptive central price line.
It also includes up to three optional deviation bands, which can be independently toggled on/off and assigned their own multipliers. These bands are calculated using the chosen lookback’s standard deviation, giving traders a quick visual of price dispersion around VWAP.
Features:
Adjustable rolling VWAP lookback length
Up to 3 customizable standard deviation bands
Individual checkboxes for enabling/disabling each band
Independent multiplier control for each band
Works on any timeframe and symbol
Uses:
Identify overextended price moves relative to VWAP
Spot dynamic support/resistance zones
Gauge mean reversion opportunities
Confirm trend strength when price hugs or breaks away from VWAP
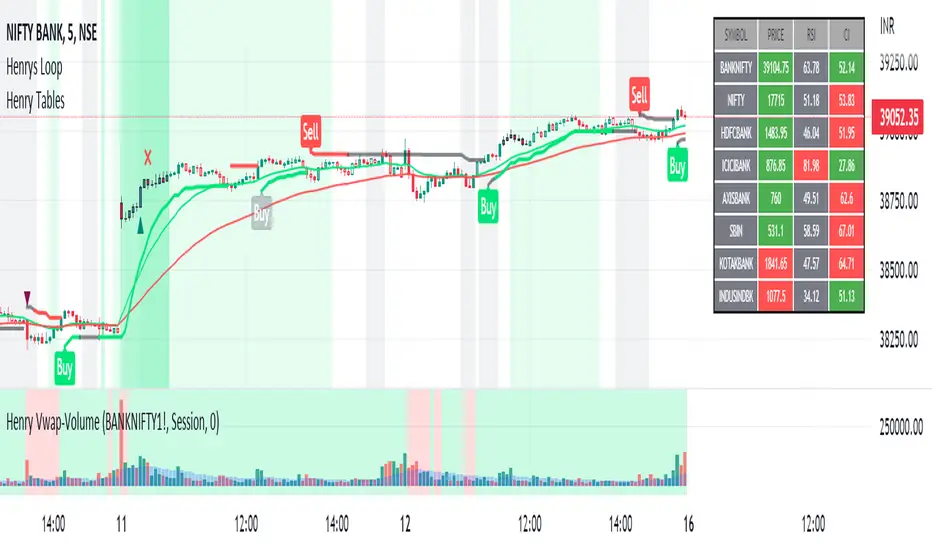
Henry's Vwap-VolumeThis Indicator is meant to provide Futures Volume and Vwap Signal in spot charts of Nifty and Banknifty Traders.
Concepts and Features of this indicators are as follows :
1) Now u don't have to select and change to futures scrip often or have both spot and futures chart in same window to watch the Futures Volume and Vwap.
2) U get Both Volume and Vwap signal as a indicator in single pane.
3) Its for Nifty and Banknifty Traders specially.
4)Volume with moving average is from the futures chart of banknifty or nifty,also may select any other futures script as per ur need.
(MOVING AVERAGE of VOLUME is plotted in Blue columns over the Volume.)
5)Vwap signal is also derived from the futures chart of banknifty or nifty,also may select any other futures script as per ur need.
(VWAP SIGNAL is plotted in GREEN or RED as background.If futures price higher than Vwap then Green , opposite for Red. )
6)The idea of this script is to give extra confirmation of a clear down or uptrend while u are in the spot chart.(nifty and banknifty)
7) U can select and change any scrip u like.But I urge to use futures chart of banknifty or nifty.
I hope this indicator will help a lot of retail investor save their hard earned money in the stock market and benefit from Mr. NK's strategy.
How to Use :
Go Long - when background is Green.
Go Short -when background is Red.
(Also take confirmation from the blue columns -moving average of volumes.volume higher or less than it.)
Limitations :
U can only use it for intraday,less than 1D timeframe.
Will not work in sideways market.
Take help of other indicators also like Rsi,adx,etc.
Best of Luck,
Henry
[ProfitTrailer] VWAPPERCENTAGE Buy/Sell StudyProfitTrailer buy/sell study for VWAPPERCENTAGE strategy.
The script highlights the region where trailing is most likely to succeed.

Multiple VWAPAn intraday indicator which plots the 3 different VWAP.
1. D-VWAP shows VWAP from the first candle of the day
2. W-VWAP shows VWAP from the first candle of the week
3. M-VWAP shows VWAP from the first candle of the month
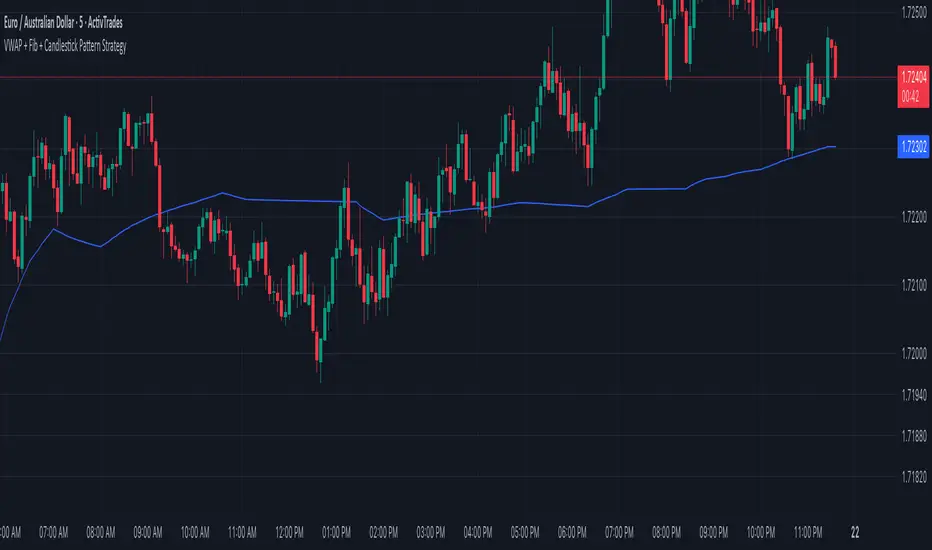
VWAP + Fib + Candlestick Pattern Strategy### **VWAP + Fibonacci + Candlestick Pattern Strategy (v6)**
This indicator is designed to identify high-quality trading setups using a combination of **Anchored VWAP, Fibonacci Retracement Levels, and Candlestick Patterns**. It helps traders find optimal entry points where multiple confluences align, enhancing trade accuracy.
### **Key Features:**
✅ **Anchored VWAP** – Starts from the last pivot low (bullish) or pivot high (bearish) to determine trend strength.
✅ **Fibonacci Levels** – Uses key retracement levels (0.382, 0.5, 0.618, 0.786) for added confluence.
✅ **Candlestick Patterns** – Detects Pin Bars, Engulfing Candles, and Hammer Candles for potential reversals.
✅ **High-Quality Setups** – Highlights strong signals where price aligns with VWAP & Fib zones.
✅ **Alerts** – Get notified when a bullish or bearish setup is detected.
✅ **Risk Management** – Includes Take Profit (TP1, TP2, Final TP) & Stop Loss based on ATR.
✅ **Position Sizing** – Calculates position size based on a fixed dollar risk per trade.
### **How to Use:**
1. Apply the indicator to your chart.
2. Look for signals near Fibonacci retracement levels and VWAP.
3. Use alerts for real-time trade notifications.
4. Manage risk with built-in TP/SL and position sizing.
Perfect for traders who use **Price Action & Smart Money Concepts** to refine their entries! 🚀
RSI Div at Daily VWAP StDevMean Reversion indicator based on RSI Divergences at Overbought/Oversold conditions with Price above/below a Standard Deviation from Daily VWAP. Useful for intra-day trading.
Signal criteria:
1. RSI is at Overbought/Oversold
2. RSI Divergence present (not hidden)
3. RSI has not reached Neutral level (i.e. 50)
4. Price has crossed above/below a Standard Deviation from Daily VWAP
Config Options:
- RSI length (default:14)
- Divergence Lookback Period (default:14)
- RSI Oversold/Overbought tresholds (default: 70/30)
- RSI Reset Level (default: 55/45)
- Use VWAP Std Dev (default: yes)
- Standard Deviation from Daily VWAP (default: 1.51)
Use with discretion.

Advanced custom multi MA signals (EMA/SMA/VWMA/VWAP) Features of Multi Moving Averages
The biggest enemy in trading is "Noise." If you get swayed by minute fluctuations on the chart, you end up missing the forest for the trees.
This indicator (Advanced Custom Multi MA Signals) is not just a simple line. By combining the three core elements of Price, Time, and Volume, it acts as a navigation system that visualizes the market's "true trend." In particular, the ability to analyze 5 moving averages simultaneously across various timeframes is akin to viewing a 3D map of the battlefield.
Understanding Core Concepts
This indicator supports 4 types of moving averages. It is crucial to clearly understand the nature of each tool.
SMA (Simple Moving Average): The most basic average value. Since it produces fewer whipsaws (false signals), it is used as a baseline to judge the "long-term trend."
EMA (Exponential Moving Average): Places more weight on recent prices. It reacts sensitively to market changes, making it advantageous for identifying "entry points."
VWMA (Volume Weighted Moving Average): Incorporates "volume" into the price calculation. It acts as a "false signal filter," weeding out price moves that aren't backed by trading volume.
VWAP (Volume Weighted Average Price): The benchmark price used by institutional investors for daily trading. It is calculated based on the session, regardless of the period settings. It is considered the "lifeline" of day trading.
Indicator Settings Guide
Open the settings window and tune it to fit your trading style.
MA 01 ~ 05 (Moving Average Settings)
MA Type: Select according to your purpose. (Generally, EMA is recommended for short-term analysis, SMA/VWMA for long-term).
Length: Enter the period you wish to analyze (e.g., 20, 60, 120, 200).
Timeframe: This is the core feature. It allows you to overlay moving averages from a higher timeframe (e.g., 4-hour, Daily) onto the chart you are currently viewing (e.g., 15-minute).
Signal Option (Trading Signals)
Golden Cross (GC) / Death Cross (DC): Captures the moment the short-term line breaks through the long-term line. You can run up to 3 strategies simultaneously.
Ribbon Gradient (Trend Visualization)
Represents the gap between two moving averages with color. As the color deepens and the width expands, it indicates a powerful trend; if the width narrows, it suggests a high probability of a trend reversal.
5 Usage Strategies
The highlight of this indicator is the cross strategy utilizing the "Multi-Timeframe (MTF)" feature. Familiarize yourself with the 5 example strategies below and set up your own strategy based on your expertise.
💡 Tip 1. Do not go against the "Major Trend" (The Authority of the Weekly Candle)
Settings: Set MA5 to .
Interpretation: The Weekly 50 line is the "major trend line" managed by institutions and market makers. If the current price is above this line, maintain only a "Buy (Long)" bias; if below, maintain only a "Sell (Short)" bias. Adhering to this rule alone can help you avoid massive losses.
💡 Tip 2. Highly Reliable "Swing Signal" (Daily Golden Cross)
Settings: In Signal 1, configure the Short MA to and the Long MA to .
Interpretation: A Golden Cross where the 4-Hour 50 EMA breaks above the Daily 50 EMA often signifies a major "trend reversal" rather than a temporary rebound. This provides an ideal entry signal for office workers or swing traders who need high reliability.
💡 Tip 3. 4-Hour Candle as the Standard for "Precision Entry"
Situation: When the Daily trend is rising (Bullish alignment).
Strategy: While watching the 15-minute or 1-hour chart, set the indicator's Signal 2 to the cross of and .
Interpretation: When the Daily chart is in an uptrend, a Golden Cross occurring on the 4-Hour chart marks "the point where a correction (pullback) ends and the rise resumes." This is the entry point with the best risk-to-reward ratio.
💡 Tip 4. Filtering Out "Fake Signals" (The Secret of Volume)
Strategy: When creating a cross signal, try using VWMA (Volume Weighted) for the Long MA, even if you use EMA for the Short MA.
Reason: A Golden Cross caused simply by a rise in price can be a trap. However, if it breaks through the heavy VWMA line accompanied by volume, it is strong evidence that "genuine liquidity" has entered.
💡 Tip 5. Remember the "Hierarchy" (Higher Timeframe Priority Rule)
Principle: If a Golden Cross (Buy Signal) appears on the 4-Hour chart, but the Daily chart is in a Death Cross (Sell Signal) state, do not enter.
Interpretation: A signal from a lower timeframe cannot overcome the power of a higher timeframe. The professional approach is to trade with significant volume only when signals align (Sync) in the order of Weekly > Daily > 4-Hour. Keep this indicator's dashboard feature on and always check the status of higher timeframes.
Signal Generation Principle (Operating Mechanism)
Signals are generated when the set short-term moving average and long-term moving average cross each other.
📈 1. Golden Cross (BUY = Buy Signal)
Situation: The moment the short-term MA crosses upward from below the long-term MA.
Principle: It implies that recent buying pressure has broken through the resistance level accumulated over a long period.
📉 2. Death Cross (SELL = Sell Signal)
Situation: The moment the short-term MA crosses downward from above the long-term MA.
Principle: It implies that recent selling pressure has collapsed the long-term support line.
※ If the candles are not displaying correctly or are flickering, please set the indicator's 'Visual order' to 'Bring to front' as shown in the image below.
Investment Caution and Disclaimer
Before using this indicator for actual trading, please strictly read the contents below.
① Auxiliary indicators are a "Compass," not a "Book of Prophecy."
This indicator is merely a tool that mathematically calculates and visualizes past price data. A "magic indicator" that predicts future price fluctuations 100% accurately or guarantees profit does not exist. The signals provided are for reference only and must never be the sole basis for entry/exit decisions.
② The responsibility for all investments lies with "Yourself."
Financial investment (Cryptocurrencies, Stocks, Futures, etc.) involves high volatility and is a risky activity that can result in the loss of some or all of the principal. The final responsibility for all trading results (profits and losses) incurred by utilizing this indicator lies entirely with the investor. The distributor and developer accept no legal responsibility for investment results under any circumstances.
③ Past data does not guarantee the future.
Even a Golden Cross that fit perfectly in backtesting or past charts may operate differently in tomorrow's market situation (News, Macroeconomics, Unexpected Variables, etc.). Do not rely solely on technical analysis; you must conduct fundamental analysis and risk management in parallel.
④ Risk management is the top priority.
No matter how promising a signal appears, "all-in trading" (investing all assets in a single trade) is a shortcut to bankruptcy. More important than the indicator itself is adhering to the principles of strict scaling in (split buying) and Stop-Loss.

Pivot Regime Anchored VWAP [CHE] Pivot Regime Anchored VWAP — Detects body-based pivot regimes to classify swing highs and lows, anchoring volume-weighted average price lines directly at higher highs and lower lows for adaptive reference levels.
Summary
This indicator identifies shifts between top and bottom regimes through breakouts in candle body highs and lows, labeling swing points as higher highs, lower highs, lower lows, or higher lows. It then draws anchored volume-weighted average price lines starting from the most recent higher high and lower low, providing dynamic support and resistance that evolve with volume flow. These anchored lines differ from standard volume-weighted averages by resetting only at confirmed swing extremes, reducing noise in ranging markets while highlighting momentum shifts in trends.
Motivation: Why this design?
Traders often struggle with static reference lines that fail to adapt to changing market structures, leading to false breaks in volatile conditions or missed continuations in trends. By anchoring volume-weighted average price calculations to body pivot regimes—specifically at higher highs for resistance and lower lows for support—this design creates reference levels tied directly to price structure extremes. This approach addresses the problem of generic moving averages lagging behind swing confirmations, offering a more context-aware tool for intraday or swing trading.
What’s different vs. standard approaches?
- Baseline reference: Traditional volume-weighted average price indicators compute a running total from session start or fixed periods, often ignoring price structure.
- Architecture differences:
- Regime detection via body breakout logic switches between high and low focus dynamically.
- Anchoring limited to confirmed higher highs and lower lows, with historical recalculation for accurate line drawing.
- Polyline rendering rebuilds only on the last bar to manage performance.
- Practical effect: Charts show fewer, more meaningful lines that start at swing points, making it easier to spot confluences with structure breaks rather than cluttered overlays from continuous calculations.
How it works (technical)
The indicator first calculates the maximum and minimum of each candle's open and close to define body highs and lows. It then scans a lookback window for the highest body high and lowest body low. A top regime triggers when the body high from the lookback period exceeds the window's highest, and a bottom regime when the body low falls below the window's lowest. These regime shifts confirm pivots only when crossing from one state to the other.
For top pivots, it compares the new body high against the previous swing high: if greater, it marks a higher high and anchors a new line; otherwise, a lower high. The same logic applies inversely for bottom pivots. Anchored lines use cumulative price-volume products and volumes from the anchor bar onward, subtracting prior cumulatives to isolate the segment. On pivot confirmation, it loops backward from the current bar to the anchor, computing and storing points for the line. New points append as bars advance, ensuring the line reflects ongoing volume weighting.
Initialization uses persistent variables to track the last swing values and anchor bars, starting with neutral states. Data flows from regime detection to pivot classification, then to anchoring and point accumulation, with lines rendered globally on the final bar.
Parameter Guide
Pivot Length — Controls the lookback window for detecting body breakouts, influencing pivot frequency and sensitivity to recent action. Shorter values catch more pivots in choppy conditions; longer smooths for major swings. Default: 30 (bars). Trade-offs/Tips: Min 1; for intraday, try 10–20 to reduce lag but watch for noise; on daily, 50+ for stability.
Show Pivot Labels — Toggles display of text markers at swing points, aiding quick identification of higher highs, lower highs, lower lows, or higher lows. Default: true. Trade-offs/Tips: Disable in multi-indicator setups to declutter; useful for backtesting structure.
HH Color — Sets the line and label color for higher high anchored lines, distinguishing resistance levels. Default: Red (solid). Trade-offs/Tips: Choose contrasting hues for dark/light themes; pair with opacity for fills if added later.
LL Color — Sets the line and label color for lower low anchored lines, distinguishing support levels. Default: Lime (solid). Trade-offs/Tips: As above; green shades work well for bullish contexts without overpowering candles.
Reading & Interpretation
Higher high labels and red lines indicate potential resistance zones where volume weighting begins at a new swing top, suggesting sellers may defend prior highs. Lower low labels and lime lines mark support from a fresh swing bottom, with the line's slope reflecting buyer commitment via volume. Lower highs or higher lows appear as labels without new anchors, signaling possible range-bound action. Line proximity to price shows overextension; crosses may hint at regime shifts, but confirm with volume spikes.
Practical Workflows & Combinations
- Trend following: Enter longs above a rising lower low anchored line after higher low confirmation; filter with rising higher highs for uptrends. Use line breaks as trailing stops.
- Exits/Stops: In downtrends, exit shorts below a higher high line; set aggressive stops above it for scalps, conservative below for swings. Pair with momentum oscillators for divergence.
- Multi-asset/Multi-TF: Defaults suit forex/stocks on 1H–4H; on crypto 15M, shorten length to 15. Scale colors for dark themes; combine with higher timeframe anchors for confluence.
Behavior, Constraints & Performance
Closed-bar logic ensures pivots confirm after the lookback period, with no repainting on historical bars—live bars may adjust until regime shift. No higher timeframe calls, so minimal repaint risk beyond standard delays. Resources include a 2000-bar history limit, label/polyline caps at 200/50, and loops for historical point filling (up to current bar count from anchor, typically under 500 iterations). Known limits: In extreme gaps or low-volume periods, anchors may skew; lines absent until first pivots.
Sensible Defaults & Quick Tuning
Start with the 30-bar length for balanced pivot detection across most assets. For too-frequent pivots in ranges, increase to 50 for fewer signals. If lines lag in trends, reduce to 20 and enable labels for visual cues. In low-volatility assets, widen color contrasts; test on 100-bar history to verify stability.
What this indicator is—and isn’t
This is a structure-aware visualization layer for anchoring volume-weighted references at swing extremes, enhancing manual analysis of regimes and levels. It is not a standalone signal generator or predictive model—always integrate with broader context like order flow or news. Use alongside risk management and position sizing, not as isolated buy/sell triggers.
Many thanks to LuxAlgo for the original script "McDonald's Pattern ". The implementation for body pivots instead of wicks uses a = max(open, close), b = min(open, close) and then highest(a, length) / lowest(b, length). This filters noise from the wicks and detects breakouts over/under bodies. Unusual and targeted, super innovative.
Disclaimer
The content provided, including all code and materials, is strictly for educational and informational purposes only. It is not intended as, and should not be interpreted as, financial advice, a recommendation to buy or sell any financial instrument, or an offer of any financial product or service. All strategies, tools, and examples discussed are provided for illustrative purposes to demonstrate coding techniques and the functionality of Pine Script within a trading context.
Any results from strategies or tools provided are hypothetical, and past performance is not indicative of future results. Trading and investing involve high risk, including the potential loss of principal, and may not be suitable for all individuals. Before making any trading decisions, please consult with a qualified financial professional to understand the risks involved.
By using this script, you acknowledge and agree that any trading decisions are made solely at your discretion and risk.
Do not use this indicator on Heikin-Ashi, Renko, Kagi, Point-and-Figure, or Range charts, as these chart types can produce unrealistic results for signal markers and alerts.
Best regards and happy trading
Chervolino

xVWAP (Multi-Source VWAP)This indicator lets you plot a true cross-symbol VWAP — volume-weighted average price taken from any symbol or from your current chart. It’s ideal for futures, micros/minis, indices, and correlated assets (e.g., MGC ↔ GC1!, MNQ ↔ NQ1!, ES ↔ SPX).
You can choose the source symbol, anchor period, and display up to three standard-deviation bands around VWAP.
In the chart, since I trade Micros, I used MGC1! (colored), then overlay it with the VWAP from GC1! (Grey).

Multiple Timeframe Rolling VWAPsThis indicator plots up to five customizable time-based Rolling Volume-Weighted Average Price (RVWAP) lines.
Each VWAP can be enabled or disabled and configured with a user-defined time period (days, hours, minutes) and minimum bars. It supports multi-timeframe analysis, allowing users to toggle between the current chart resolution and a custom timeframe (e.g., daily, weekly).
Ideal for traders analyzing volume-weighted price trends across multiple periods. Features include five independent VWAP lines with distinct colors, flexible time periods, and robust calculations. Ensure your chart has volume data for accurate results.

Multi-timeframe 24 moving averages + BB+SAR+Supertrend+VWAP █ OVERVIEW
The script allows to display up to 24 moving averages ("MA"'s) across 5 timeframes plus two bands (Bollinger Bands or Supertrend or Parabolic SAR or VWAP bands) each from its own timeframe.
The main difference of this script from many similar ones is the flexibility of its settings:
- Bulk enable/disable and/or change properties of several MAs at once.
- Save 3 of your frequently used templates as presets using CSV text configurations.
█ HOW TO USE
Some use examples:
In order to "show 31, 50, 200 EMAs and 20, 100, 200 SMAs for each of 1H, 4H, D, W, M timeframes using blue for short MA, yellow for mid MA and red for long MA" use the settings as shown on a screenshot below.
In order to "Show a band of chart timeframe MA's of lengths 5, 8, 13, 21, 34, 55, 100 and 200 plus some 1H, 4H, D and W MAs. Be able to quickly switch off the band of chart tf's MAs. For chart timeframe MA's only show labels for 21, 100 and 200 EMAs". You can set TF1 and TF2 to chart's TF and set you fib MAs there and configure fixed higher timeframe MAs using TF3, TF4 and TF5 (e.g. using 1H, D and W timeframes and using 1H 800 in place of 4H 200 MA). However, quicker way may be using CSV - the syntax is very simple and intuitive, see Preset 2 as it comes in the script. You can easily switch chart tf's band of MAs by toggling on/off your chart timeframe TF's (in our example, TF1 and TF2).
The settings are either obvious or explained in tooltips.
Note 1: When using group settings and CSV presets do not forget that individual setting affected will no have any effect. So, if some setting does not work, check whether it is overridden with some group setting or a CSV preset.
Note 2: Sometimes you can notice parts of MA's hanging in the air, not lasting up to the last bar. This is not a bug as explained on this screenshot:
█ FOR DEVELOPERS
The script is a use case of my CSVParser library, which in turn uses Autotable library, both of which I hope will be quite helpful. Autotable is so powerful and comprehensive that you will hardly ever wish to use normal table functions again for complex tables.
The indicator was inspired by Pablo Limonetti's url=https://www.tradingview.com/script/nFs56VUZ/]Multi Timeframe Moving Averages and Raging @RagingRocketBull's # Multi SMA EMA WMA HMA BB (5x8 MAs Bollinger Bands) MAX MTF - RRB

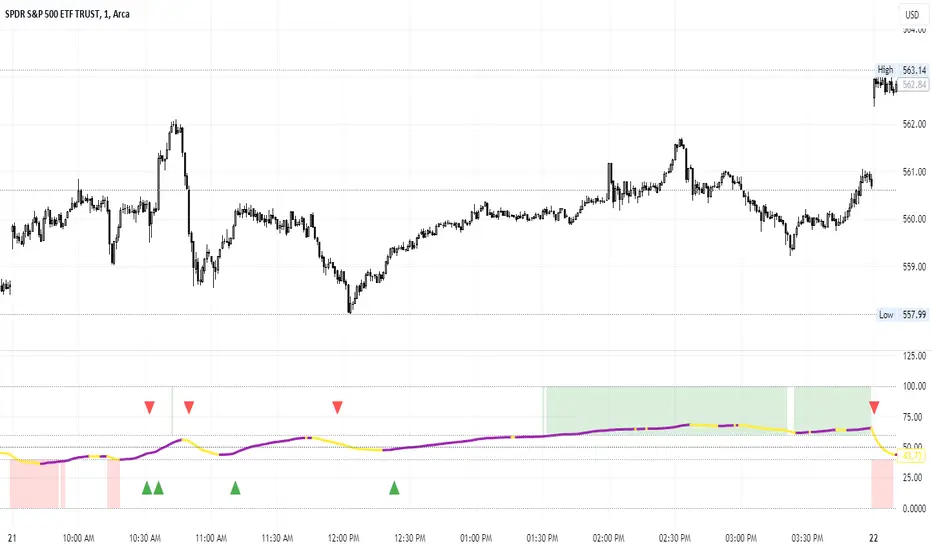
Percent of U.S. Stocks Above VWAPThis indicator plots a line reflecting the percentage of all U.S. stocks above or below their VWAP for the given candle. Horizontal lines have been placed at 40% (oversold), 50% (mid-line), and 60% (overbought). I recommend using this indicator as a market breadth indicator when trading individual stocks. In my experience, this indicator is best utilized while trading the major indices (SPX, SPY, QQQ, IWM) or their futures (ES, NQ, RTY) in the following manner:
- When the line crosses 50%, a green or red triangle is plotted indicating the majority of market momentum has turned bullish or bearish based on price positioning vs. VWAP. Look for longs when the line is rising (green) or above 50%, or shorts when the line is falling (red) or below 50%.
- When the line is below 40%, indicator shows red shading; I would not be long anything during this period. When the line exits this level, I begin looking for long entries. This line is adjustable in the indicator settings if you prefer to use a tighter or looser oversold level.
- When the line is above 60%, indicator shows green shading; I would not be short anything during this period. When the line exits this level, I begin looking for short entries. This line is adjustable in the indicator settings if you prefer to use a tighter or looser overbought level.
This indicator uses the TradingView ticker “PCTABOVEVWAP.US”, thus it only updates during NY market hours. If trading futures, I recommend applying VWAP to your chart and using that as the level to trade against in a similar manner, along with your personal price action analysis and other indicators you find useful.
RTH & ETH VWAPs [vnhilton]Plots 2 different VWAPs for regular & extended trading sessions, with option for a plot fill between the 2 (using pinescript's new vertical gradient feature).

Average Daily Range Lines + VWAP by TenozenOANDA:EURUSD
Hello! I created an indicator called ADRL (Average Daily Range Lines). This is my first original work, and I hope it's helpful to you guys.
1. Let me explain a bit of how it works...
So first of I need the ADR value, as by default length I use 19 for it. I want this indicator to calculate every start of the new day and break if another new day starts, so if the target level isn't reached, then the value would start to go back to 0 and get the new target level of the day. The target level is based on the first ADR multiplied by how much "percent" we want for the target level to hit, based on the first ADR value of the day. When the new day starts, the algo would start to add up the ADR value. If the added ADR hits the target level, it starts to plot a line by the candlestick by its high, low, and mid-level; it would create a new line if there is a new target being hit. So that's it.
About the VWAP, I took Tradingview's VWAP. I added the anchored part so I can plot a line if there is a new target level being hit. I hope that's okay.
2. How to use it...
- Using this indicator is pretty easy. When a new box is being plotted, that means that's the time when you should trade, as the box is still fresh. The VWAP helps if the market is trending or not.
- You can treat this indicator just like an S&R, as the price tends to respect the box. So best to use it as a pullback trade.
- We can assume if the price above the box, is a buy; vice versa.
3. Best Market to use...
- I suggest a trade in a nonvolatile market. The more volatile the market is, the harder the box is to be respected by the price. But if you really want to trade in that market, I suggest adjusting the inputs by how the box is being respected.
4. Suggestions...
- Use this indicator in 5 minutes chart if you day trade.
- Try using 30 minutes and setting the percent input from 100 to 80 and changing the ADR length from 19 to 14, this is much more suitable if you tend to hold trades.

Rolling Anchored Vwap ExperimentalCurrently only some timeframes, but I can add more, this was made when requesting additional timeframes from the original creator, this was my quick interpretation of the code.
It works by rolling the vwap, so it never resets but is always X amount of time back as the source for the start of data. Its really useful i use it daily.

GMS: VWAP with Percent BandsThis is a pretty straight-forward script. I just wanted to see percent bands around the VWAP after looking at the standard deviation bands for a while and even dabbling with keltner channels. This is the cleanest in my opinion. The script is open so feel free to poke around!
The default settings are below, just to confuse 0.25 with 25%.
0.25 = 0.25%
0.5 = 0.50%
0.75 = 0.75%
PS - it's not multi-timeframe yet. That'll come in the next update.
Hope this helps,
Andre
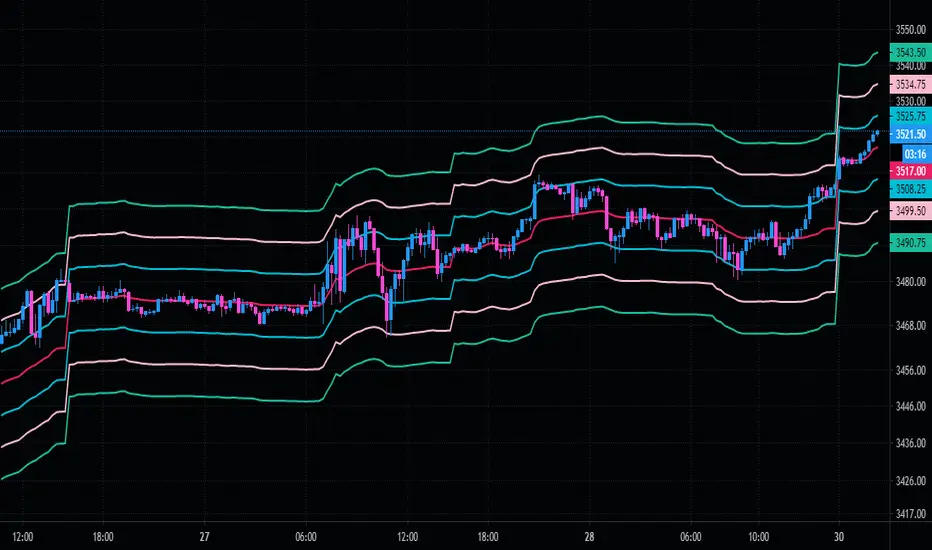
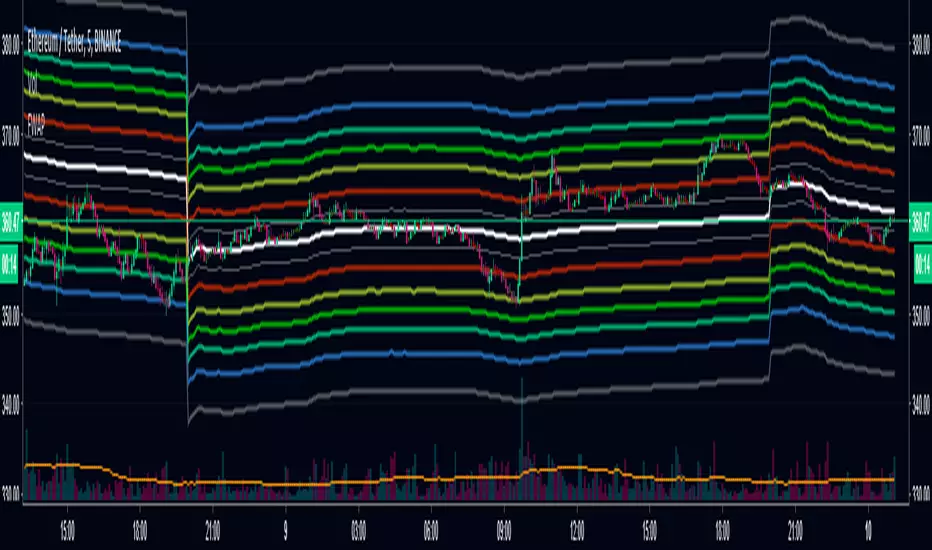
MTF VWAP & StDev BandsMulti Timeframe Volume Weighted Average Price with Standard Deviation Bands
I used the script "Koalafied VWAP D/W/M/Q/Y" by Koalafied_3 and made some changes, such as adding more standard deviation bands.
The script can display the daily, weekly, monthly, quarterly and yearly VWAP.
Standard deviation bands values can be changed (default values are 0.618, 1, 1.618, 2, 2.618, 3).
Also the previous standard deviation bands can be displayed.

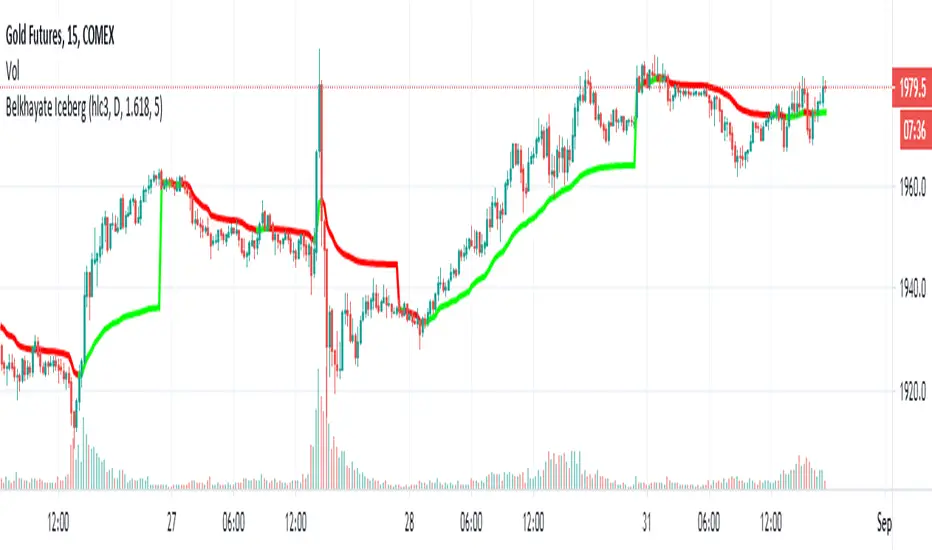
Belkhayate Iceberg - vwapThis is the magical Belkhayate Iceberg indicator that use Daily Vwap
and change the plot color's based on where the candles are located towards vwap.
When the plot is green we only look for buy opportunities
When the plot is red we only look for short opportunities.
According to Belkhayate this indicator tracks algorithmic trading iceberg orders.
Greets to All time best trader of the world Mostafa Belkhayat and Mohammed Amine.
Fibonacci VWAPFibonacci VWAP bands provide extremely accurate pivot points and a visual scale of deviation from VWAP.
Z distance from VWAP Variation (jkf)This is a variation from LazyBear's Z-Distance from VWAP.
I use 3 different timeframes, where shorter term timeframes above longer term signals bullish.
Upper and lower bounds can impact too. Persistently high or low values will null the readings. So watch for that.

Pivots With CPR,Moving Average and VWAP - by AnanthThis indicator is a combination of Pivot points with CPR, Moving Average and VWAP.
