VWAP and MA Crossover SignalsDescription: The VWAP and 20 MA Crossover Indicator is a powerful trading tool designed to capitalize on trend reversals and momentum shifts. This indicator overlays two key technical analysis tools on the price chart: the Volume Weighted Average Price (VWAP) and the 20-period Moving Average (MA).
Functionality:
VWAP: Represents the average price a security has traded at throughout the day, based on volume and price. It is a measure of the market's trend and trading volume.
20 MA: Offers a smoothed average of the closing prices over the last 20 periods, providing a glimpse of the underlying trend.
Signals:
Buy Signal: Generated when the VWAP crosses above the 20-period MA, suggesting an upward momentum and a potential bullish trend reversal.
Sell Signal: This occurs when the VWAP crosses below the 20-period MA, indicating a downward momentum and a potential bearish trend reversal.
Usage: This indicator is ideal for traders focusing on intraday and swing trading strategies, providing clear visual cues for entry and exit points based on the interaction between VWAP and the 20 MA. By identifying key crossover points, traders can make informed decisions about potential bullish or bearish movements in the market.
Application: To use this indicator, simply add it to your TradingView chart setup. The buy and sell signals will be displayed directly on the chart, allowing for easy interpretation and quick action. Adjust the settings to fit your specific trading strategy or market conditions.
Search in scripts for "vwap"

VWAP/EMA50/EMA200We script this one for combining VWAP , EMA50 and EMA200. The tool is fantastic if traders know how VWAP , EMA work? Just adding this script in your favorite and work like charm:
VWAP: How to trade with that
- One of the simplest uses of the VWAP is gauging support and/or resistance.
- A trader who is long a stock can use the VWAP as a target exit if its trading below.
- A stock trading over intraday VWAP may be bullish , while a stock trading under may be bearish .
EMA 50/EMA200: How to trade with that timeframe 50-day or 200-day period
- Identify the trend of market in longterm
- Golden-cross (short term EMA cross above longterm EMA ) is call golden-cross signals. It is opportunity for buying.
- Deal-cross ( short term EMA cross below longterm EMA ) is call dead-cross signals. It is opportunity for selling.
- Identify support levels
- Identify resistance levels
Let me know if you see anything else that should be added/changed.

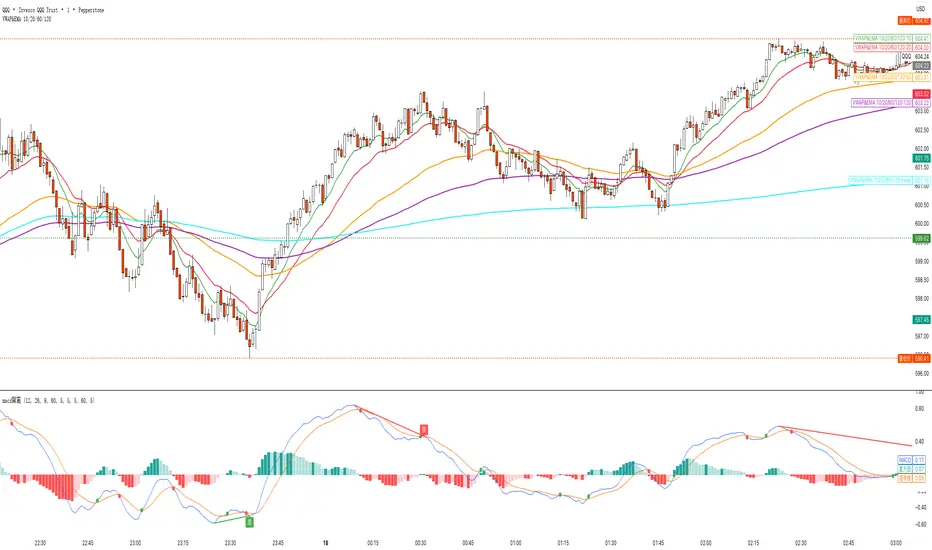
VWAP&EMA 10/20/60/120his script is a clean and straightforward technical analysis tool designed to provide traders with a clear view of market trends and key price levels by overlaying five essential moving averages onto your chart:
Volume Weighted Average Price (VWAP)
Four (4) Exponential Moving Averages (EMAs) at lengths 10, 20, 60, and 120.
By combining these indicators, traders can quickly assess short-term momentum, medium-term trends, and long-term direction, all while referencing the volume-weighted average price as a key benchmark for institutional activity.
Features & Components
This indicator plots five distinct lines on your chart, each color-coded for easy identification:
VWAP (Volume Weighted Average Price)
Plot: Plotted as a bright blue line.
Purpose: The VWAP represents the true average price of an asset for the day (or session), weighted by volume. It is a critical level for many day traders and institutions.
Prices above VWAP are often considered bullish.
Prices below VWAP are often considered bearish.
It frequently acts as a dynamic level of support or resistance.
EMA 10 (Short-Term Momentum)
Plot: Plotted as a green line.
Purpose: This is the fastest-moving average, reflecting the most recent price action and short-term momentum.
EMA 20 (Short-Term Trend)
Plot: Plotted as a red line.
Purpose: Often used in conjunction with the EMA 10, this average helps confirm the immediate trend. Crossovers between the 10 and 20 EMAs can signal potential entry or exit points.
EMA 60 (Medium-Term Trend)
Plot: Plotted as an orange line.
Purpose: This average provides a clearer picture of the medium-term trend, filtering out much of the short-term noise. It often serves as a significant dynamic support or resistance level.
EMA 120 (Long-Term Trend)
Plot: Plotted as a purple line.
Purpose: This is the slowest-moving average in the script, defining the major underlying trend. As long as the price remains above the EMA 120, the long-term bias is generally considered bullish, and vice-versa.
How to Use This Indicator
This indicator is versatile and can be adapted to various trading strategies:
Trend Confirmation: Use the alignment of the EMAs to determine the trend.
Strong Bullish Trend: Price > EMA 10 > EMA 20 > EMA 60 > EMA 120.
Strong Bearish Trend: Price < EMA 10 < EMA 20 < EMA 60 < EMA 120.
Dynamic Support & Resistance: Watch how the price reacts to each of the five lines. In an uptrend, the EMAs and VWAP will often act as "bounces" or support levels for pullbacks. In a downtrend, they will act as resistance.
Entry & Exit Signals (Crossovers):
A bullish crossover (e.g., EMA 10 crossing above EMA 20) can signal buying interest.
A bearish crossover (e.g., EMA 10 crossing below EMA 20) can signal selling pressure.
VWAP Confluence: Pay special attention to areas where an EMA (like the 20 or 60) crosses or travels close to the VWAP. This "confluence" can create a very strong and significant price level. For example, if the price pulls back to the VWAP and also finds support at the EMA 60, it can be a high-probability trade setup.
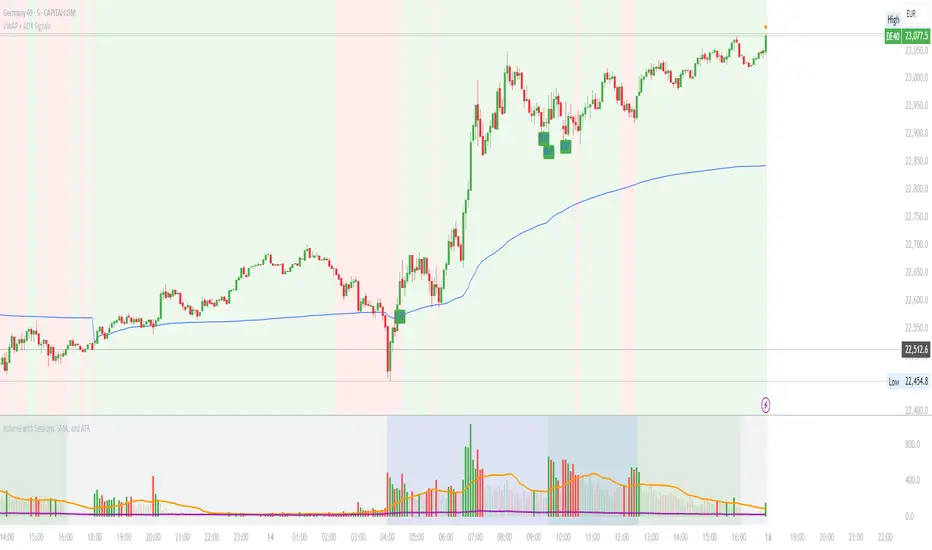
VWAP with ADX Buy/Sell Signals and 50 MA BackgroundThis Pine Script combines several technical indicators to create a comprehensive chart with buy and sell signals based on the ADX and VWAP, as well as background color changes depending on the price relative to the 50-period simple moving average (SMA). Here's a breakdown of what each part of the code does:
1. VWAP Settings
Anchor Period: You can select different periods such as "Session", "Week", "Month", etc. to define the anchor period for the VWAP.
Source: The source for VWAP is set to the typical price (hlc3).
Offset: Allows for shifting the VWAP by a specified amount.
2. ADX Settings
ADX Length: The period used to calculate the ADX.
ADX Smoothing: Used to smooth the ADX for better clarity.
ADX Threshold: Used to filter out weak trends (i.e., signals when ADX > 20).
3. ADX and VWAP Calculation
The ADX values are calculated using ta.dmi(), which returns the +DI, -DI, and ADX lines.
VWAP is calculated using ta.vwap(), based on the selected price source.
4. Buy/Sell Conditions
Buy Signal: A buy signal is generated when:
The +DI crosses above the -DI (indicating an uptrend).
The ADX is above 20 (indicating a strong trend).
The closing price is above the VWAP (indicating bullish market sentiment).
Sell Signal: A sell signal occurs when:
The -DI crosses above the +DI (indicating a downtrend).
The ADX is above 20 (indicating a strong trend).
The closing price is below the VWAP (indicating bearish market sentiment).
5. VWAP Bands
The standard deviation of the price is calculated using ta.stdev(), and the bands are plotted at multiples of the standard deviation (1, 2, and 3).
These bands are used to highlight possible overbought or oversold conditions.
6. 50-period SMA and Background Color
The script calculates a 50-period Simple Moving Average (SMA).
The background color is then changed based on whether the price is above or below the 50-period SMA. If the price is above the SMA, the background is green (bullish), and if it’s below, it’s red (bearish).
7. Plots
The script includes plots for the VWAP line, the ADX and DI lines (optional), and the upper and lower bands.
The buy and sell signals are plotted as shapes with text labels ("BUY" and "SELL") that appear below or above the price bars.
Final Notes:
Band Plots: Three levels of bands (green, olive, teal) are plotted using standard deviation multipliers (1, 2, and 3 times the standard deviation).
Background Color: The background color changes depending on whether the price is above or below the 50 SMA, giving a visual cue for bullish or bearish market conditions.
This indicator aims to offer a multi-faceted view of the market with trend-following signals (via ADX), VWAP for intraday support/resistance, and background coloring to indicate the current trend strength based on the 50 SMA.
VWAP Executor — v6 (VWAP fix)tarek helishPractical scalping plan with high-rate (sometimes reaching 70–85% in a quiet market)
Concept: “VWAP bounce with a clear trend.”
Tools: 1–3-minute chart for entry, 5-minute trend filter, VWAP, EMA(50) on 5M, ATR(14) on 1M, volume.
When to trade: London session or early New York session; avoid 10–15 minutes before/after high-impact news.
Entry rules (buy for example):
Trend: Price is above the EMA(50) on 5M and has an upward trend.
Entry zone: First bounce to VWAP (or a ±1 standard deviation channel around it).
Signal: Bullish rejection/engulfing candle on 1M with increasing volume, and RSI(2) has exited oversold territory (optional).
Order: Entry after the confirmation candle closes or a limit close to VWAP.
Trade Management:
Stop: Below the bounce low or 0.6xATR(1M) (strongest).
Target: 0.4–0.7xATR(1M) or the previous micro-high (small return to increase success rate).
Trigger: Move the stop to breakeven after +0.25R; close manually if the 1M candle closes strongly against you.
Filter: Do not trade if the spread widens, or the price "saws" around VWAP without a trend.
Sell against the rules in a downtrend.
Why this plan raises the heat-rate? You buy a "small discount" within an existing trend and near the institutional average price (VWAP), with a small target price.
مواقعي شركة الماسة للخدمات المنزلية
شركة تنظيف بالرياض
نقل عفش بالرياض

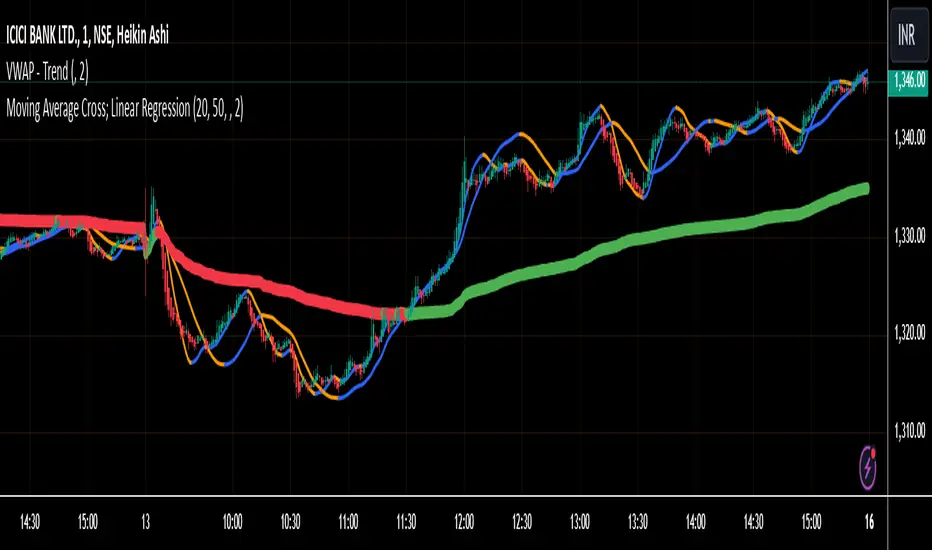
VWAP - TrendThis Pine Script calculates the Volume Weighted Average Price (VWAP) for a specified timeframe and plots its Linear Regression over a user-defined lookback period . The regression line is color-coded: green indicates an uptrend and red indicates a downtrend. The line is broken at the end of each day to prevent it from extending into the next day, ensuring clarity on a daily basis.
Key Features:
VWAP Calculation: The VWAP is calculated based on a selected timeframe, providing a smoothed average price considering volume.
Linear Regression: The script calculates a linear regression of the VWAP over a custom lookback period to capture the underlying trend.
Color-Coding: The regression line is color-coded to easily identify trends—green for an uptrend and red for a downtrend.
Day-End Break: The regression line breaks at the end of each day to prevent continuous plotting across days, which helps keep the analysis focused within daily intervals.
User Inputs: The user can adjust the VWAP timeframe and the linear regression lookback period to tailor the indicator to their preferences.
This script provides a visual representation of the VWAP trend, helping traders identify potential market directions and turning points based on the linear regression of the VWAP.
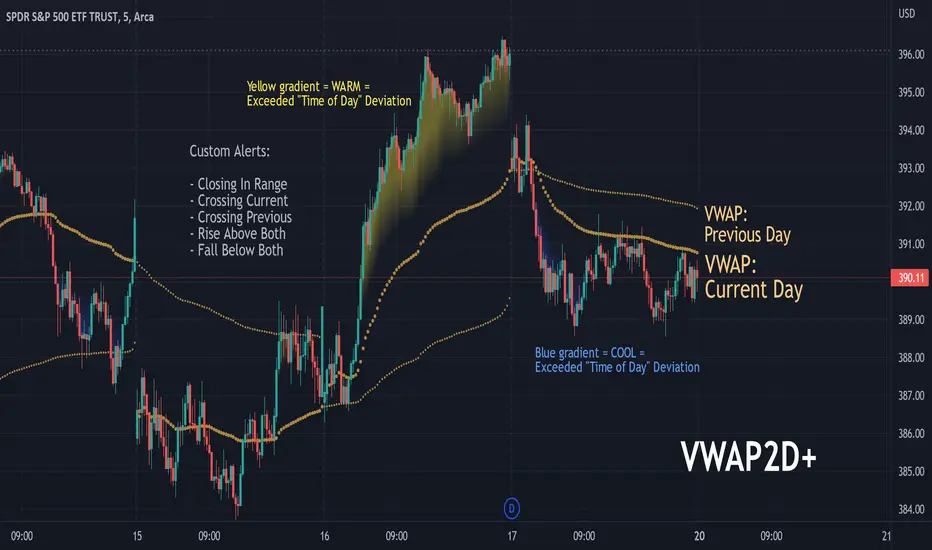
VWAP2D+Displays the current and previous days' VWAP. A useful tool for intraday VWAP traders or to optimize longer term entries or exits.
Features:
Shows levels exceeding the average deviation for the time of day as either warm or cool gradients.
Custom alerts including "Closing In Range" which uses the ATR to determine if the closing value in in the vicinity of the current day's VWAP.
Volume Weighted Average PriceThis indicator provides an implementation of the Volume Weighted Average Price (VWAP), extended with layered standard deviation bands that decompose total market volatility relative to the VWAP anchor period.
Key Features:
Volatility Decomposition: The indicator's primary feature is its ability to separate volatility, controlled by the 'Estimate Bar Statistics' option.
Standard Mode (Estimate Bar Statistics = OFF): Plots a single set of bands representing the standard deviation of the Source price relative to the VWAP.
Decomposition Mode (Estimate Bar Statistics = ON): The indicator uses a statistical model ('Estimator') to calculate within-bar volatility. (Assumption: In this mode, the Source input is ignored, and an estimated mean for each bar is used instead). This mode displays two sets of bands:
Inner Bands: Show only the contribution of the 'between-bar' volatility.
Outer Bands: Show the total volatility (the sum of between-bar and within-bar components).
Periodic & Customizable Anchor: The VWAP calculation is session-based and resets at the beginning of a new period. The anchor timeframe (Anchor Timeframe) can be detected automatically (e.g., 'Session', 'Week') or specified manually.
Weighting Mechanism: The indicator has two levels of weighting:
The baseline is always a VWAP (Volume-Weighted Average Price).
The Volume weighted input additionally applies volume weighting to the volatility (standard deviation) calculation for the bands.
Multi-Timeframe (MTF) Engine: The indicator includes an MTF conversion block. When a Higher Timeframe (HTF) is selected, advanced options become available: Fill Gaps handles data gaps, and Wait for timeframe to close prevents repainting by ensuring the indicator only updates when the HTF bar closes.
Integrated Alerts: Includes a full set of built-in alerts for the source price crossing over or under the central VWAP line and the outermost calculated volatility band.
DISCLAIMER
For Informational/Educational Use Only: This indicator is provided for informational and educational purposes only. It does not constitute financial, investment, or trading advice, nor is it a recommendation to buy or sell any asset.
Use at Your Own Risk: All trading decisions you make based on the information or signals generated by this indicator are made solely at your own risk.
No Guarantee of Performance: Past performance is not an indicator of future results. The author makes no guarantee regarding the accuracy of the signals or future profitability.
No Liability: The author shall not be held liable for any financial losses or damages incurred directly or indirectly from the use of this indicator.
Signals Are Not Recommendations: The alerts and visual signals (e.g., crossovers) generated by this tool are not direct recommendations to buy or sell. They are technical observations for your own analysis and consideration.

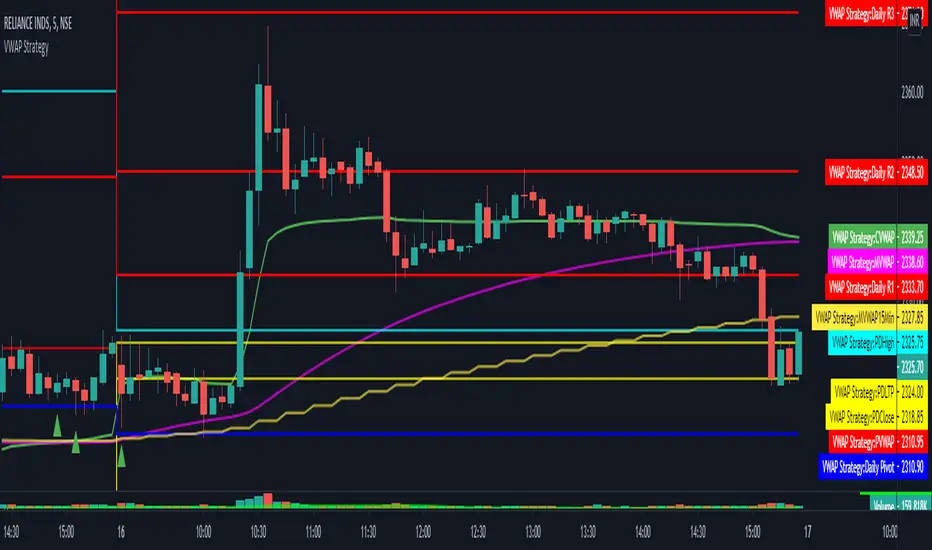
VWAP Strategy by RPThis scrip will help to trade with VWAP strategy.
This is build with following components:
VWAP (Volume Weighted Average Price)
MVWAP (Moving Average of VWAP of 50 period by Default)
Previous Day VWAP.
Pivot Points.
Previous Day High.
Previous Day Low.
Previous Day Close.
For multi time frame analysis this indicator will indicate 15 minutes MVWAP (50 period) in any timeframe chosen by the user.
This will also indicate crossover and crossunder of VWAP over MVWAP, which will help in deciding BUY/SELL.
Hope this helps trader community.
Thanks. Please post your feedback.
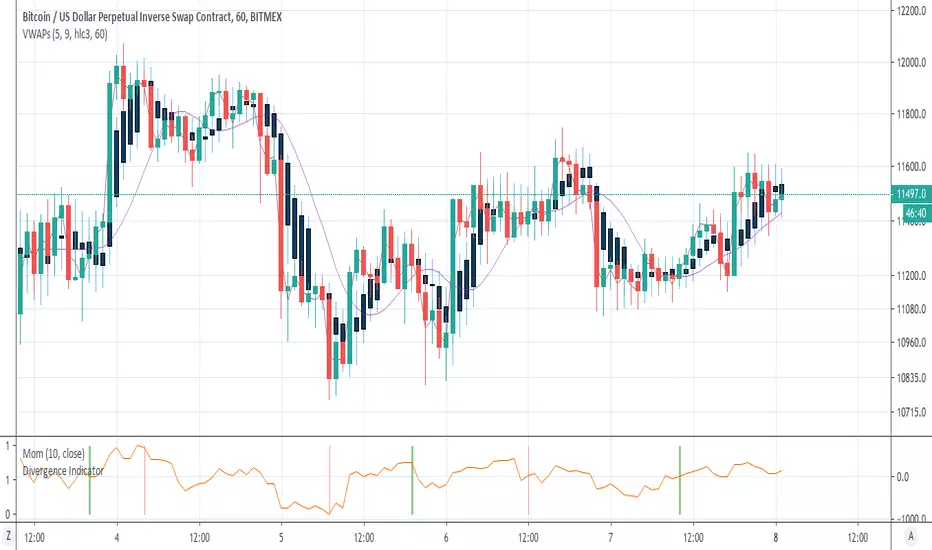
VWAP Candles & MVWAPI was getting sick of the useless VWAP indicator on Trading View and wrote something that is more comprehensive and quite interesting, in fact: candles for VWAP.
It uses the original open/high/low/close and combines them as you would the original hlc3 calculation, but separately, to draw the candles as a shadow of the current price.
There are a few parameters to make it more flexible: source, resolution timeframe, volume length, and moving average length.
Volume Length (default: 5) will determine the candle calculations, cumulative sum of the past X bars.
Moving Average Length (default: 9) will determine the simple moving average (sma) length for the true VWAP (hlc3*volume/cumulative volume)
Source will change the Moving Average VWAP from hlc3 to whatever you want.
Resolution will attune the candles and Moving Average VWAP line to a different periodicity.
Just to be a pain, I also included the old VWAP from Trading View, as a comparison. You can disable it from the Style settings.
Enjoy and happy trading!
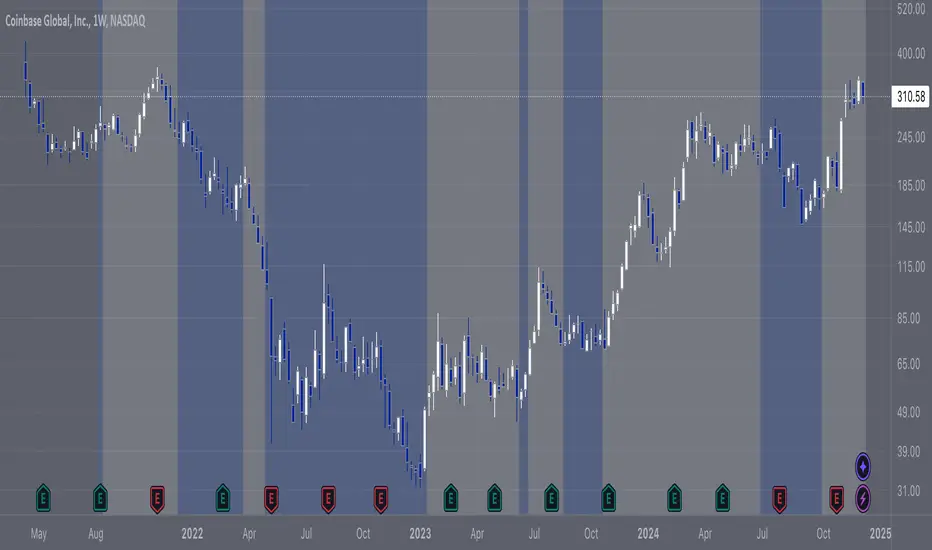
COIN/BTC Trend OscillatorThe COIN/BTC Trend Oscillator is a versatile tool designed to measure and visualize momentum divergences between Coinbase stock ( NASDAQ:COIN ) and Bitcoin ( CRYPTOCAP:BTC ). It helps identify overbought and oversold conditions, while also highlighting potential trend reversals.
Key Features:
VWAP-Based Divergence Analysis:
• Tracks the difference between NASDAQ:COIN and CRYPTOCAP:BTC relative to their respective VWAPs.
• Highlights shifts in momentum between the two assets.
Normalized Oscillator:
• Uses ATR normalization to adapt to different volatility conditions.
• Displays momentum shifts on a standardized scale for better comparability.
Overbought and Oversold Conditions:
• Identifies extremes using customizable thresholds (default: ±80).
• Dynamic background colors for quick visual identification:
• Blue for overbought zones (potential sell).
• White for oversold zones (potential buy).
Rolling Highs and Lows Detection:
• Tracks turning points in the oscillator to identify possible trend reversals.
• Useful for spotting exhaustion or accumulation phases.
Use Case:
This indicator is ideal for trading Coinbase stock relative to Bitcoin’s momentum. It’s especially useful during strong market trends, helping traders time entries and exits based on extremes in relative performance.
Limitations:
• Performance may degrade in choppy or sideways markets.
• Assumes a strong correlation between NASDAQ:COIN and CRYPTOCAP:BTC , which may not hold during independent events.
Pro Tip: Use this oscillator with broader trend confirmation tools like moving averages or RSI to improve reliability. For macro strategies, consider combining with higher timeframes for alignment.
Volume Weighted Average Price @Marx_CapitalSimple VWAP indicator edited to not connect the lines between sessions for a cleaner look without vertical lines at session ends.
Session end and start times are customizable.

VWAP, AVWAP and MVWAP - Omkar BanneThis indicator plots the VWAP, MVWAP and Anchored VWAP.
AVWAP: Anchored VWAP sometimes doesn't work the way it should. In such times, trades can use the default AVWAP on the right ribbon.
MVWAP: Moving average length can be changed; the default is 10.

Volume Weighted Average Range Bands [DW]This is an experimental study designed to identify the underlying trend bias and volatility of an instrument over any custom interval TradingView supports.
First, reset points are established at points where the opening price of the interval changes.
Next, Volume Weighted Average Price (VWAP) is calculated. It is the cumulative sum of typical price times volume divided by the cumulative volume. The cumulation starts over upon each reset point.
After that, Volume Weighted Average Range (VWAR) is calculated. The formula structure is the same as VWAP, except using range rather than typical price.
Lastly, the bands are calculated by multiplying the VWAR by the specified multiplier (approximate Golden Ratio by default) and by 1 through 5, then adding to and subtracting from the VWAP.
Custom Bar Colors are included.

VWAP Diario + VWAP 08:00-12:00 (sin fantasmas) con colorDos vwap. Uno desde el principio del dia. y otro desde las 8 am

VWAP + Candle-Rating SELL (close, robust)This multi‐timeframe setup first scans the 15-minute chart for strong bearish candles (body position in the bottom 40% of their range, i.e. rating 4 or 5) that close below the session VWAP. When it finds the first such “setup” of a trading period, it pins the low of that 15-minute candle as a trigger level and draws a persistent red line there. On the 5-minute chart, the strategy then waits for a similarly strong bearish candle (rating 4 or 5) to close below that marked low—at which point it emits a one‐time SELL signal. The trigger level remains in place (and additional sell signals are locked out) until the market “rescues” the price: a 15-minute bullish candle (rating 1 or 2) closing back above VWAP clears the old setup and allows the next valid bearish 15-minute candle to form a new trigger. This design ensures you only trade the most significant breakdowns after a clear bearish bias and avoids repeated signals until a genuine bullish reversal resets the system.

Key Levels// How it Works \\
Calculating Previous Days, Weeks and Monthly open, high, low, close and vwaps
Plots these levels on your chart
// Settings \\
You can enable/disable any of the levels you want to see
You can also change the amount of bars back the levels are plotted back to
// Use Case \\
These levels are often used in different methods of Technical analysis for support and resistance.
// Suggestions \\
Happy for anyone to make any suggestions on changes which could improve the script,
// Terms \\
Feel free to use the script, If you do use the script could you please just tag me as I am interested to see how people are using it. Good Luck!

Rolling EMAVWAP with Standard Deviation BandsThis is experimental code trying to implement exponentially decreasing weights over time in a simple VWAP.
Also i applied EMA rules when calculating the Standard Deviation Bands.
The script produces results from 1 candle.
There is an "log space" option to neutralize bands shifts when charting in log space - this gives the correct geometrically equal distances on both sides of the emaVWAP.

VWAP + RVOL (Merged):
📊 VWAP + RVOL (Merged)
VWAP + RVOL (Merged) is a professional intraday trading indicator that combines:
Session VWAP to define institutional direction and fair value
True Intraday Relative Volume (RVOL) to measure real-time volume strength compared to the same minute over previous days
The script is specifically designed for U.S. equities and performs best in:
Premarket momentum
Opening Range Breakout (ORB)
VWAP pullbacks
Scalping & day trading
🔍 What does this indicator provide?
1️⃣ True Intraday RVOL
Calculates minute-accurate relative volume, comparing current volume to the same minute across a user-defined number of prior days
Correctly handles sessions crossing midnight (after-hours & premarket)
Displays RVOL in a separate pane for clean, noise-free analysis
Default RVOL reference levels:
0.5 → Weak volume
1.0 → Normal volume
1.5 → Strong volume
2.0 → Unusual / institutional activity
2️⃣ Session VWAP
True session-based VWAP
Identifies institutional fair value
Acts as a primary directional filter:
Above VWAP → Bullish bias
Below VWAP → Bearish bias
✅ Practical Trading Use
Long Setup:
Price above VWAP
RVOL ≥ 1.5
Light pullback or VWAP retest
Confirmation candle with increasing volume
Avoid trades when:
Price below VWAP
RVOL < 1.0
⚙️ Settings
RVOL Lookback Days – Number of days used for RVOL comparison (default: 5)
RVOL Reference Lines – Toggle RVOL levels on/off
VWAP Source – Price source for VWAP calculation
Hide VWAP on 1D+ – Optional VWAP hiding on higher timeframes
📌 Important Notes
Designed for intraday timeframes only (≥ 1 minute and < 1 day)
Requires volume data from the data provider
Not intended for daily or higher timeframes
🎯 Who is this indicator for?
Momentum traders
Day traders & scalpers
ORB and VWAP pullback strategies
Traders seeking volume confirmation before entry
⚠️ Disclaimer
This indicator is a decision-support tool, not a trading recommendation.
Always apply proper risk management.

VWAP Supply & Demand Zones PRO**Overview:**
This script represents a major evolution of the original "VWAP Supply and Demand Zones" indicator. Initially created to explore price interaction with VWAP, it has now matured into a robust and feature-rich tool for identifying high-probability zones of institutional buying and selling pressure. The update introduces volume and momentum validation, dynamic zone management, alert logic, and a visual dashboard (HUD) — all designed for improved precision and clarity. The structural improvements, anti-repainting logic, and significant added utility warranted releasing this as a new script rather than a minor update.
---
### What It Does:
This indicator dynamically detects **supply and demand zones** using VWAP-based logic combined with **volume** and **momentum confirmation**. When price crosses VWAP with strength, it identifies the potential zone of excess demand (below VWAP) or supply (above VWAP), marking it visually with colored regions on the chart.
Each zone is extended for a user-defined duration, monitored for touch interactions (tests), and tracked for possible breaks. The script helps traders interpret price behavior around these institutional zones as either **reversal** opportunities or **continuation** confirmation depending on context and strategy preference.
---
### How It Works:
* **VWAP Basis**: Zones are anchored at VWAP at the time of a significant cross.
* **Volume & Momentum Filters**: Crosses are only considered valid if backed by above-average volume and notable price momentum.
* **Zone Drawing**: Validated supply and demand zones are drawn as boxes on the chart. Each is extended forward for a customizable number of bars.
* **Touch Counting**: Zones track the number of price touches. Alerts are issued after a user-defined number of tests.
* **Break Detection**: If price closes significantly beyond a zone boundary, the zone is marked as broken and visually dimmed.
* **Visual Dashboard (HUD)**: A compact real-time HUD displays VWAP value, active zone counts, and current market bias.
---
### How to Use It:
**Reversal Trading:**
* Look for price **rejecting** a zone after touching it.
* Use rejection candles or secondary indicators (e.g., RSI divergence) to confirm.
* These setups may offer low-risk entries when price respects the zone.
**Continuation Trading:**
* A **break of a zone** suggests strong directional bias.
* Use confirmed zone breaks to enter in the direction of momentum.
* Ideal in trending environments, especially with high volume and ATR movement.
---
### Key Inputs:
* **VWAP Length**: Moving VWAP period (default: 20)
* **Zone Width %**: Percentage size of zone buffer (default: 0.5%)
* **Min Touches**: How many times price must test a zone before alerts trigger
* **Zone Extension**: How far into the future zones are projected
* **Volume & ATR Filters**: Ensure only strong, valid crossovers create zones
---
### Alerts:
You can enable alerts for:
* **New zone creation**
* **Zone tests (after minimum touch count)**
* **Zone breaks**
* **VWAP crosses**
* **Active presence inside a zone (entry conditions)**
These alerts help automate market monitoring, making it suitable for discretionary or systematic workflows.
---
### Why It's a New Script:
This is not a cosmetic update. The internal logic, signal generation, filtering methodology, visual engine, and UX framework have been entirely rebuilt from the ground up. The result is a highly adaptive, precision-oriented tool — appropriate for intraday scalpers and swing traders alike. It goes far beyond the original in terms of functionality and reliability, justifying a fresh release.
---
### Suitable Markets and Timeframes:
* Works across all liquid markets (crypto, equities, futures, forex)
* Best used on timeframes where volume data is stable (5m and above recommended)
* Recalibrate inputs for optimal detection across instruments

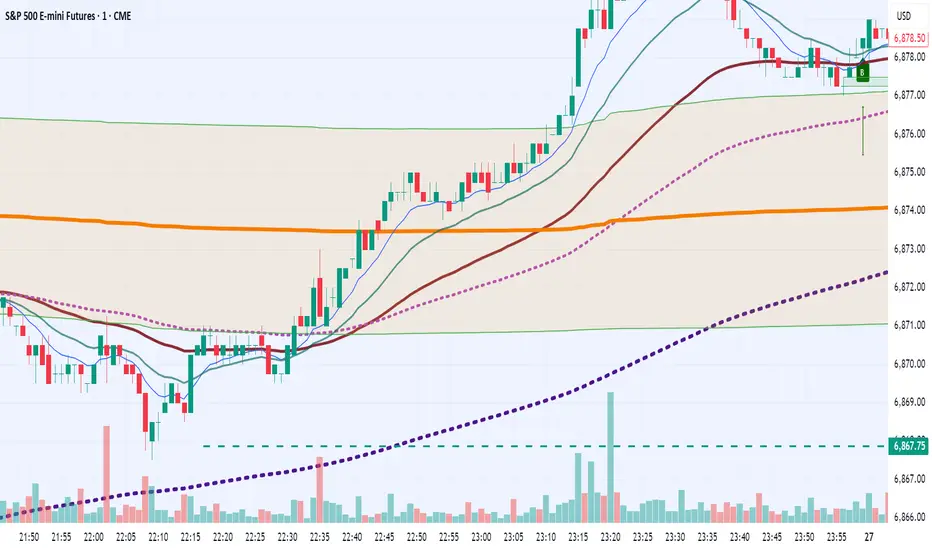
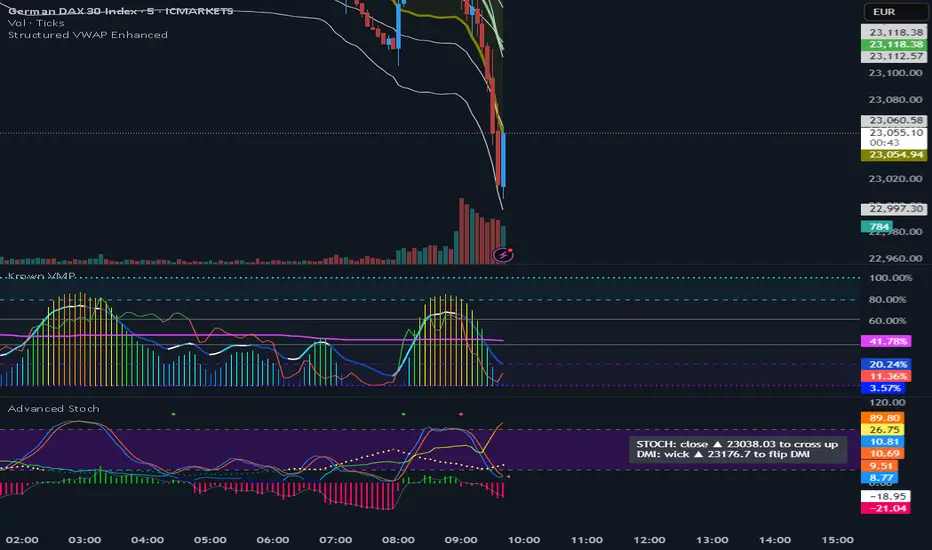
VWAP (Enhanced)Structured VWAP Enhanced
A dynamic, multi-functional VWAP indicator designed to help traders visualize key support and resistance levels during the trading session. This indicator computes the Volume Weighted Average Price (VWAP) along with two structured bands derived from customizable multipliers based on either standard deviation or percentage. In addition, it offers the following features:
Dual Bands: Displays two bands (Band #1 and Band #2) that adapt to market volatility, each with its own customizable multiplier.
Dynamic Midlines: Plots both the original midlines (the center of each band) and enhanced midlines between the VWAP and each band edge for clearer visual cues.
Fixed Offset Bands: Includes offset lines set at a fixed 0.25% above and below the VWAP and each band level to help highlight near-term price targets.
Custom VWAP Anchoring: Supports various anchoring periods (Session, Week, Month, etc.) and special events (Earnings, Dividends, Splits) to reset VWAP calculations, making it adaptable to different trading styles.
Visual Customization: Easily toggle the display of each component (bands, midlines, enhanced midlines, and offset lines) to suit your analysis needs.
Whether you are an intraday trader or a longer-term market participant, Structured VWAP Enhanced provides a robust framework to identify price imbalances and potential turning points throughout your trading day.
Add this indicator to your chart for a comprehensive view of VWAP dynamics and structured market levels.
VWAP Bands with ML [CryptoSea]VWAP Machine Learning Bands is an advanced indicator designed to enhance trading analysis by integrating VWAP with a machine learning-inspired adaptive smoothing approach. This tool helps traders identify trend-based support and resistance zones, predict potential price movements, and generate dynamic trade signals.
Key Features
Adaptive ML VWAP Calculation: Uses a dynamically adjusted SMA-based VWAP model with volatility sensitivity for improved trend analysis.
Forecasting Mechanism: The 'Forecast' parameter shifts the ML output forward, providing predictive insights into potential price movements.
Volatility-Based Band Adjustments: The 'Sigma' parameter fine-tunes the impact of volatility on ML smoothing, adapting to market conditions.
Multi-Tier Standard Deviation Bands: Includes two levels of bands to define potential breakout or mean-reversion zones.
Dynamic Trend-Based Colouring: The VWAP and ML lines change colour based on their relative positions, visually indicating bullish and bearish conditions.
Custom Signal Detection Modes: Allows traders to choose between signals from Band 1, Band 2, or both, for more tailored trade setups.
In the image below, you can see an example of the bands on higher timeframe showing good mean reversion signal opportunities, these tend to work better in ranging markets rather than strong trending ones.
How It Works
VWAP & ML Integration: The script computes VWAP and applies a machine learning-inspired adjustment using SMA smoothing and volatility-based adaptation.
Forecasting Impact: The 'Forecast' setting shifts the ML output forward in time, allowing for anticipatory trend analysis.
Volatility Scaling (Sigma): Adjusts the ML smoothing sensitivity based on market volatility, providing more responsive or stable trend lines.
Trend Confirmation via Colouring: The VWAP line dynamically switches colour depending on whether it is above or below the ML output.
Multi-Level Band Analysis: Two standard deviation-based bands provide a framework for identifying breakouts, trend reversals, or continuation patterns.
In the example below, we can see some of the most reliable signals where we have mean reversion signals from the band whilst the price is also pulling back into the VWAP, these signals have the additional confluence which can give you a higher probabilty move.
Alerts
Bullish Signal Band 1: Alerts when the price crosses above the lower ML Band 1.
Bearish Signal Band 1: Alerts when the price crosses below the upper ML Band 1.
Bullish Signal Band 2: Alerts when the price crosses above the lower ML Band 2.
Bearish Signal Band 2: Alerts when the price crosses below the upper ML Band 2.
Filtered Bullish Signal: Alerts when a bullish signal is triggered based on the selected signal detection mode.
Filtered Bearish Signal: Alerts when a bearish signal is triggered based on the selected signal detection mode.
Application
Trend & Momentum Analysis: Helps traders identify key market trends and potential momentum shifts.
Dynamic Support & Resistance: Standard deviation bands serve as adaptive price zones for potential breakouts or reversals.
Enhanced Trade Signal Confirmation: The integration of ML smoothing with VWAP provides clearer entry and exit signals.
Customizable Risk Management: Allows users to adjust parameters for fine-tuned signal detection, aligning with their trading strategy.
The VWAP Machine Learning Bands indicator offers traders an innovative tool to improve market entries, recognize potential reversals, and enhance trend analysis with intelligent data-driven signals.
