Wave Trend OscillatorThis is a very standard version of the Wave Trend Oscillator.
The Channel and Average values are displayed as lines, most people display them as areas.
The Channel and Average difference is displayed as a histogram, most people display it as a tiny noisy area.
I was unable to find a standard version of the Wave Trend Oscillator.
The colorful hyped up versions of this indicator made me feel like a clown while using them.
I have essentially copied the style of the MACD with this indicator, to keep things professional.
With this WTO, you can change the timeframe and source.
You can also change the histogram average length and multiplier, making it usable.
The typical way that people display the histogram is completely unusable and just for appearance.
Now it does a decent job showing when the momentum of the WTO's downward movement is slowing down, just like how the MACD histogram works.
This indicator is essentially a normalized MACD, though they are calculated differently.
The Wave Trend Oscillator is useful for spotting/monitoring changed in mid-trend momentum.
In my experience, divergence in this indicator is a strong signal.
If the MACD is too slow for you, then this is a great alternative; without all the extra fluff people usually add to it.
Search in scripts for "wave trend"

Wave Trend With Signals [ChuckBanger]A wave trend script based on LazyBears script but with added signals and a histogram...
Wave Trend -V2Wave Trend -V2 is here to give you a serious edge.
This upgraded version of the popular LazyBear script takes wave trend analysis to the next level.
Here's the deal:
Multi-Timeframe Analysis: Beyond Short-Term Noise:
Novice traders often focus solely on the current timeframe (let's say, the 5-minute chart).
Wave Trend -V2 breaks free from this limitation by analyzing price action across multiple timeframes (1-minute to 1-week).
---This holistic view helps you:
Identify larger trends: Are we in a bullish uptrend on the daily chart, even if the hourly chart is showing some short-term weakness? Wave Trend -V2 helps you see the bigger picture.
Avoid false breakouts: Short-term price spikes can create false signals. By looking at higher timeframes, you can filter out these "noise" and focus on sustainable trends.
---Pressure Analysis: Gauging Market Strength:
Wave Trend -V2 goes beyond simple trend identification.
It incorporates "pressure" analysis to gauge the strength and direction of the current market trend.
This helps you:
Enter trades with confidence: When the trend is strong and the pressure is high, you can enter trades with greater conviction.
Minimize risk: If the pressure is waning or conflicting signals arise, you can avoid entering trades or adjust your risk parameters accordingly.
Impact Point Analysis: Predicting Future Price Moves:
Wave Trend -V2 analyzes the price impact of the last four wave trend crossovers.
Let's say the last impact point was "X", the previous one "X-1", the one before that "X-2", and so on.
The indicator calculates the average price movement between these points using the following simplified formula:
Average Impact = (X - X-1) + (X-1 - X-2) + (X-2 - X-3) / 3
This average provides a valuable estimate of the potential price movement of the next crossover.
Multiple Take Profit Levels: Setting Strategic Targets:
Wave Trend -V2 offers three dynamic take profit levels (TP1, TP2, TP3).
TP1: Based on the estimated average impact.
TP2: Twice the estimated average impact.
TP3: Three times the estimated average impact.
This allows you to set your profit targets strategically, maximizing potential gains while managing risk effectively.
Why don't use the Estmated impact point to stop the trade?
In order to eliminated the WHIPSAW effect! There is no other way...
Wave Trend -V2 is designed for traders who seek a deeper understanding of trend dynamics and desire a more sophisticated approach to trading. By combining multi-timeframe analysis, pressure assessment, and advanced impact point calculations, this indicator empowers you to make more informed trading decisions and potentially improve your trading outcomes.
The indicator work best with combination of other trend type indicators.
Please dont forget that indicators are not miracle medicines , it cannot give you exact results , market was always volative , use at your own discretion.
Wave Trend w/ VWMA overlayThis is a trend-following strategy and indicator which combines the Wave Trend Strategy (Lazy Bear) by thomas.gigure with the cRSI + Waves Strategy with VWMA overlay by Dr_Roboto .
You may update the parameters of the Wave Trend oscillator or the VWMA indicator to match your own preferences. You may also adjust the Base Quantity used for determining trade size (as described below) to suit your account size and risk tolerance.
The strategy identifies potential signals based on the on the Wave Trend oscillator, originally ported to TradingView by LazyBear. When a signal is produced by the Wave Trend oscillator, trade size is determined by the VWMA.
When the VWMA is trending against the direction of the Wave Trend signal, Base Quantity x 1 is used
When the VWMA is trending neutral, Base Quantity x 2 is used
When the VWMA is trending with the direction of the Wave Trend signal, Base Quantity x 4 is used
The strategy includes the ability to limit trade signals to certain defined periods of time ("Sessions") during the trading day and, optionally, to close any open position at the end of either or both "Sessions." This may be enabled/disabled via the Limit Signals to Trading Sessions? option on the "Inputs" tab of the strategy's "Settings" window.
If you are trading on a daily chart (or longer) you must disable the Limit Signals to Trading Sessions? in order for the strategy to produce signals.

Wave TrendThe Wave Trend indicator is based on the Mason’s Line Indicator.
This indicator is a sentiment analysis tool designed to help traders understand and analyze market trends. It works by calculating the average investor satisfaction of a group of investors. The results are displayed as colored squares at the bottom of the chart. For more information, read the description of the Mason's Line Indicator.
This indicator is not developed for use on short timeframes. It is an indicator that is best suited for longer timeframes, ideal for swing trading or long-term trading.
There are two main display parameters:
Display the coloured squares according to the distance to the sma (default value).
Display the squares according to the position of satisfaction in relation to the scale of the indicator.
there are two secondary settings for each of these options:
Display the squares by normalizing the values of the dataset between 0 and 1.
Display the squares without normalizing the value of the dataset between 0 and 1 (default value).
Please note that the Wave Trend Indicator is not a guarantee of future market performance and should be used in conjunction with proper risk management. Always ensure that you have a thorough understanding of the indicator’s methodology and its limitations before making any investment decisions. Additionally, past performance is not indicative of future results.

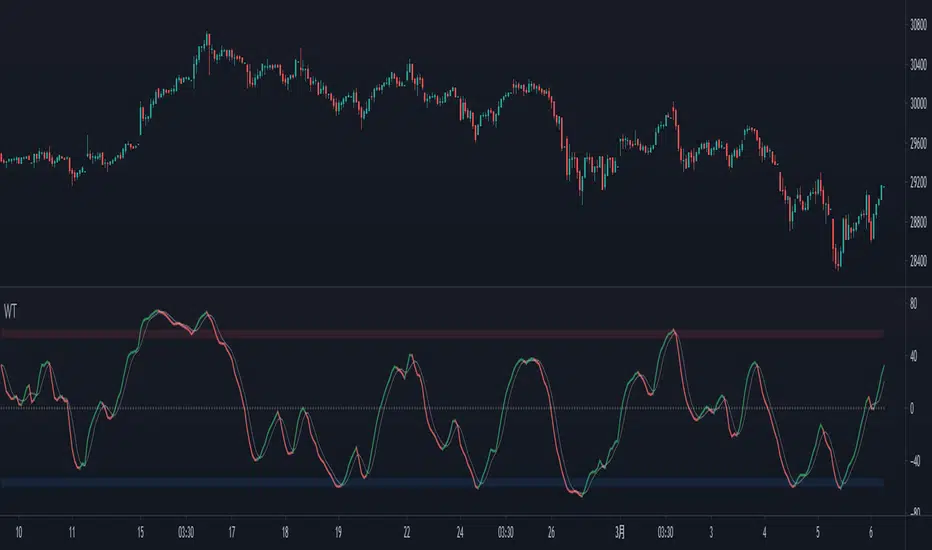
Simple Wave Trend Wave Trend Oscillator with minimal functionality.
- Change color by crossing
- Overboughtr and Oversold band
- Zero line
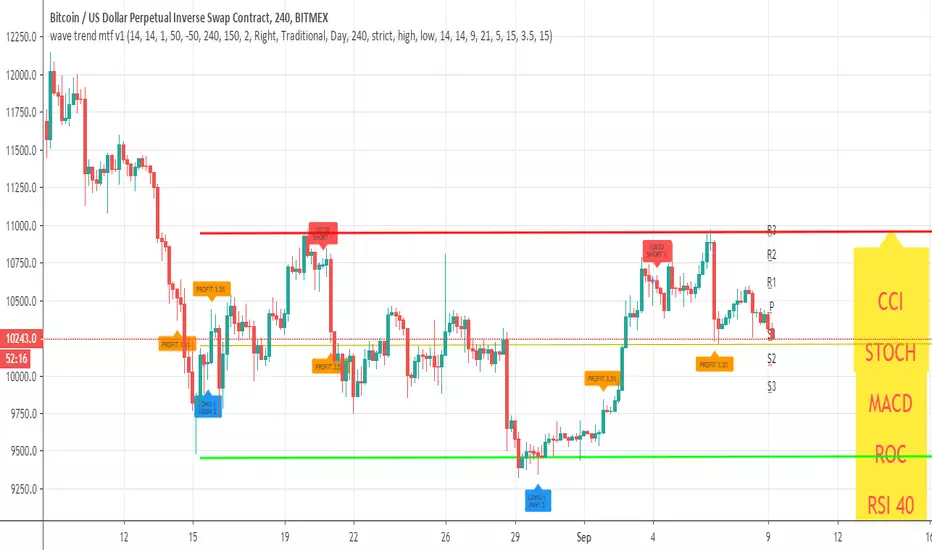
wave trend mtf v1This Lazy Bear wave trend in MTF version with take profit and stop loss rebuy
you can change the MTF using the security call
and many nice option to see insid3e
so you can play with it, modify it or make it better
Volume Wave Trend ConfirmationUtility of the Indicator
The core utility of this indicator lies in its ability to utilize volume, a less frequently exploited metric in MACD analysis, providing several strategic advantages:
Trend Confirmation: By focusing on volume, the indicator confirms whether movements in price are backed by significant trading activity. A rising MACD line above the signal line, paired with increasing volume, can confirm the strength of an uptrend. Conversely, if the histogram turns negative while the MACD line falls below the signal line during a price drop, it confirms a robust downtrend.
Early Warning Signals: Changes in the histogram and divergences between the MACD and Signal lines can serve as early warnings of potential reversals or slowdowns in market momentum. For instance, a shrinking histogram in an uptrend might suggest that the upward movement is losing steam.
Market Sentiment: The integration of volume into the MACD framework allows the indicator to provide insights into underlying market sentiment. Higher volumes during price movements indicate stronger conviction among traders, making the trend more reliable.
Indicator Functionality
The "Volume Wave Trend Confirmation" indicator is built on the Moving Average Convergence Divergence (MACD) framework, but with a unique twist: it uses the smoothed moving averages (SMA) of trading volumes instead of price. The indicator calculates two specific SMAs of the volume — a shorter 33-period SMA and a longer 100-period SMA — and computes their difference. This difference is then used as the input for the MACD calculation, with typical parameters set at 12, 26, and a signal line of 9.
MACD Line (Blue): Represents the main line, calculated as the difference between the 12-period and 26-period exponential moving averages (EMA) of the volume difference.
Signal Line (Orange): A 9-period EMA of the MACD line, acting as a trigger for buy or sell signals.
Histogram (Blue/Purple): Measures the distance between the MACD line and the Signal line, colored blue when positive (above the Signal line) and purple when negative (below the Signal line).

SSL + Wave Trend StrategyStrategy incorporates the following features:
Risk management:
Configurable X% loss per stop loss
Configurable R:R ratio
Trade entry:
Based on strategy conditions below
Trade exit:
Based on strategy conditions below
Backtesting:
Configurable backtesting range by date
Trade drawings:
Each entry condition indicator can be turned on and off
TP/SL boxes drawn for all trades. Can be turned on and off
Trade exit information labels. Can be turned on and off
NOTE: Trade drawings will only be applicable when using overlay strategies
Alerting:
Alerts on LONG and SHORT trade entries
Debugging:
Includes section with useful debugging techniques
Strategy conditions
Trade entry:
LONG
C1: SSL Hybrid baseline is BLUE
C2: SSL Channel crosses up (green above red)
C3: Wave Trend crosses up (represented by pink candle body)
C4: Entry candle height is not greater than configured threshold
C5: Entry candle is inside Keltner Channel (wicks or body depending on configuration)
C6: Take Profit target does not touch EMA (represents resistance)
SHORT
C1: SSL Hybrid baseline is RED
C2: SSL Channel crosses down (red above green)
C3: Wave Trend crosses down (represented by orange candle body)
C4: Entry candle height is not greater than configured threshold
C5: Entry candle is inside Keltner Channel (wicks or body depending on configuration)
C6: Take Profit target does not touch EMA (represents support)
Trade exit:
Stop Loss: Size configurable with NNFX ATR multiplier
Take Profit: Calculated from Stop Loss using R:R ratio
Credits
Strategy is based on the YouTube video "This Unique Strategy Made 47% Profit in 2.5 Months " by TradeSmart.
It combines the following indicators to determine trade entry/exit conditions:
Wave Trend: Indicator: WaveTrend Oscillator by @LazyBear
SSL Channel: SSL channel by @ErwinBeckers
SSL Hybrid: SSL Hybrid by @Mihkel00
Keltner Channels: Keltner Channels Bands by @ceyhun
Candle Height: Candle Height in Percentage - Columns by @FreeReveller
NNFX ATR: NNFX ATR by @sueun123

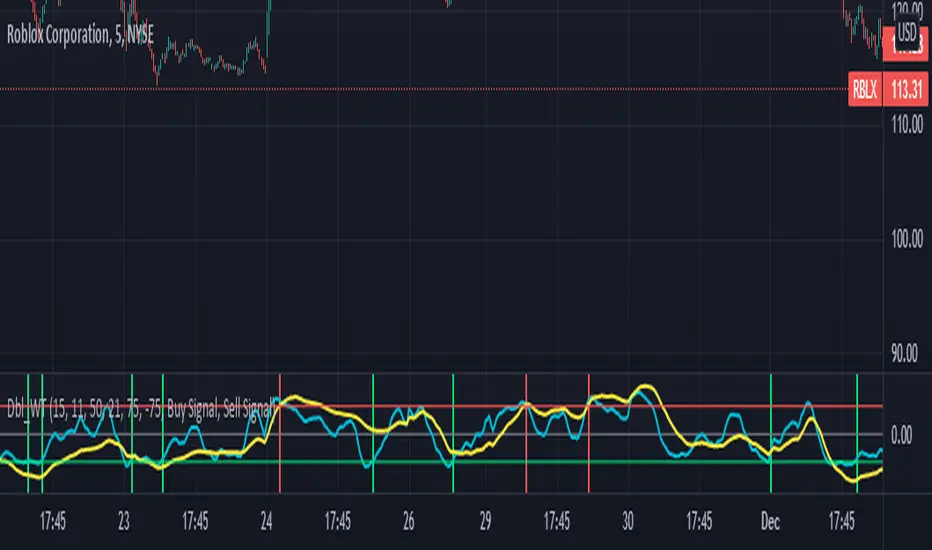
Double wave-trend Oscillator Buy/Sell signalsBINANCE:ROSEUSDT
This script attempts to use Wave Trend Oscillator's of different lengths in order to identify trade entries and exits for bullish trades. This indicator is strongly recommended to be used with volatile assets or on large time interval charts. You use this script by entering a trade when it signals a green block and exiting when it signals red although these signals could potentially be used as trend reversal signals instead. The script uses two wave trend oscillator's the lengths of which can be edited in the settings, but the general idea is that one is fast and one is slow and these indicate when to buy/sell when they crossover the overbought/sold lines. In the setting you can choose whether the fast or the slow line will be used for buy signal and the other is then used to signal selling. By default this will be ticked on indicating that the fast line crossing over the oversold level will be used for buy signals, if it is ticked off the slow line will be used. The other tickbox is for whether the line used for selling will signal when it first crosses over the overbought line or whether it should signal then it crosses back under the overbought line after having crossed over it, the default value is off indicating that it will signal when it crosses back under the overbought level. The overbought/sold levels should be tweaked on a per asset basis to get the best quality signals.
The original code for the Wave Trend Oscillator comes from LazyBear and was modified and built on to create this indicator.
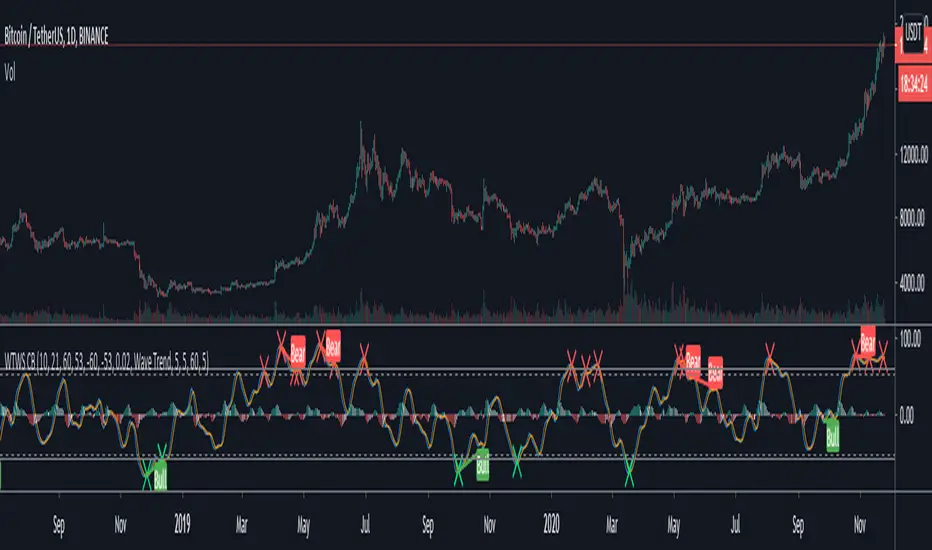
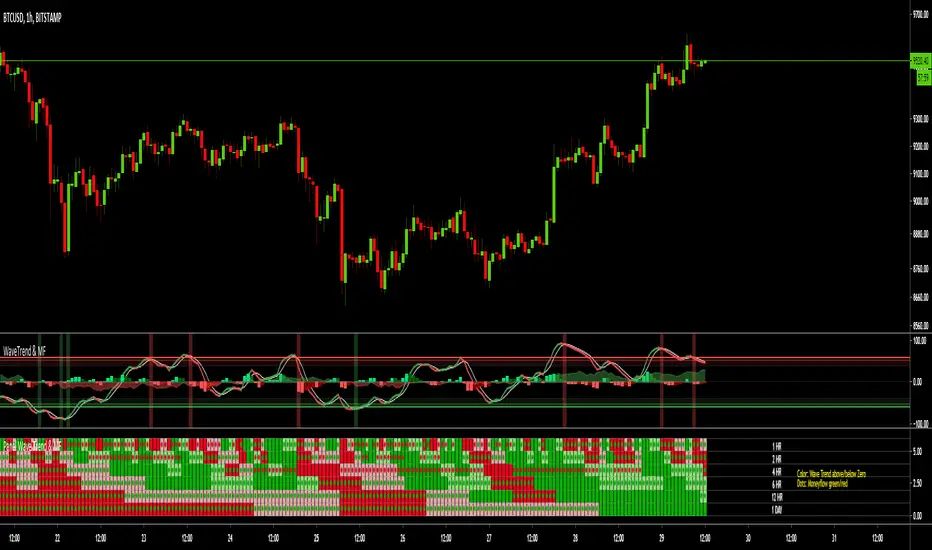
MTF Wave Trend & Money Flow - Monitoring PanelAnother indicator based on the famous "Wave Trend Oscillator" by LazyBear.
Monitoring panel showing the Wave Trend as color for 6 different timeframes. Additionaly the Money Flow (positive or negative) is indicated as green or red dots.
I find it helpful that with one glance the current Wave Trend and Money Flow on many timeframes is visible.
(Timeframes can be changed, but the description labels are currently hardcoded - if you want to change it, just copy the script and change them)
Meanings of the Colors:
WT above Zero and rising : Dark Green
WT above Zero and declining : Light Green
WT below Zero and declining : Dark Red
WT below Zero and rising : Light Red
Money flow positive : Green dot
Monet flow negative : Red dot
(Currently there are two additional timeframes commented in the code - if you want to use them, just copy the script and uncomment them)
Have fun and as always I am open for constructive feedback.
Cheers!
MTF Wave Trend CrossThis indicator is based on the famous "Wave Trend Oscillator" by LazyBear.
I have noticed that the Wave Trend Crosses (not the waves themselves) give a pretty good indication on the current status of the market (above Zero = bullish / below Zero = bearish ).
This new indicator is a Multi TF Version of this where it is possible to define 4 fixed Higher Time Frames and 4 fixed Lower Time Frames.
The results are then plotted above (higher TF) and below (lower TF) of the result of the current TF. (Offset can be flexibly changed in the settings)
This allows to judge the trend based on the various TFs.
Basically the greener it looks, the more bullish the situation is at the moment. More red color indicates a more bearish situation.
Enjoy.

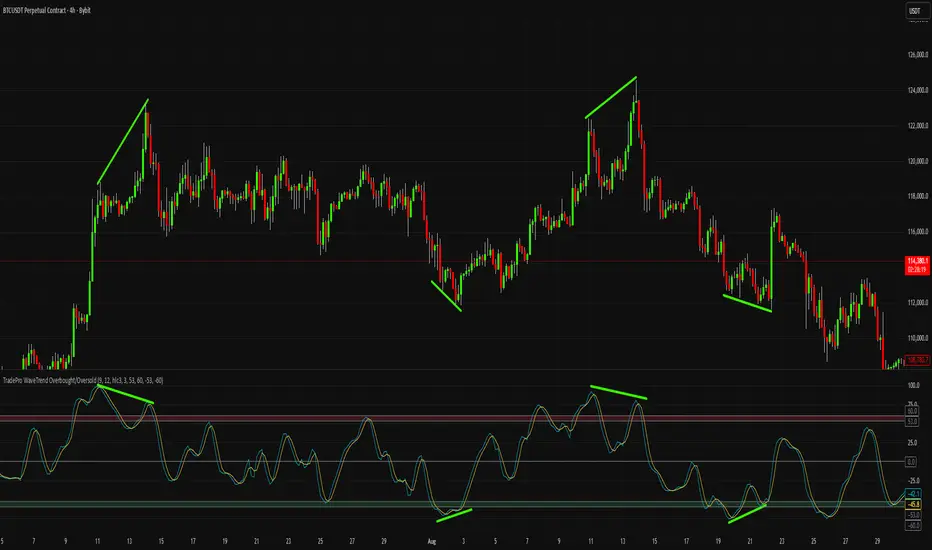
Simplified Wave Trend Overbought/OversoldThis is just a variation of the popular wave trend that I find to be nicer to look at.
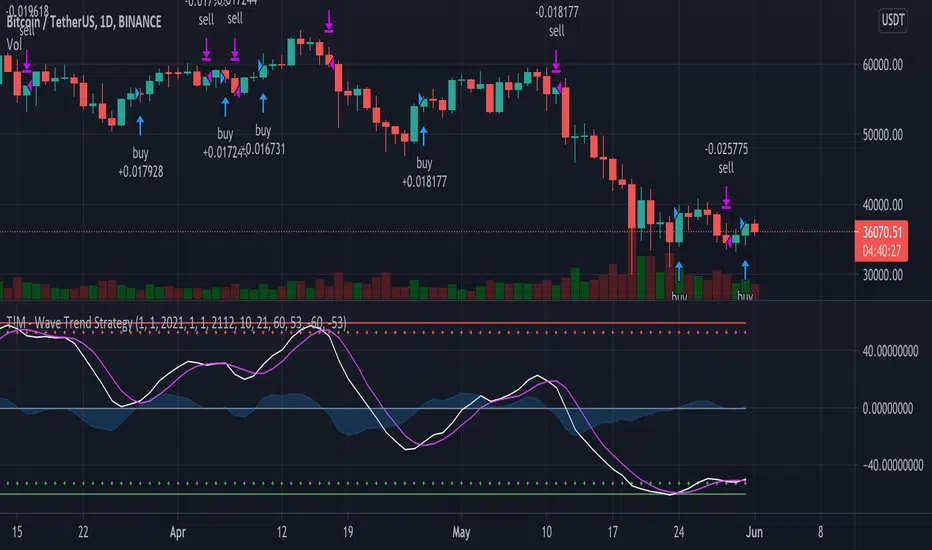
T!M - Wave Trend Strategy with DatesUsing Lazy Bear's original Wave Trend script but I added dates to it to make it easier to backtest.
WaveTrend OscillatorWave trend Oscillator, similar to the other Cypher Oscillators, just that this oscillator is a little bit more refined less noise and a few better options for the money flow, but keeping the basic Structures and features. The only feature this does not have is the divergences

Wave Trend Arrows [Salty]This is just like WT_LB, but with arrows that increase in size to show cross over points. The larger down arrows indicate resistance for overbought levels, and the larger up arrows indicate support for oversold levels.

Crypto Scanner v4This guide explains a version 6 Pine Script that scans a user-provided list of cryptocurrency tokens to identify high probability tradable opportunities using several technical indicators. The script combines trend, momentum, and volume-based analyses to generate potential buying or selling signals, and it displays the results in a neatly formatted table with alerts for trading setups. Below is a detailed walkthrough of the script’s design, how traders can interpret its outputs, and recommendations for optimizing indicator inputs across different timeframes.
## Overview and Key Components
The script is designed to help traders assess multiple tokens by calculating several indicators for each one. The key components include:
- **Input Settings:**
- A comma-separated list of symbols to scan.
- Adjustable parameters for technical indicators such as ADX, RSI, MFI, and a custom Wave Trend indicator.
- Options to enable alerts and set update frequencies.
- **Indicator Calculations:**
- **ADX (Average Directional Index):** Measures trend strength. A value above the provided threshold indicates a strong trend, which is essential for validating momentum before entering a trade.
- **RSI (Relative Strength Index):** Helps determine overbought or oversold conditions. When the RSI is below the oversold level, it may present a buying opportunity, while an overbought condition (not explicitly part of this setup) could suggest selling.
- **MFI (Money Flow Index):** Similar in concept to RSI but incorporates volume, thus assessing buying and selling pressure. Values below the designated oversold threshold indicate potential undervaluation.
- **Wave Trend:** A custom indicator that calculates two components (WT1 and WT2); a crossover where WT1 moves from below to above WT2 (particularly near oversold levels) may signal a reversal and a potential entry point.
- **Scanning and Trading Zone:**
- The script identifies a *bullish setup* when the following conditions are met for a token:
- ADX exceeds the threshold (strong trend).
- Both RSI and MFI are below their oversold levels (indicating potential buying opportunities).
- A Wave Trend crossover confirms near-term reversal dynamics.
- A *trading zone* condition is also defined by specific ranges for ADX, RSI, MFI, and a limited difference between WT1 and WT2. This zone suggests that the token might be in a consolidation phase where even small moves may be significant.
- **Alerts and Table Reporting:**
- A table is generated, with each row corresponding to a token. The table contains columns for the symbol, ADX, RSI, MFI, WT1, WT2, and the trading zone status.
- Visual cues—such as different background colors—highlight tokens with a bullish setup or that are within the trading zone.
- Alerts are issued based on the detection of a bullish setup or entry into a trading zone. These alerts are limited per bar to avoid flooding the trader with notifications.
## How to Interpret the Indicator Outputs
Traders should use the indicator values as guidance, verifying them against their own analysis before making any trading decision. Here’s how to assess each output:
- **ADX:**
- **High values (above threshold):** Indicate strong trends. If other indicators confirm an oversold condition, a trader may consider a long position for a corrective reversal.
- **Low values:** Suggest that the market is not trending strongly, and caution should be taken when considering entry.
- **RSI and MFI:**
- **Below oversold levels:** These conditions are traditionally seen as signals that an asset is undervalued, potentially triggering a bounce.
- **Above typical resistance levels (not explicitly used here):** Would normally caution a trader against entering a long position.
- **Wave Trend (WT1 and WT2):**
- A crossover where WT1 moves upward above WT2 in an oversold environment can signal the beginning of a recovery or reversal, thereby reinforcing buy signals.
- **Trading Zone:**
- Being “in zone” means that the asset’s current values for ADX, RSI, MFI, and the closeness of the Wave Trend lines indicate a period of consolidation. This scenario might be suitable for both short-term scalping or as an early exit indicator, depending on further market analysis.
## Timeframe Optimization Input Table
Traders can optimize indicator inputs depending on the timeframe they use. The following table provides a set of recommended input values for various timeframes. These values are suggestions and should be adjusted based on market conditions and individual trading styles.
Timeframe ADX RSI MFI ADX RSI MFI WT Channel WT Average
5-min 10 10 10 20 30 20 7 15
15-min 12 12 12 22 30 20 9 18
1-hour 14 14 14 25 30 20 10 21
4-hour 16 16 16 27 30 20 12 24
1-day 18 18 18 30 30 20 14 28
Adjust these parameters directly in the script’s input settings to match the selected timeframe. For shorter timeframes (e.g., 5-min or 15-min), the shorter lengths help filter high-frequency noise. For longer timeframes (e.g., 1-day), longer input values may reduce false signals and capture more significant trends.
## Best Practices and Usage Tips
- **Token Limit:**
- Limit the number of tokens scanned to 10 per query line. If you need to scan more tokens, initiate a new query line. This helps manage screen real estate and ensures the table remains legible.
- **Confirming Signals:**
- Use this script as a starting point for identifying high potential trades. Each indicator’s output should be used to confirm your trading decision. Always cross-reference with additional technical analysis tools or market context.
- **Regular Review:**
- Since the script updates the table every few bars (as defined by the update frequency), review the table and alerts regularly. Market conditions change rapidly, so timely decisions are crucial.
## Conclusion
This Pine Script provides a comprehensive approach for scanning multiple cryptocurrencies using a combination of trend strength (ADX), momentum (RSI and MFI), and reversal signals (Wave Trend). By using the provided recommendation table for different timeframes and limiting the tokens to 20 per query line (with a maximum of four query lines), traders can streamline their scanning process and more effectively identify high probability tradable tokens. Ultimately, the outputs should be critically evaluated and combined with additional market research before executing any trades.

Wave Surge [UAlgo]The "Wave Surge " is a comprehensive indicator designed to provide advanced wave pattern analysis for market trends and price movements. Built with customizable parameters, it caters to both beginner and advanced traders looking to improve their decision-making process.
This indicator utilizes wave-based calculations, adaptive thresholds, and volume analysis to detect and visualize key market signals. By integrating multiple analysis techniques.
It calculates waves for high, low, and close prices using a configurable moving average (EMA) technique and pairs it with volume and baseline analysis to confirm patterns. The result is a robust framework for identifying potential entry and exit points in the market.
🔶 Key Features
Wave-Based Analysis: This indicator computes waves using exponential moving averages (EMA) of high, low, and close prices, with an adjustable wave period to suit different market conditions.
Customizable Baseline: Traders can select from multiple baseline types, including VWMA (Volume-Weighted Moving Average), EMA, SMA (Simple Moving Average), and HMA (Hull Moving Average), for trend confirmation.
Adaptive Thresholds: The adaptive threshold feature dynamically adjusts sensitivity based on a chosen period, ensuring the indicator remains responsive to varying market volatility.
Volume Analysis: The integrated volume analysis calculates volume ratios and allows traders to enable or disable this feature to refine signal accuracy.
Pattern Recognition: The indicator identifies specific wave patterns (Wave 1, Wave 3, Wave 4, Wave 5, Wave 6) and visually plots them on the chart for easy interpretation.
Visual and Color-Coded Signals: Clear visual signals (upward and downward arrows) are plotted on the chart to highlight potential bullish or bearish patterns. The baseline is color-coded for an intuitive understanding of market trends.
Configuration: Parameters for wave period, baseline length, volume factors, and sensitivity can be tailored to align with the trader’s strategy and market environment.
🔶 Interpreting the Indicator
Wave Patterns
The indicator detects and plots six unique wave patterns based on price changes that exceed an adaptive threshold. These patterns are validated by the direction of the baseline:
Wave 1 (Bullish): Triggered when the price increases above the threshold while the baseline is falling.
Wave 3, 4, and 6 (Bearish): Indicate potential downtrends validated by a rising baseline.
Wave 5 (Bullish): Suggests upward momentum when prices exceed the threshold with a falling baseline.
Baseline Trend
The baseline serves as a trend confirmation tool, dynamically changing color to reflect market direction:
Aqua (Rising): Indicates an upward trend.
Red (Falling): Indicates a downward trend.
Volume Confirmation
When enabled, the volume analysis feature ensures that signals are supported by significant volume movements. Patterns with high volume are considered more reliable.
Signal Visualization
Upward Arrows (🡹): Highlight potential bullish opportunities.
Downward Arrows (🡻): Highlight potential bearish opportunities.
Alerts
Alerts are triggered when key wave patterns are identified, providing traders with timely notifications to take action without being tied to the screen.
🔶 Disclaimer
Use with Caution: This indicator is provided for educational and informational purposes only and should not be considered as financial advice. Users should exercise caution and perform their own analysis before making trading decisions based on the indicator's signals.
Not Financial Advice: The information provided by this indicator does not constitute financial advice, and the creator (UAlgo) shall not be held responsible for any trading losses incurred as a result of using this indicator.
Backtesting Recommended: Traders are encouraged to backtest the indicator thoroughly on historical data before using it in live trading to assess its performance and suitability for their trading strategies.
Risk Management: Trading involves inherent risks, and users should implement proper risk management strategies, including but not limited to stop-loss orders and position sizing, to mitigate potential losses.
No Guarantees: The accuracy and reliability of the indicator's signals cannot be guaranteed, as they are based on historical price data and past performance may not be indicative of future results.

Elliott Wave Full Fractal System v2.0Elliott Wave Full Fractal System v2.0 – Q.C. FINAL (Guaranteed R/R)
Elliott Wave Full Fractal System is a multi-timeframe wave engine that automatically labels Elliott impulses and ABC corrections, then builds a rule-based, ATR-driven risk/reward framework around the “W3–W4–W5” leg.
“Guaranteed R/R” here means every order is placed with a predefined stop-loss and take-profit that respect a minimum Reward:Risk ratio – it does not mean guaranteed profits.
Core Idea
This strategy turns a full fractal Elliott Wave labelling engine into a systematic trading model.
It scans fractal pivots on three wave degrees (Primary, Intermediate, Minor) to detect 5-wave impulses and ABC corrections.
A separate “Trading Degree” pivot stream, filtered by a 200-EMA trend filter and ATR-based dynamic pivots, is then used to find W4 pullback entries with a minimum, user-defined Reward:Risk ratio.
Default Properties & Risk Assumptions
The backtest uses realistic but conservative defaults:
// Default properties used for backtesting
strategy(
"Elliott Wave Full Fractal System - Q.C. FINAL (Guaranteed R/R)",
overlay = true,
initial_capital = 10000, // realistic account size
default_qty_type = strategy.percent_of_equity,
default_qty_value = 1, // 1% risk per trade
commission_type = strategy.commission.cash_per_contract,
commission_value = 0.005, // example stock commission
slippage = 0 // see notes below
)
Account size: 10,000 (can be changed to match your own account).
Position sizing: 1% of equity per trade to keep risk per idea sustainable and aligned with TradingView’s recommendations.
Commission: 0.005 cash per contract/share as a realistic example for stock trading.
Slippage: set to 0 in code for clarity of “pure logic” backtesting. Real-life trading will experience slippage, so users should adjust this according to their market and broker.
Always re-run the backtest after changing any of these values, and avoid using high risk fractions (5–10%+) as that is rarely sustainable.
1. Full Fractal Wave Engine
The script builds and maintains four pivot streams using ATR-adaptive fractals:
Primary Degree (Macro Trend):
Captures the large swings that define the major trend. Labels ①–⑤ and ⒶⒷⒸ using blue “Circle” labels and thicker lines.
Intermediate Degree (Trading Degree):
Captures the medium swings (swing-trading horizon). Uses teal labels ( (1)…(5), (A)(B)(C) ).
Minor Degree (Micro Structure):
Tracks short-term swings inside the larger waves. Uses red roman numerals (i…v, a b c).
ABC Corrections (Optional):
When enabled, the engine tries to detect standard A–B–C corrective structures that follow a completed 5-wave impulse and plots them with dashed lines.
Each degree uses a dynamic pivot lookback that expands when ATR is above its EMA, so the system naturally requires “stronger” pivots in volatile environments and reacts faster in quiet conditions.
2. Theory Rules & Strict Mode
Normal Mode: More permissive detection. Designed to show more wave structures for educational / exploratory use.
Strict Mode: Enforces key Elliott constraints:
Wave 3 not shorter than waves 1 and 5.
No invalid W4 overlap with W1 (for standard impulses).
ABC Logic: After a confirmed bullish impulse, the script expects a down-up-down corrective pattern (A,B,C). After a bearish impulse, it looks for up-down-up.
3. Trend Filter & Pivots
EMA Trend Filter: A configurable EMA (default 200) is used as a non-wave trend filter.
Price above EMA → Only long setups are considered.
Price below EMA → Only short setups are considered.
ATR-Adaptive Pivots: The pivot engine scales its left/right bars based on current ATR vs ATR EMA, making waves and trading pivots more robust in volatile regimes.
4. Dynamic Risk Management (Guaranteed R/R Engine)
The trading engine is designed around risk, not just pattern recognition:
ATR-Based Stop:
Stop-loss is placed at:
Entry ± ATR × Multiplier (user-configurable, default 2.0).
This anchors risk to current volatility.
Minimum Reward:Risk Ratio:
For each setup, the script:
Computes the distance from entry to stop (risk).
Projects a take-profit target at risk × min_rr_ratio away from entry.
Only accepts the setup if risk is positive and the required R:R ratio is achievable.
Result: Every order is created with both TP and SL at a predefined distance, so each trade starts with a known, minimum Reward:Risk profile by design.
“Guaranteed R/R” refers exclusively to this order placement logic (TP/SL geometry), not to win-rate or profitability.
5. Trading Logic – W3–W4–W5 Pattern
The Trading pivot stream (separate from visual wave degrees) looks for a simple but powerful pattern:
Bullish structure:
Sequence of pivots forms a higher-high / higher-low pattern.
Price is above the EMA trend filter.
A strong “W3” leg is confirmed with structure rules (optionally stricter in Strict mode).
Entry (Long – W4 Pullback):
The “height” of W3 is measured.
Entry is placed at a configurable Fibonacci pullback (default 50%) inside that leg.
ATR-based stop is placed below entry.
Take-profit is projected to satisfy min Reward:Risk.
Bearish structure:
Mirrored logic (lower highs/lows, price below EMA, W3 down, W4 retrace up, W5 continuation down).
Once a valid setup is found, the script draws a colored box around the entry zone and a label describing the type of signal (“LONG SETUP” or “SHORT SETUP”) with the suggested limit price.
6. Orders & Execution
Entry Orders: The strategy uses limit orders at the computed W4 level (“Sniper Long” or “Sniper Short”).
Exits: A single strategy.exit() is attached to each entry with:
Take-profit at the projected minimum R:R target.
Stop-loss at ATR-based level.
One Trade at a Time: New setups are only used when there is no open position (strategy.opentrades == 0) to keep the logic clear and risk contained.
7. Visual Guide on the Chart
Wave Labels:
Primary: ①,②,③,④,⑤, ⒶⒷⒸ
Intermediate: (1)…(5), (A)(B)(C)
Minor: i…v, a b c
Trend EMA: Single blue EMA showing the dominant trend.
Setup Boxes:
Green transparent box → long entry zone.
Red transparent box → short entry zone.
Labels: “LONG SETUP / SHORT SETUP” labels mark the proposed limit entry with price.
8. How to Use This Strategy
Attach the strategy to your chart
Choose your market (stocks, indices, FX, crypto, futures, etc.) and timeframe (for example 1h, 4h, or Daily). Then add the strategy to the chart from your Scripts list.
Start with the default settings
Leave all inputs on their defaults first. This lets you see the “intended” behaviour and the exact properties used for the published backtest (account size, 1% risk, commission, etc.).
Study the wave map
Zoom in and out and look at the three wave degrees:
Blue circles → Primary degree (big picture trend).
Teal (1)…(5) → Intermediate degree (swing structure).
Red i…v → Minor degree (micro waves).
Use this to understand how the engine is interpreting the Elliott structure on your symbol.
Watch for valid setups
Look for the coloured boxes and labels:
Green box + “LONG SETUP” label → potential W4 pullback long in an uptrend.
Red box + “SHORT SETUP” label → potential W4 pullback short in a downtrend.
Only trades in the direction of the EMA trend filter are allowed by the strategy.
Check the Reward:Risk of each idea
For each setup, inspect:
Limit entry price.
ATR-based stop level.
Projected take-profit level.
Make sure the minimum Reward:Risk ratio matches your own rules before you consider trading it.
Backtest and evaluate
Open the Strategy Tester:
Verify you have a decent sample size (ideally 100+ trades).
Check drawdowns, average trade, win-rate and R:R distribution.
Change markets and timeframes to see where the logic behaves best.
Adapt to your own risk profile
If you plan to use it live:
Set Initial Capital to your real account size.
Adjust default_qty_value to a risk level you are comfortable with (often 0.5–2% per trade).
Set commission and slippage to realistic broker values.
Re-run the backtest after every major change.
Use as a framework, not a signal machine
Treat this as a structured Elliott/R:R framework:
Filter signals by higher-timeframe trend, major S/R, volume, or fundamentals.
Optionally hide some wave degrees or ABC labels if you want a cleaner chart.
Combine the system’s structure with your own trade management and discretion.
Best Practices & Limitations
This is an approximate Elliott Wave engine based on fractal pivots. It does not replace a full discretionary Elliott analysis.
All wave counts are algorithmic and can differ from a manual analyst’s interpretation.
Like any backtest, results depend heavily on:
Symbol and timeframe.
Sample size (more trades are better).
Realistic commission/slippage settings.
The 0-slippage default is chosen only to show the “raw logic”. In real markets, slippage can significantly impact performance.
No strategy wins all the time. Losing streaks and drawdowns will still occur even with a strict R:R framework.
Disclaimer
This script is for educational and research purposes only and does not constitute financial advice or a recommendation to buy or sell any security. Past performance, whether real or simulated, is not indicative of future results. Always test on multiple symbols/timeframes, use conservative risk, and consult your financial advisor before trading live capital.

Money Flow Matrix This comprehensive indicator is a multi-faceted momentum and volume oscillator designed to identify trend strength, potential reversals, and market confluence. It combines a volume-weighted RSI (Money Flow) with a double-smoothed momentum oscillator (Hyper Wave) to filter out noise and provide high-probability signals.
Core Components
1. Money Flow (The Columns) This is the backbone of the indicator. It calculates a normalized RSI and weights it by relative volume.
Green Columns: Positive money flow (Buying pressure).
Red Columns: Negative money flow (Selling pressure).
Neon Colors (Overflow): When the columns turn bright Neon Green or Neon Red, the Money Flow has breached the dynamic Bollinger Band thresholds. This indicates an extreme overbought or oversold condition, suggesting a potential climax in the current move.
2. Hyper Wave (The Line) This is a double-smoothed Exponential Moving Average (EMA) derived from price changes. It acts as the "signal line" for the system. It is smoother than standard RSI or MACD, reducing false signals during choppy markets.
Green Line: Momentum is increasing.
Red Line: Momentum is decreasing.
3. Confluence Zones (Background) The background color changes based on the agreement between Money Flow and Hyper Wave.
Green Background: Both Money Flow and Hyper Wave are bullish. This represents a high-probability long environment.
Red Background: Both Money Flow and Hyper Wave are bearish. This represents a high-probability short environment.
Signal Guide
The Matrix provides three tiers of signals, ranging from early warnings to confirmation entries.
1. Warning Dots (Circles) These appear when the Hyper Wave crosses specific internal levels (-30/30).
Green Dot: Early warning of a bullish rotation.
Red Dot: Early warning of a bearish rotation.
Usage: These are not immediate entry signals but warnings to tighten stop-losses or prepare for a reversal.
2. Major Crosses (Triangles) These occur when Money Flow crosses the zero line, confirmed by momentum direction.
Green Triangle Up: Major Buy Signal (Money Flow crosses above 0).
Red Triangle Down: Major Sell Signal (Money Flow crosses below 0).
Usage: These are the primary trend-following entry signals.
3. Divergences (Labels "R" and "H") The script automatically detects discrepancies between Price action and the Hyper Wave oscillator.
"R" (Regular Divergence): Indicates a potential Reversal.
Bullish R: Price makes a lower low, but Oscillator makes a higher low.
Bearish R: Price makes a higher high, but Oscillator makes a lower high.
"H" (Hidden Divergence): Indicates a potential Trend Continuation.
Bullish H: Price makes a higher low, but Oscillator makes a lower low.
Bearish H: Price makes a lower high, but Oscillator makes a higher high.
Dashboard (Confluence Meter)
Located in the bottom right of the chart, the dashboard provides a snapshot of the current candle's status. It calculates a score based on three factors:
Is Money Flow positive?
Is Hyper Wave positive?
Is Hyper Wave trending up?
Readings:
STRONG BUY: All metrics are bullish.
WEAK BUY: Mixed metrics, but leaning bullish.
NEUTRAL: Metrics are conflicting.
WEAK/STRONG SELL: Bearish equivalents of the buy signals.
Trading Strategies
Strategy A: The Trend Rider
Entry: Wait for a Green Triangle (Major Buy).
Confirmation: Ensure the Background is highlighted Green (Confluence).
Exit: Exit when the background turns off or a Red Warning Dot appears.
Strategy B: The Reversal Catch
Setup: Look for a Neon Red Column (Overflow/Oversold).
Trigger: Wait for a Green "R" Label (Regular Bullish Divergence) or a Green Warning Dot.
Confirmation: Wait for the Hyper Wave line to turn green.
Strategy C: The Pullback (Continuation)
Context: The market is in a strong trend (Green Background).
Trigger: Price pulls back, but a Green "H" Label (Hidden Bullish Divergence) appears.
Action: Enter in the direction of the original trend.
Settings Configuration
The code includes tooltips for all inputs to assist with configuration.
Money Flow Length: Adjusts the sensitivity of the volume calculation. Lower numbers are faster but noisier; higher numbers are smoother.
Threshold Multiplier: Controls the "Neon" overflow bars. Increasing this (e.g., to 2.5 or 3.0) will result in fewer, more extreme signals.
Divergence Lookback: Determines how many candles back the script looks to identify pivots. Increase this number to find larger, macro divergences.
Disclaimer
This source code and the accompanying documentation are for educational and informational purposes only. They do not constitute financial, investment, or trading advice.

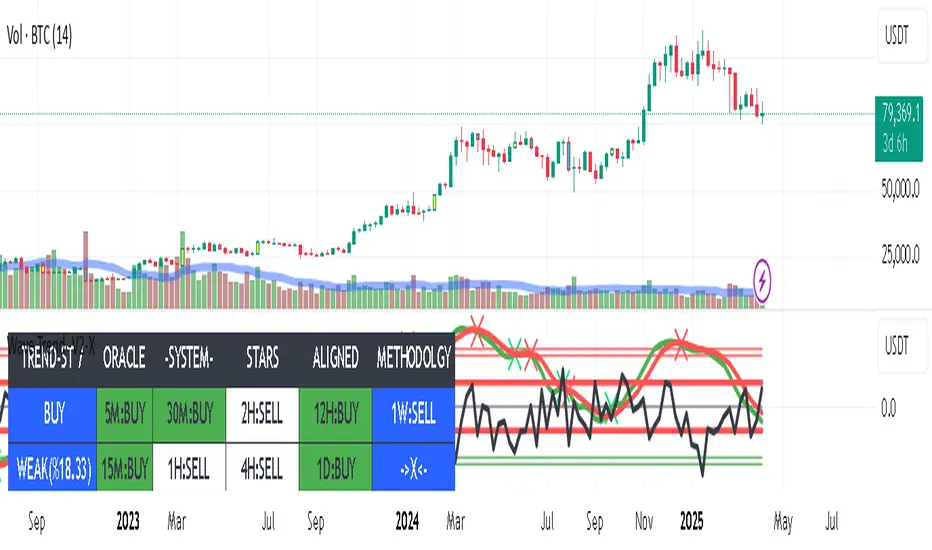
Mutanabby_AI | Fresh Algo V24Mutanabby_AI | Fresh Algo V24: Advanced Multi-Mode Trading System
Overview
The Mutanabby_AI Fresh Algo V24 represents a sophisticated evolution of multi-component trading systems that adapts to various market conditions through advanced operational configurations and enhanced analytical capabilities. This comprehensive indicator provides traders with multiple signal generation approaches, specialized assistant functions, and dynamic risk management tools designed for professional market analysis across diverse trading environments.
Primary Signal Generation Framework
The Fresh Algo V24 operates through two fundamental signal generation approaches that accommodate different market perspectives and trading philosophies. The Trending Signals Mode serves as the primary trend-following mechanism, combining Wave Trend Oscillator analysis with Supertrend directional signals and Squeeze Momentum breakout detection. This mode incorporates ADX filtering that requires values exceeding 20 to ensure sufficient trend strength exists before signal activation, making it particularly effective during sustained directional market movements where momentum persistence creates profitable trading opportunities.
The Contrarian Signals Mode provides an alternative approach targeting reversal opportunities through extreme market condition identification. This mode activates when the Wave Trend Oscillator reaches critical threshold levels, specifically when readings surpass 65 indicating potential bearish reversal conditions or drop below 35 suggesting bullish reversal opportunities. This methodology proves valuable during overextended market phases where mean reversion becomes statistically probable.
Advanced Filtering Mechanisms
The system incorporates multiple sophisticated filtering mechanisms designed to enhance signal quality and reduce false positive occurrences. The High Volume Filter requires volume expansion confirmation before signal activation, utilizing exponential moving average calculations to ensure institutional participation accompanies price movements. This filter substantially improves signal reliability by eliminating low-conviction breakouts that lack adequate volume support from professional market participants.
The Strong Filter provides additional trend confirmation through 200-period exponential moving average analysis. Long position signals require price action above this benchmark level, while short position signals necessitate price action below it. This ensures strategic alignment with longer-term trend direction and reduces the probability of trading against major market movements that could invalidate shorter-term signals.
Cloud Filter Configuration System
The Fresh Algo V24 offers four distinct cloud filter configurations, each optimized for specific trading timeframes and market approaches. The Smooth Cloud Filter utilizes the mathematical relationship between 150-period and 250-period exponential moving averages, providing stable trend identification suitable for position trading strategies. This configuration generates signals exclusively when price action aligns with cloud direction, creating a more deliberate but highly reliable signal generation process.
The Swing Cloud Filter employs modified Supertrend calculations with parameters specifically optimized for swing trading timeframes. This filter achieves optimal balance between responsiveness and stability, adapting effectively to medium-term price movements while filtering excessive market noise that typically affects shorter-term analytical systems.
For active intraday traders, the Scalping Cloud Filter utilizes accelerated Supertrend calculations designed to capture rapid trend changes effectively. This configuration provides enhanced signal generation frequency suitable for compressed timeframe strategies. The advanced Scalping+ Cloud Filter incorporates Hull Moving Average confirmation, delivering maximum responsiveness for ultra-short-term trading while maintaining signal quality through additional momentum validation processes.
Specialized Assistant Functionality
The system includes two distinct assistant modes that provide supplementary market analysis capabilities. The Trend Assistant Mode activates advanced cloud analysis overlays that display dynamic support and resistance zones calculated through adaptive volatility algorithms. These levels automatically adjust to current market conditions, providing visual guidance for identifying trend continuation patterns and potential reversal areas with mathematical precision.
The Trend Tracker Mode concentrates on long-term trend identification by displaying major exponential moving averages with color-coded fill areas that clarify directional bias. This mode maintains visual simplicity while providing comprehensive trend context evaluation, enabling traders to quickly assess broader market direction and align shorter-term strategies accordingly.
Dynamic Risk Management System
The integrated risk management system automatically adapts across all operational modes, calculating stop loss and take profit targets using Average True Range multiples that adjust to current market volatility. This approach ensures consistent risk parameters regardless of selected operational mode while maintaining relevance to prevailing market conditions.
Stop loss placement occurs at dynamically calculated distances from entry points, while three progressive take profit targets establish at customizable ATR multiples respectively. The system automatically updates these levels upon trend direction changes, ensuring current market volatility influences all risk calculations and maintains appropriate risk-reward ratios throughout trade management.
Comprehensive Market Analysis Dashboard
The sophisticated dashboard provides real-time market analysis including volatility measurements, institutional activity assessment, and multi-timeframe trend evaluation across five-minute through four-hour periods. This comprehensive market context assists traders in selecting appropriate operational modes based on current market characteristics rather than relying exclusively on historical performance data.
The multi-timeframe analysis ensures mode selection considers broader market context beyond the primary trading timeframe, improving overall strategic alignment and reducing conflicts between different temporal market perspectives. The dashboard displays market state classification, volatility percentages, institutional activity levels, current trading session information, and trend pressure indicators with professional formatting and clear visual hierarchy.
Enhanced Trading Assistants
The Fresh Algo V24 includes specialized trading assistant features that complement the primary signal generation system. The Reversal Dot functionality identifies potential reversal points through Wave Trend Oscillator analysis, displaying visual indicators when crossover conditions occur at extreme levels. These reversal indicators provide early warning signals for potential trend changes before they appear in the primary signal system.
The Dynamic Take Profit Labels feature automatically identifies optimal profit-taking opportunities through RSI threshold analysis, marking potential exit points at multiple levels for long positions and corresponding levels for short positions. This automated profit management system helps traders optimize exit timing without requiring constant manual monitoring of technical indicators.
Advanced Alert System
The comprehensive alert system accommodates all operational modes while providing granular notification control for various signal types and risk management events. Traders can configure separate alerts for normal buy signals, strong buy signals, normal sell signals, strong sell signals, stop loss triggers, and individual take profit target achievements.
Cloud crossover alerts notify traders when trend direction changes occur, providing early indication of potential strategy adjustments. The alert system includes detailed trade setup information, timeframe data, and relevant entry and exit levels, ensuring traders receive complete context for informed decision-making without requiring constant chart monitoring.
Technical Foundation Architecture
The Fresh Algo V24 combines multiple proven technical analysis components including Wave Trend Oscillator for momentum assessment, Supertrend for directional bias determination, Squeeze Momentum for volatility analysis, and various exponential moving averages for trend confirmation. Each component contributes specific market insights while the unified system provides comprehensive market evaluation through their mathematical integration.
The multi-component approach reduces dependency on individual indicator limitations while leveraging the analytical strengths of each technical tool. This creates a robust analytical framework capable of adapting to diverse market conditions through appropriate mode selection and parameter optimization, ensuring consistent performance across varying market environments.
Market State Classification
The indicator incorporates advanced market state classification through ADX analysis, distinguishing between trending, ranging, and transitional market conditions. This classification system automatically adjusts signal sensitivity and filtering parameters based on current market characteristics, optimizing performance for prevailing conditions rather than applying static analytical approaches.
The volatility measurement system calculates current market activity levels as percentages, providing quantitative assessment of market energy and helping traders select appropriate operational modes. Institutional activity detection through volume analysis ensures signal generation aligns with professional market participation patterns.
Implementation Strategy Considerations
Successful implementation requires careful matching of operational modes to prevailing market conditions and individual trading objectives. Trending modes demonstrate optimal performance during directional markets with sustained momentum characteristics, while contrarian modes excel during range-bound or overextended market conditions where reversal probability increases.
The cloud filter configurations provide varying degrees of confirmation strength, with smoother settings reducing false signal occurrence at the expense of some responsiveness to price changes. Traders must balance signal quality against signal frequency based on their risk tolerance and available trading time, utilizing the comprehensive customization options to optimize performance for their specific requirements.
Multi-Timeframe Integration
The system provides seamless multi-timeframe analysis through the integrated dashboard, displaying trend alignment across multiple time horizons from five-minute through four-hour periods. This analysis helps traders understand broader market context and avoid conflicts between different temporal perspectives that could compromise trade outcomes.
Session analysis identifies current trading session characteristics, providing context for expected market behavior patterns and helping traders adjust their approach based on typical session volatility and participation levels. This geographic market awareness enhances strategic decision-making and improves timing for trade execution.
Advanced Visualization Features
The indicator includes sophisticated visualization capabilities through gradient candle coloring based on MACD analysis, providing immediate visual feedback on momentum strength and direction. This enhancement allows rapid market assessment without requiring detailed indicator analysis, improving efficiency for traders managing multiple instruments simultaneously.
The cloud visualization system uses color-coded fill areas to clearly indicate trend direction and strength, with automatic adaptation to selected operational modes. This visual clarity reduces analytical complexity while maintaining comprehensive market information display through professional chart presentation.
Performance Optimization Framework
The Fresh Algo V24 incorporates performance optimization features including signal strength classification, automatic parameter adjustment based on market conditions, and dynamic filtering that adapts to current volatility levels. These optimizations ensure consistent performance across varying market environments while maintaining signal quality standards.
The system automatically adjusts sensitivity levels based on selected operational modes, ensuring appropriate responsiveness for different trading approaches. This adaptive framework reduces the need for manual parameter adjustments while maintaining optimal performance characteristics for each operational configuration.
Conclusion
The Mutanabby_AI Fresh Algo V24 represents a comprehensive solution for professional trading analysis, combining multiple analytical approaches with advanced visualization and risk management capabilities. The system's strength lies in its adaptive multi-mode design and sophisticated filtering mechanisms, providing traders with versatile tools for various market conditions and trading styles.
Success with this system requires understanding the relationship between different operational modes and their optimal application scenarios. The comprehensive dashboard and alert system provide essential market context and trade management support, enabling systematic approach to market analysis while maintaining flexibility for individual trading preferences.
The indicator's sophisticated architecture and extensive customization options make it suitable for traders at all experience levels, from those seeking systematic signal generation to advanced practitioners requiring comprehensive market analysis tools. The multi-timeframe integration and adaptive filtering ensure consistent performance across diverse market conditions while providing clear guidelines for strategic implementation.

Multi-Factor Reversal AnalyzerMulti-Factor Reversal Analyzer – Quantitative Reversal Signal System
OVERVIEW
Multi-Factor Reversal Analyzer is a comprehensive technical analysis toolkit designed to detect market tops and bottoms with high precision. It combines trend momentum analysis, price action behavior, wave oscillation structure, and volatility breakout potential into one unified indicator.
This indicator is not a random mix of tools — each module is carefully selected for a specific purpose. When combined, they form a multi-dimensional view of the market, merging trend analysis, momentum divergence, and volatility compression to produce high-confidence signals.
Why Combine These Modules?
Module Combination Ideas & How to Use Them
Factor A: Trend Detector + Gold Zone
Concept:
• The Trend Detector (light yellow histogram) evaluates market strength:
• Histogram trending downward or staying below 50 → bearish conditions;
• Trending upward or staying above 50 → bullish conditions.
• The Gold Zone identifies areas of volatility compression — typically a prelude to explosive market moves.
Practical Application:
• When the Gold Zone appears and the Trend Detector is bearish → likely downside move;
• When the Gold Zone appears and the Trend Detector is bullish → likely upside breakout.
• Note: The Gold Zone does not mean the bottom is in. It is not a buy signal on its own — always combine it with other modules for directional bias.
Factor B: PAI + Wave Trend
Concept:
• PAI (Price Action Index) is a custom oscillator that combines price momentum with volatility dispersion, displaying strength zones:
• Green area → bullish dominance;
• Red area → bearish pressure.
• Wave Trend offers smoothed crossover signals via the main and signal lines.
Practical Application:
• When PAI is in the green zone and Wave Trend makes a bullish crossover → potential reversal to the upside;
• When PAI is in the red zone and Wave Trend shows a bearish crossover → potential start of a downtrend.
Factor C: Trend Detector + PAI
Concept:
• Combines directional trend strength with price action strength to confirm setups via confluence.
Practical Application:
• Trend Detector histogram bottoms out + PAI enters the green zone → high chance of upward reversal;
• Histogram tops out + PAI in the red zone → increased likelihood of downside continuation.
Multi-Factor Confluence (Advanced Use)
• When Trend Detector, PAI, and Wave Trend all align in the same direction (bullish or bearish), the directional signal becomes significantly more reliable.
• This setup is especially useful for trend-following or swing trade entries.
KEY FEATURES
1. Multi-Layer Reversal Logic
• Combines trend scoring, oscillator divergence, and volatility squeezes for triangulated reversal detection.
• Helps traders distinguish between trend pullbacks and true reversals.
2. Advanced Divergence Detection
• Detects both regular and hidden divergences using pivot-based confirmation logic.
• Customizable lookback ranges and pivot sensitivity provide flexible tuning for different market styles.
3. Gold Zone Volatility Compression
• Highlights pre-breakout zones using custom oscillation models (RSI, harmonic, Karobein, etc.).
• Improves anticipation of breakout opportunities following low-volatility compressions.
4. Trend Direction Context
• PAI and Trend Score components provide top-down insight into prevailing bias.
• Built-in “Straddle Area” highlights consolidation zones; breakouts from this area often signal new trend phases.
5. Flexible Visualization
• Color-coded trend bars, reversal markers, normalized oscillator plots, and trend strength labels.
• Designed for both visual discretionary traders and data-driven system developers.
USAGE GUIDELINES
1. Applicable Markets
• Suitable for stocks, crypto, futures, and forex
• Supports reversal, mean-reversion, and breakout trading styles
2. Recommended Timeframes
• Short-term traders: 5m / 15m / 1H — use Wave Trend divergence + Gold Zone
• Swing traders: 4H / Daily — rely on Price Action Index and Trend Detector
• Macro trend context: use PAI HTF mode for higher timeframe overlays
3. Reversal Strategy Flow
• Watch for divergence (WT/PAI) + Gold Zone compression
• Confirm with Trend Score weakening or flipping
• Use Straddle Area breakout for final trigger
• Optional: enable bar coloring or labels for visual reinforcement
• The indicator performs optimally when used in conjunction with a harmonic pattern recognition tool
4. Additional Note on the Gold Zone
The “Gold Zone” does not directly indicate a market bottom. Since it is displayed at the bottom of the chart, it may be misunderstood as a bullish signal. In reality, the Gold Zone represents a compression of price momentum and volatility, suggesting that a significant directional move is about to occur. The direction of that move—upward or downward—should be determined by analyzing the histogram:
• If histogram momentum is weakening, the Gold Zone may precede a downward move.
• If histogram momentum is strengthening, it may signal an upcoming rebound or rally.
Treat the Gold Zone as a warning of impending volatility, and always combine it with trend indicators for accurate directional judgment.
RISK DISCLAIMER
• This indicator calculates trend direction based on historical data and cannot guarantee future market performance. When using this indicator for trading, always combine it with other technical analysis tools, fundamental analysis, and personal trading experience for comprehensive decision-making.
• Market conditions are uncertain, and trend signals may result in false positives or lag. Traders should avoid over-reliance on indicator signals and implement stop-loss strategies and risk management techniques to reduce potential losses.
• Leverage trading carries high risks and may result in rapid capital loss. If using this indicator in leveraged markets (such as futures, forex, or cryptocurrency derivatives), exercise caution, manage risks properly, and set reasonable stop-loss/take-profit levels to protect funds.
• All trading decisions are the sole responsibility of the trader. The developer is not liable for any trading losses. This indicator is for technical analysis reference only and does not constitute investment advice.
• Before live trading, it is recommended to use a demo account for testing to fully understand how to use the indicator and apply proper risk management strategies.
CHANGELOG
v1.0: Initial release featuring integrated Price Action Index, Trend Strength Scoring, Wave Trend Oscillator, Gold Zone Compression Detection, and dual-type divergence recognition. Supports higher timeframe (HTF) synchronization, visual signal markers, and diversified parameter configurations.

Trend of Multiple Oscillator Dashboard ModifiedDescription: The "Trend of Multiple Oscillator Dashboard Modified" is a powerful Pine Script indicator that provides a dashboard view of various oscillator and trend-following indicators across multiple timeframes. This indicator helps traders to assess trend conditions comprehensively by integrating popular technical indicators, including MACD, EMA, Stochastic, Elliott Wave, DID (Curta, Media, Longa), Price Volume Trend (PVT), Kuskus Trend, and Wave Trend Oscillator. Each indicator’s trend signal (bullish, bearish, or neutral) is displayed in a color-coded dashboard, making it easy to spot the consensus or divergence in trends across different timeframes.
Key Features:
Multi-Timeframe Analysis: Displays trend signals across five predefined timeframes (1, 2, 3, 5, and 10 minutes) for each included indicator.
Customizable Inputs: Allows for customization of key parameters for each oscillator and trend-following indicator.
Trend Interpretation: Each indicator is visually represented with green (bullish), red (bearish), and yellow (neutral) trend markers, making trend identification intuitive and quick.
Trade Condition Controls: Input options for the number of positive and negative conditions needed to trigger entries and exits, allowing users to refine the decision-making criteria.
Delay Management: Options for re-entry conditions based on both price movement (in points) and the minimum number of candles since the last exit, giving users flexibility in managing trade entries.
Usage: This indicator is ideal for traders who rely on multiple oscillators and moving averages to gauge trend direction and strength across timeframes. The dashboard allows users to observe trends at a glance and make informed decisions based on the alignment of various trend indicators. It’s particularly useful in consolidating signals for strategies that require multiple conditions to align before entering or exiting trades.
Note: Ensure that you’re familiar with each oscillator’s functionality, as some indicators like Elliott Wave and Wave Trend are simplified for visual coherence in this dashboard.
Disclaimer: This script is intended for educational and informational purposes only. Use it with caution and adapt it to your specific trading plan.
Developer's Remark: "This indicator's comprehensive design allows traders to filter noise and identify the most robust trends effectively. Use it to visualize trends across timeframes, understand oscillator behavior, and enhance decision-making with a more strategic approach."
