Take profit Multi timeframeRepublish:
Take profit Multi timeframe:
In this scipts, I build risk-reward system managemant. You can take profit in two way: percent or at resistant in higher timeframe or both.
Strategy in this scripts, I use Wave trend indicator as example strategy.
Search in scripts for "wave trend"

Oscillators Overlay w/ Divergencies/Alerts by DGTAn oscillator is a technical analysis tool that, simply said, gauge momentum, determine market trend direction and duration. For some oscillators, fluctuations are bounded by some upper and lower band, and traders use them to discover short-term overbought or oversold conditions.
Oscillators are often combined with moving average indicators to signal trend breakouts or reversals
Histogram, is the difference between the oscillator and signal lines, which oscillates above and below a center line and is used as a good indication of an asset's momentum
What to look for
- Signal Line Crossover is the most common signal produced by the oscillators
- Zero Line Crossovers have a very similar premise to Signal Line Crossovers
- Divergence , when the oscillator and actual price are not in agreement, is another signal created by the oscillators
- Overbought and Oversold , with any range-bound oscillator, conditions are a primary signal generated
Oscillators Overlay study
* Presents oscillators on top of the mian chart (price chart)
* A single indicator for many well known and custom oscillators
* Divergence detection
* Alerts for various condtions
The list of oscillators included;
- Awesome Oscillator (AO)
- Chaikin Oscillator (Chaikin Osc)
- Commodity Channel Index (CCI)
- Distance Oscillator
- Elder-Ray Bear and Bull Power
- Elliott Wave Oscillator (EWO)
- Klinger Oscillator
- Money Flow Index (MFI)
- Moving Average Convergence Divergence (MACD)
- Rate Of Change (ROC)
- Relative Strength Index (RSI)
- Stochastic (Stoch)
- Stochastic RSI (Stoch RSI)
- Volume Oscillator (Volume Osc)
- Wave Trend
In technical analysis, investors find oscillators to be important technical tools and consider them more effective when used in conjunction with other means of technical analysis
Disclaimer : Trading success is all about following your trading strategy and the indicators should fit within your trading strategy, and not to be traded upon solely
The script is for informational and educational purposes only. Use of the script does not constitutes professional and/or financial advice. You alone the sole responsibility of evaluating the script output and risks associated with the use of the script. In exchange for using the script, you agree not to hold dgtrd TradingView user liable for any possible claim for damages arising from any decision you make based on use of the script

Pierce Strength IndexThis is a combination of RSI, Elliot Wave Trend, and SqzMomentum that helps to predict the likelihood of short term buy and sell opportunities and local maxima.
Changing color of the line in addition to when the line exceeds or crosses under the threshold lines can act as potential buy/sell signals.

Jetto's Custom Indicator V.1I have added few lines of code to the wave trend oscillator to give you guys the most accurate copy of my personal indicator.

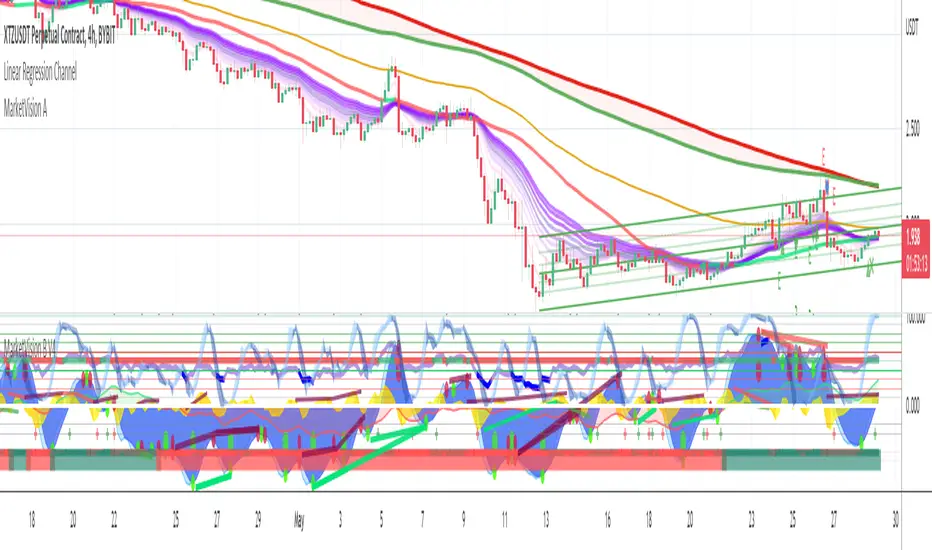
MarketVision AWith Special Thanks to Everyone who has gone before me, and who have both allowed me and given me Permission to bring my version of Market Cipher to the World
Especially LazyBear for his amazing Wave Trend Oscillator and for Aevir, falconCoin, vumanchu, Crypto_Spike and others who have freely brought MarketCipher to the Tradingview Community and Also JustUncleL for his Multiple MA Variations / types
MarketVision A - My take on MarketCipher A / Market Cipher A But with a few Additions
A Combination of;
Different Types of Moving Averages including a Ribbon which can be switched off
MA Cross Over Signals &
Signals Obtained from Wave Trend and Trend Meter
Lots Of Alerts
Use Stand Alone or In Combination with MarketVision B Aswell As Support and Resistance
PS All the Signals are defined in the menu
New Map For TradersUsing previous principles, This setup plots 60 moving averages on the chart. The averages are colored using a normalized oscillation technique (FFT).
To achieve the same display as above, put the same indicator twice and set the 'osx' parameter of one to 0 and the other to 2.
Feel free to play with the 'mul' parameter in ranges between 1-90. Most useful ranges will be 4-16 in my opinion.
Leave me a message if you'd like to explore the behaviors of the fractal dimension further ;)

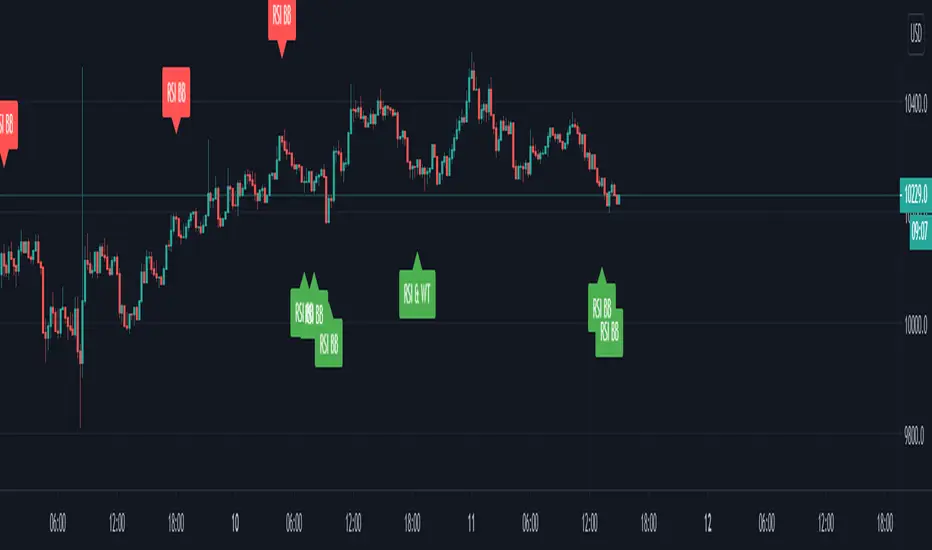
RSI combined with 3 different indicatorsThis is RSI combined with 3 different indicators that prints signals as a overlay
1. RSI cross Bollinger Band indicator that paints bgcolor short and long signals when the RSI cross's up through the lower bollinger band ( Long ) or cross's down through the upper bollinger band ( Short )
2. RSI and Wave Trend Dot combination
3. RSI and Directional Index Indicator combinations
You can turn on and off any of the signals, and have alerts for all 3, or individually
Please note the Range Filter code in the script is not part of the final signals as i have set the bars back 100, so thatis always that condition meet
Also please note there is still noise with this, you need to use with something else like MFI or VFI
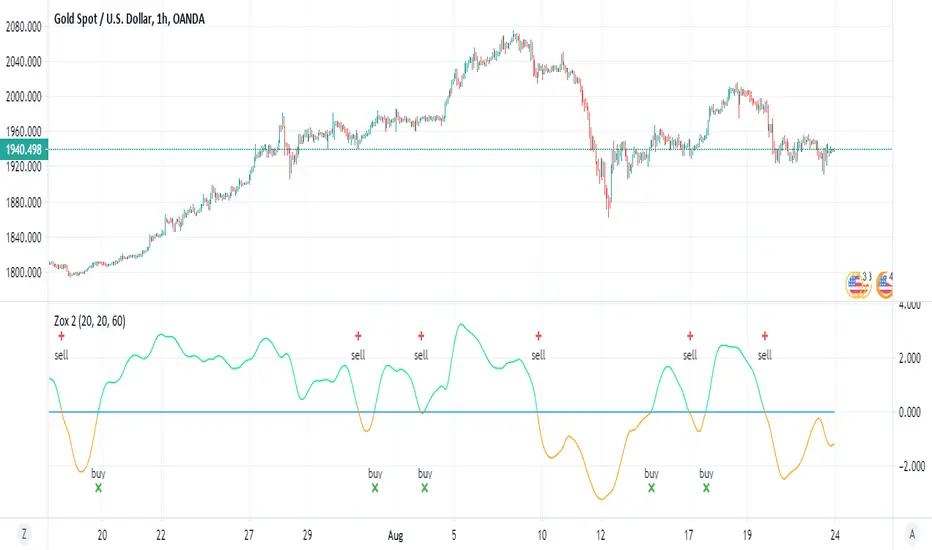
Zox 2very nice osccilator with buy and sell plus alerts
you can use minute Time to see if you get better rsults
I use part of lazy bear famous code of wave trend for the calculation of this script , most part is just my adaptation
when ever it zox 2 cross 0 it nuy and vice versa
we can see the signal and color color change from lime to orange and vice versa
FilthyIchiEMAXIchiEMAX has been backtested giving some great results, using Ichimoku and a mix of EMA'S/SMA .
I use this for both Cryptocurrency and Forex Trading.
Ema/SmaX system i have studied and have found it is giving me the results i want very similar to all the wave trend indicators being used currently. I have now adde buy/sell signals on crosses and williams fractal.

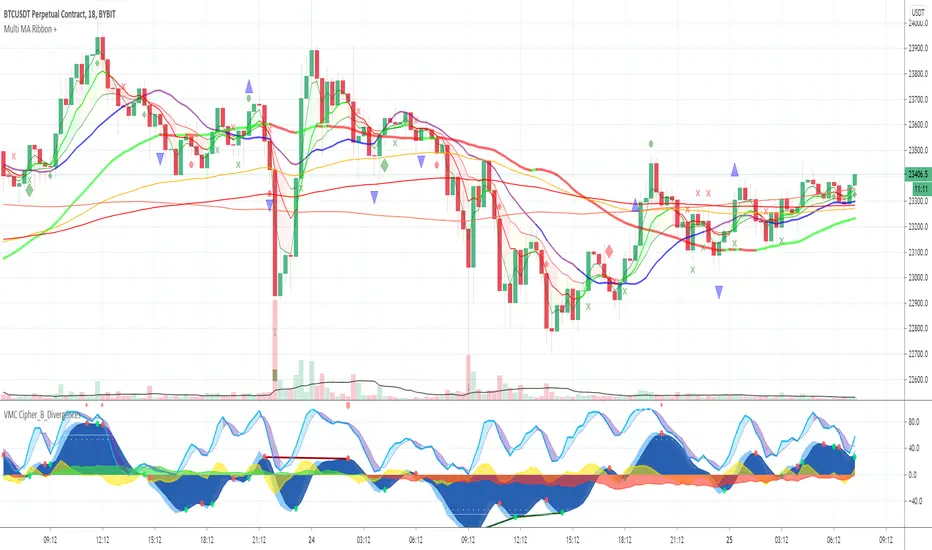
Multi MA Ribbon +Draws an MA Ribbon that highlights major MA's and for easier visibility separates them into different groups including Custom MA's, Baseline MA's, T Line MA's, Short Term MA's and Long Term MA's.
Choose between 11 different types of MA's thanks to JustUncleL and John F. Ehlers super smoother.
The + is for various signals and alerts derived from Market Cipher / Wave Trend indicators and TCG etc.
Happy Trading and remember just follow the flow of the river!
WaveTrend mtfThis is based on Lazy Bear famous script of Wave trend
So in basic we do MTF on it
One can choose to use the signal of the MTF (circles red or green for buy and sell)
or the regular buy and sell by cross green /red
to the script one can add if it cross the 0 above or bellow (not done here)
the MTF is taken from pinescripter example how to avoid repainting , so it good also for using your indicator to make MTF scripts
alerts included

Godmode 4.0.0 [Oscillator]First off, a huge thank you to the following people:
LEGION:
LazyBear: www.tradingview.com
xSilas: www.tradingview.com
Ni6HTH4awK: www.tradingview.com
sco77m4r7and:
SNOW_CITY: www.tradingview.com
oh92: www.tradingview.com
alexgrover: www.tradingview.com
cI8DH: www.tradingview.com
DonovanWall: www.tradingview.com
Since I've been on TradingView I've become somewhat enthralled by Godmode and the collective work that goes in to it, so I decided to publish my own iteration, building off the ideas already present. (This is a great way to get familiar with Pine by the way, just in case there are any beginners reading this)
Changes
The first change I made was to allow the user to select whatever tickerid they wanted as a benchmark. If trading XBTUSD on BitMEX for example, the indicator will react to exchange-specific activity, which means it will respond to all the little whipsaws, whipsaws that can be especially present on a futures exchange. By typing CRYPTOCAP:BTC or CRYPTOCAP:TOTAL we endeavor to remove noise. It can also signal earlier. Less noise and less lag. Another idea would be to choose a benchmark that has a strong inverse relationship with the asset you're trading: try CRYPTOCAP:USDT as the benchmark against BTC to see what I mean.
I also added the ability to smooth the plot, yet again removing noise but adding considerable lag.
The linear regression of the wave-trend is calculated in place of the EMA. This is plotted as columns with the midline (50) as the base. This is just calculating the slope of the wave-trend and can signal a weakening trend before a reversal takes place.
Using cI8DH's True RSI script () as inspiration, I added a function for calculating the True TSI in an attempt to remove any bullish bias. Funnily enough, when I tried to do the same with the RSI I had some problems. I'll try to resolve this in the coming weeks.
Made slight changes to the aesthetics. Tried to bring the two main plots alive by making their bold, opaque colors stand off the subtle tones in the background.
To Do List
1. I would like to sort out the issue with the True RSI.
2. When the plots are smoothed, there's an issue with the green 'Caution!' dots appearing in the lower half of the indicator.
3. I'd like to adjust the code so that if the 'Benchmark' box is empty, that it will automatically register the current tickerid as the 'Benchmark'.
If anyone has any suggestions on other fixes or how to apply the fixes mentioned by me, please don't hesitate to reach out to me here or through other media platforms.
Want to Learn?
If you'd like the opportunity to learn Pine but you have difficulty finding resources to guide you, take a look at this rudimentary list: docs.google.com
The list will be updated in the future as more people share the resources that have helped, or continue to help, them. Follow me on Twitter to keep up-to-date with the growing list of resources.
Suggestions or Questions?
Don't even kinda hesitate to forward them to me. My (metaphorical) door is always open.
BITMEX:XBTUSD
CRYPTOCAP:BTC
CRYPTOCAP:TOTAL
CRYPTOCAP:USDT.D

RSI Bollinger WaveTrend Cycle Multi Free TSPMulti indicator
Bollinger Band x RSI
Wave Trend
Cycles
Free users will like it :)
Fell free to like share comments... and check my other stuff :]
