Week & Day Boxes Projected forward; with day-of-week labelsProjecting Week and Day boxes forward into the future, as an aide in framing the shape/profile of the coming week(s)/day(s).
////user inputs////
~toggle on/off daily and/or weekly boxes.
~input number of 2week blocks or number of 2day blocks to project forward.
~independently format colors and opacities of weekly and daily boxes.
~toggle on/off day-of-week labels (if you just want day labels, make opacity of day boxes&borders zero).
////notes////
-I have limited the project-forward numbers to keep it neat. If you want to play around with them, edit UP the FIRST integer in lines 56, 58, 62, 64 (currently set to 11,10, 41, 40 respectively). And edit UP maxvals in lines 9 and 15.
-To change the height of weekly and/or daily boxes, tweak the SECOND integer in lines 56, 58, 62, 64.
-Written for ES (S&P); tested/working on FX and BTC too.
-Starts painting/Resets at the beginning of a new week (i.e. Sunday eve).
-Sunday is blended into Monday; day's are defined as finishing at 6pm (New York Time).
Search in scripts for "weekly"

Multi TF High/Low/Open/Close LineNOTE: I'm not sure why the screengrab isn't showing the lines. They are there, and when I share the chart from this link they are there.... idk
This is a requested spin-off version of my previous HLOC for the Daily/Weekly/Monthly that allows users to choose 3 different timeframe units (Mins, Hours, Days, etc...) from the dropdown menu and then select the lookback period in which to draw the HLOC.
I've had quite a few requests to allow users to see multiple lookbacks for the same timeframe unit, mostly weekly, and I did not wish to change that particular script for that purpose. However, I was able to take the existing script and alter it for user input.
This indicator draws a line on the TF 1, TF 2, and TF 3 bar at the High, Low, Open and Close of user input Timeframe unit and selected lookback period.
The lookback period will go back the number of candles entered. So for example if you choose a 5 Min chart with a lookback of 3, the lines will be drawn on the HLOC 3 closed 5 min candles back. Selecting 0 will show data on the current Real-Time candle.
An example of a request I have gotten was for last week, the previous week and the previous month. The settings for that would be: TF 1 - 1 week Lookback 1, TF 2 - 1 week Lookback 2, TF 3 - 1 month Lookback 1.
Each set of lines has an optional identifying label with its own color set that can be shown with or without price value, and has drop down menus for size and style of each set of labels. The TF unit value is displayed on the label, but not the lookback.
So if you are using the hourly on all 3 TF's with different lookback periods, they will all say "60" on the label.
I recommend using the line and label options to distinguish between the different lookback values.
Each set of lines has inputs for line/text color, line width and style and each line argument can be selected independently.
In the chart example I have displayed only the High and Low on three 1 hour TF's with the lookback of 4, 5 and 6 candles with the labels descending in size. With this data I can see that over the last 6 hours the price of ES is in an descending pattern and I should be on alert for a break.
Since I trade ES in RTH on a much lower timeframe, this data can alert me to a bigger picture potential trend change or continuation. I would personally use this with pivot data for timing and look for entries in areas of high volume that moved price to a new
high or low that have not been retested.
I will be looking to add a user input offset for labels in the future. I have had bad luck with it in the past working for a couple weeks and then throwing an error, but I will look into it again soon.
I also recommend going into Chart Settings/Status Line and turning off indicator arguments OR moving the script to the top of the indicator list to avoid obstructed chart view with this indicators arguments. When script allows, I will update it to hide them.

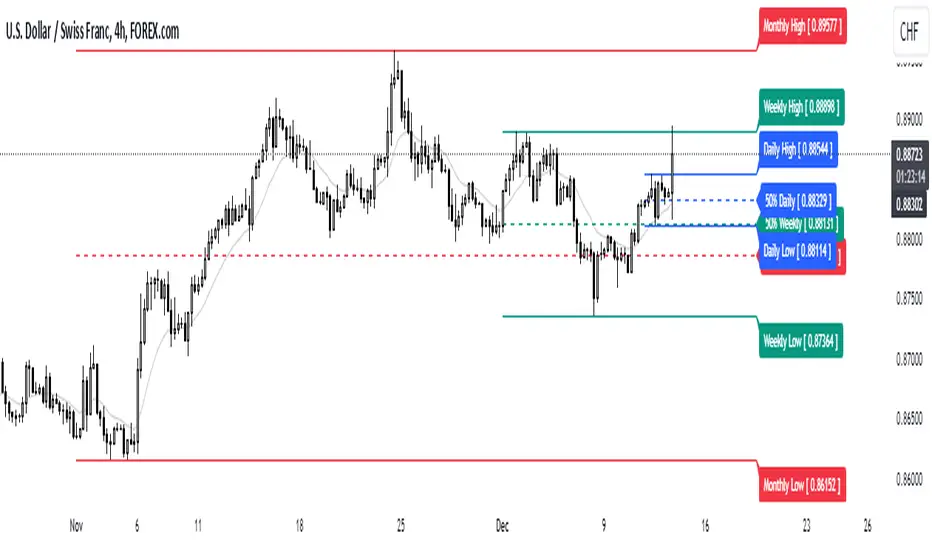
Strongholds - Objective & Accurate Reference Points / StructuresVery early in my trading career, I came across Pivot Points only to find out that there are as many calculations as one pleases. It was hard to find out which ones work. Most of them probably did only out of randomness, so I ditched the strategy and looked for something else.
I previously used my Oracle Eye and Reference Points scripts but it is time for an upgrade.
Stronghold is a script I have used for quite some time now. I ditched daily and weekly closing prices as not that important. Instead, Strongholds are equipped with:
►Daily High & Low • Azure color
►Weekly High & Low • Dark blue
►Weekly old High & Low • Semi-transparent dark circles
►Monthly High & Low • Wizardly purple
There is an option to print:
►4h High & Low • Semi-transparent red
►VWAP • Lovely purple
►Weekly VWAP • Black
All of the levels and lines are set for 1m, 5m, 10m, 15m, 30m, 1h, 4h, 1D timeframes. If you use any alien timeframe, you may need to enter the code.
You can opt-in and out for certain timeframes. For example, daily levels are visible from 15m or 30, so the indicator won't draw them unless you want to. However, they will not be seen on higher timeframes as there is no reason to show them and oversaturate the chart with lines.
▬▬▬▬▬▬▬▬▬▬▬▬▬▬▬▬▬▬▬▬▬▬
Remember that if you use this script with auto-scale, you need to tick Scale Price Chart Only . Otherwise, your chart will fly to the moon!
Good luck & have fun!

Chart-prepFxxDanny Chart-Prep
A practical multi-tool script for clean and structured chart preparation.
✨ Features
Weekly Close Levels
Automatically plots the previous week’s close and the week before that, with clear styling to distinguish current and past levels.
Trading Sessions
Colored session boxes for the three key market sessions:
Asia (20:00–23:00 UTC-4)
Europe (02:00–05:00 UTC-4)
New York (08:00–11:00 UTC-4)
Each session box automatically adapts to the session’s high/low range and only keeps the last 5 visible to avoid clutter.
Previous Day’s High & Low
Plots the prior day’s high and low with lines that extend into the current session. Up to 10 days are kept on the chart.
Daily & Weekly Separators
Vertical lines to visually separate days (dotted) and weeks (solid, colored).
Anchored to a rolling price window so the Y-axis scaling stays clean and unaffected.
✅ Benefits
Stay focused with key price levels and session ranges marked automatically.
No need for manual drawing or constant adjustments.
Optimized performance – old objects are automatically removed.
No axis distortion from “infinite” lines or boxes.

Fabian Z-ScoreFabian Z-Score — % Distance & Z-Scores for SPX / DJI / XLU
What it does
This indicator measures how far three market proxies are from a moving average and standardizes those distances into z-scores so you can spot stretch/mean-reversion and relative out/under-performance.
Universe: S&P 500 (SPX), Dow Jones (DJI) and Utilities (XLU). You can change any of these in Inputs.
Anchor MA: user-selectable MA type (SMA/EMA/RMA/WMA/VWMA/HMA/LSMA/ALMA) and length (default 39; a popular weekly anchor).
Outputs
% from MA: 100 × (𝐶𝑙𝑜𝑠𝑒 − 𝑀𝐴) / 𝑀𝐴
Time-series Z: z-score of the last N % distances (default 39) → “how stretched vs its own history?”
Cross-sectional Z: z-score of each % distance within the trio on this bar → “who’s strongest vs the others right now?”
A compact mini table (top-right) shows the latest values for each symbol: % from MA, Z(ts) and Z(xsec).
Panels & Visualization
Toggle what you want to see in View:
Plot % distance — raw % above/below the MA (0% line shown).
Plot time-series Z — standardized stretch with ±Threshold guides (default ±2σ).
Plot cross-sectional Z — relative z across SPX, DJI, XLU (0 = at the trio’s mean).
Smoothing — optional light MA on the plotted series (set to 1 for none).
A price-panel Moving Average is drawn with your chosen type/length for visual context.
Colors: SPX = teal, DJI = orange, XLU = purple.
Alerts
Two built-in alert conditions (time-series Z only):
“Z(ts) crosses up +Thr” — any of the three crosses above +Threshold.
“Z(ts) crosses down -Thr” — any crosses below −Threshold.
When enabled, the chart background tints faint green (up cross) or red (down cross) on those bars.
How to use (ideas, not advice)
On weekly charts, a 39-length MA/Z lookback often captures major risk-on/off swings. (Fabian Timing)
Deep negative Z(ts) (e.g., ≤ −2σ or −3σ) frequently accompanies panic and mean-reversion setups.
High positive Z(ts) suggests over-extension; watch for momentum fades.
Cross-sectional Z helps rank leadership today:
Z(xsec) > 0 → stronger than the trio’s mean this bar; Z(xsec) < 0 → weaker.
Utilities (XLU) turning positive x-sec while the others are negative can hint at defensive rotation.
If all 3 are above 0, go long, if below 0 go cash.
Combine: look for extreme Z(ts) aligning with lead/lag Z(xsec) to time entries/exits or hedges.
Inputs (quick reference)
Symbols: SPX / DJI / XLU (editable).
MA type & length: SMA, EMA, RMA, WMA, VWMA, HMA, LSMA, ALMA; default EMA(39).
Z-score lookback (ts): default 39.
Smoothing on plots: default 1 (off).
Z threshold (±): default 2.0 (guide lines & alerts).

High/Mid/Low of the Previous Month, Week and Day + MAIntroducing the Ultimate Price Action Indicator
Take your trading to the next level with this feature-packed indicators. Designed to provide key price insights, this tool offers:
- Monthly, Weekly, and Daily Levels : Displays the High, Midpoint, and Low of the previous month, week, and day.
- Logarithmic Price Lines : Option to plot price levels logarithmically for enhanced accuracy.
- Customizable Labels : Display labels on price lines for better clarity. (This feature is optional.)
- Dual Moving Averages : Add two customizable Moving Averages (Simple, Exponential, or Weighted) directly on the price chart. (This feature is optional.)
This code combines features from the Moving Average Exponential and Daily Weekly Monthly Highs & Lows (sbtnc) indicators, with custom modifications to implement unique personal ideas.
Perfect for traders who want to combine precision with simplicity. Whether you're analyzing historical levels or integrating moving averages into your strategy, this indicator provides everything you need for informed decision-making.
To prevent change chart scale, right click on Price Scale and enable "Scale price chart only"
Week designationThe script is primarily used for visualizing the beginning and end of the week. It is particularly helpful when working with time intervals shorter than one day. In a very simple and clear manner, you can see when a specific week has started. This makes it easier to assess the market sentiment in a short timeframe.
Here are the operating principles of this script:
Initialization:
The script begins with initialization, where basic parameters and settings such as line colors and line style are defined.
Determining the Session Start:
The startSession(hour, minute) function is used to calculate the starting time of a session on the chart. Sessions can be divided into different time intervals, such as the daily session (D), weekly session (W), and monthly session (M).
Checking for Session Start:
The script checks if a new session is starting. If so, a vertical line is inserted on the chart to mark the beginning of that session.
isSessionStart checks for the start of the daily session.
isSessionStart_2 checks for the start of the weekly session.
isSessionStart_3 checks for the start of the monthly session.
Marking Mondays:
The script checks if the current day is Monday (the day of the week number 2 represents Monday).
If the current session is starting or it is Monday, a vertical line is inserted on the chart with the day designation (color color_day).
Marking Lines on the Chart:
The lines inserted on the chart are vertical and have a specified style and color, which can be customized in the settings.

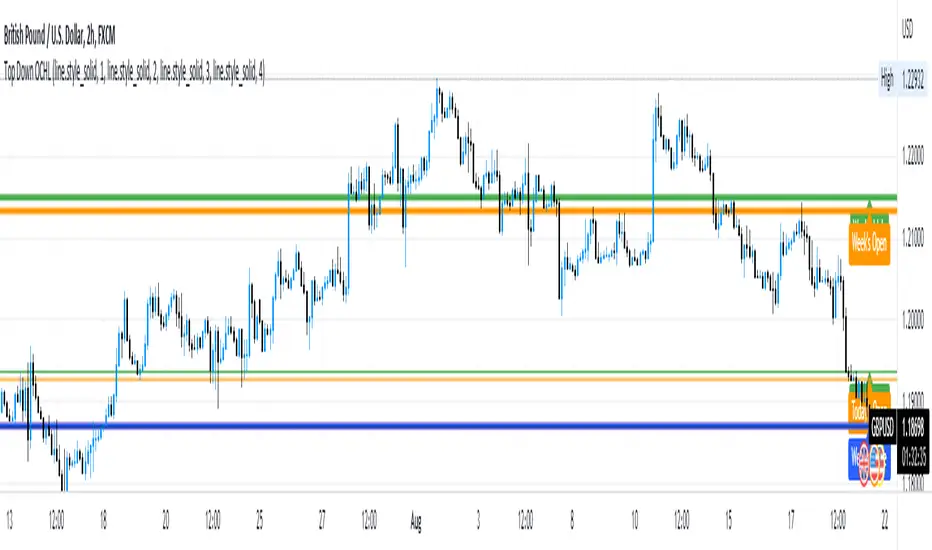
Opens, Closes, Highs and Lows.Hello Traders, the script below is designed to display the monthly, weekly, previous days' and current days' open, close, high and low.
I designed it to assist in top down analysis by knowing the monthly and weekly opens and closes it makes it a lot easier to make trading decisions on the lower timeframes.
As the user you can choose which price values you'd like displayed on the chart by selecting them in the user inputs.
Enjoy!!
Indicator Daily-Weekly-Range-In-PriceSpecification: Indicator Daily-Weekly-Range-In-Price helps traders to easily identify the price movement of a range that goes from highs to lows in a specific timeframe. Range price can be chosen between daily or weekly. It can be integrated with strategies giving us more information abot price movement.
Name:Daily-Weekly-Range-In-Price
Category: Mean Reversion. Range Trading
Timeframe: From weekly below, depending on the specific technique.
Technical Analysis: The indicator uses price action from daily to weekly using highs/lows to detect the range movement.
Suggested usage: Every Market especially for Swing Trading Operativity.
Daily-Weekly-Range-In-Price Indicator can identify automatically the range between highs and lows from weekly to minor timeframes with labels on the charts and an histogram helping shown on the chart to easily identify the volatility range juat at one glance.
Highly Dinamic Inputs Settings: Timeframe can be changed from the input options, labes indicating the range in price will change automatically.

Bollinger Band with Moving Average & Pin BarsThis indicator was specifically built to be used for trading the Scalpius Trading System promoted by @scottphillipstrading. Additionally I've added Daily and Weekly Highs, Lows and Central Pivot lines
The central indicators used in the Scalpius trading system which are included here are: The Bollinger Band, chart plotting of Pin Bars (Hammers & Shooting Stars) and an Exponential Moving Average.
In the settings the user has the option select EMA, SMA or WMA along with desired length, the default settings are 8EMA as per the Scalpius system rules. Also the Bollinger Band settings can be amended by the user and the Pin Bar chart plots and daily + weekly high and low plots can be removed by the user.


VWAP Balance Zones - SessionsVWAP Balance Zones Sessions Version is an alternate take on the Original VWAP Balance Zones indicator. The Sessions version allows users to select a specific session to view the VWAP Balance Zones at while still utilizing the full ETH Data.
The Session version provides a better focused display while still maintaining the core functions of the original script with mindful optimizations.
Author's Note: "VBZ Sessions was made with logistics in mind, for the users who only trade within certain times of the day. While it displays the same core concepts, it is not as "Raw" of a display as the Original. For this reason, some users may prefer the Original VWAP Balance Zones, which is why I have opted to release this alternate version instead of updating the original."
> What are VWAP Balance Zones?
"VWAP Balance Zones" is an original concept aimed at identifying the equilibrium area between market participants within the current trend by averaging the Daily Extremes and the Daily VWAP.
Refer to the illustration below for a better understanding of exactly how VWAP Balance Zones are formed:
These zones are displayed for the Daily, Weekly, and Monthly VWAPs, with the most interactive timeframe being the Daily.
> Features
1. The Session Version uses ETH data at all times, and does not solely rely on the chart's data to create the VWAPs or Zones.
This allows the user to focus on a specific trading session, while not losing out on the full VBZ Calculation, with the notable benefit of a cleaner display.
The Original VBZ starts drawing at the beginning of the chart's "Day", and would produce different results when using an RTH chart vs an ETH chart. Along with creating a bird's nest of unusable data at the beginning of the day.
2. Session Start and End lines are displayed for easier identification of the designated trading session.
3. The extreme "Close" Lines are no longer displayed to reduce noise and redundancy.
4. Additionally, the interior VWAP lines are no longer displayed. Ultimately, this was to reduce noise and focus the script on the 50% zones.
5. Weekly and Monthly Zones are now displayed due to the reduced noise!
6. As with the original, the weekly display will yield to the daily, and the monthly display will yield to the weekly.
In the screenshot below, you can observe this behavior.
Enjoy!

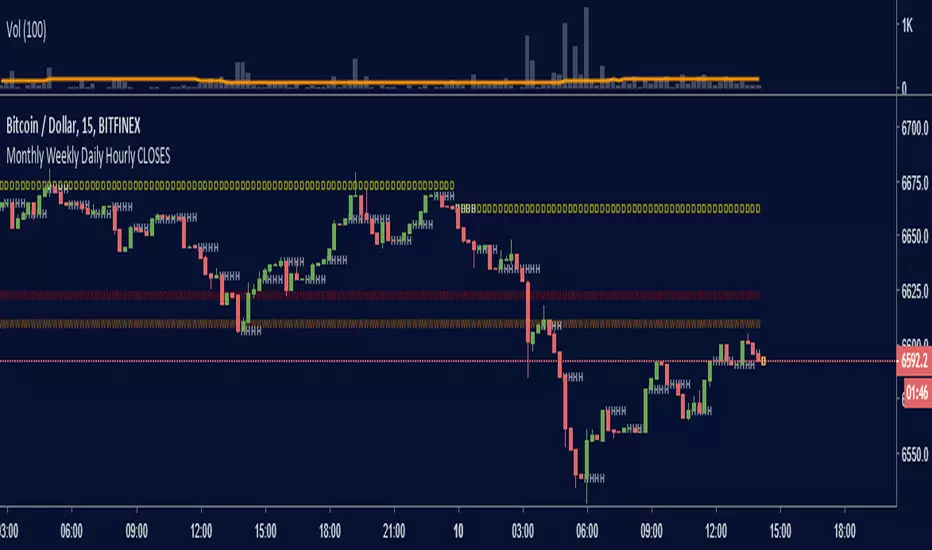
Monthly Weekly Daily Hourly CLOSESDraws horizontal segments where the last Monthly, Weekly, Daily and Hourly closes are.
Easily identify current price relative position to these key prices.
I use it as a kind of pivot points and help me with trend following entries: longs if up from last close, shorts if down from last close.
Monthly: red line (MMMMM)
Weekly: orange line (WWWWW)
Daily: yellow line (DDDDD)
Hourly: white line (HHHHH)
//Original idea from "Key Levels
Furious PivotsSimple script marking out quarter points plus weekly and daily highs and lows! pretty damn useful

Previous Day, Week, Month High/Low Line IndicatorMade a line indicator for previous Daily Weekly & Monthly High / Low. You can use all 3 (D,W,M) or just one by editing the settings.

MAGNUS® CyclesThis indicator will help you if you struggle making any profit in bitcoin.
It generates very few signals with very nice profit potential ( around 100% this year ! ).
Perfect tool for longterm swing traders and new traders that need help figuring out the midterm trend.
Use it with these parameters only:
weekly: 13, 5, 12
daily: 92, 21, 96

Short-Term Weekly Refuges (Shelters)## // Introduction //
══════════════
Short-Term Weekly Refuges (Shelters) (WR or RS) is a structural analysis indicator designed to track price action during the current week. It combines a configurable ZigZag with Fibonacci retracements anchored to recent phases, using the Weekly Opening Price (W.O.P.) as a key reference level.
This indicator is optimized for 4H timeframe but also works on 1H and 15min charts.
## // Theoretical Foundation of the Indicator //
═══════════════════════════════
The WR (RS) indicator provides a structural framework for following price action during the current trading week.
The core concept: Recent ZigZag phases, combined with the Weekly Opening Price, create dynamic support and resistance levels that institutional traders often monitor and use for intraweek positioning. The indicator allows you to select which recent phase (1-10) serves as the Fibonacci anchor.
## // Indicator Objectives //
══════════════════
1) Display a configurable ZigZag showing recent price structure with numbered phases (1 = most recent). Users should configure the ZigZag parameters based on whether they are analyzing a Major Degree Pattern (larger swings, less noise) or a Minor Degree Pattern (smaller swings, more detail), following standard Elliott Wave terminology. Configure the ZigZag to match the degree of your analysis: use higher Depth values for Major Degree Patterns, or lower values for Minor Degree Patterns.
2) Draw Fibonacci retracements on a user-selected phase, with two modes:
• "On ZigZag": Traditional Fibonacci on the selected phase.
• "Relative to W.O.P.": Fibonacci from phase anchor (i0) to Weekly Opening Price.
3) Show Weekly Opening Price lines as horizontal references, with the current week's line extended into the future.
4) Provide Pivot Up/Down markers for additional confirmation of local highs and lows.
5) Support multiple simultaneous indicator loads with visual identifier labels to distinguish between different analysis degrees (e.g., "Major Degree Pattern" vs "Minor Degree Pattern").
6) Optional Embedded Indicator: Enable Intraday Shelters (RID) - percentage-based support/resistance levels calculated from the Daily Opening Price, useful for 1H and 15min trading.
## // Key Features //
══════════════
• **Flexible ZigZag**: Adjustable Depth, Deviation, and Backstep parameters to adapt to any asset's volatility.
• **Phase Selection**: Choose from the 10 most recent phases for Fibonacci anchoring.
• **Dual Fibonacci Modes**: Trace on the ZigZag phase itself, or relative to the Weekly Opening Price.
• **New Age Color Palette**: Professional Fibonacci color scheme used by old school experienced traders.
• **Weekly Opening Price (W.O.P.)**: Historical weekly opens plus current week projection.
• **"Show Only W.O.P." Mode**: Isolate just the Weekly Opening Price line for cleaner charts on non-4H timeframes.
• **Optional Intraday Shelters (RID)**: 11 percentage levels (±0.382%, ±1%, ±1.5%, ±2%, ±2.5%) based on Daily Opening Price.
• **Multi-Load Support**: Visual identifier tags and Large Label for running multiple indicator instances simultaneously.
## // Recommended Workflow //
═════════════════════
1) Load the indicator on a 4H chart.
2) Adjust ZigZag parameters (Depth, Deviation) until the phases match your visual analysis of recent price structure.
3) Select the phase you want to use as Fibonacci anchor (typically Phase 2, 3 or higher).
4) Choose Fibonacci mode: "On ZigZag" for phase analysis, or "Relative to W.O.P." for analysis based on weekly opening price context.
5) Monitor how price interacts with the Fibonacci levels and Weekly Opening Price throughout the week.
6) Optionally enable RID for intraday precision on 1H or 15min charts.
## // Integration with Other Refuge Indicators //
════════════════════════════════
WR (RS) is part of a complete refuge-based analysis ecosystem:
• LTR (RLP) (Long-Term Refuges): For automatic determination of the predominant phase of a ZigZag, which institutional investors choose as the basis for a Fibo whose levels calculate the projection for order placement over the following months and years.
• LTRS (RLPS) (Simple Long-Term Refuges): Simplified version of LTR in which the known coordinates of the predominant phases (obtained with the LTR indicator) of one or up to five assets are easily captured for permanent long-term operation.
• WR (RS) (Short-Term Weekly Refuges): (This indicator) For short-term tactical analysis (4H, 1H) based on chosen phases of a ZigZag that define Fibo levels generated during the near past week(s) and probably effective in the present week.
• IDR (RID) (Intra-Day Refuges): For daily operations relying on intraday levels on timeframes of 1H or less. Ideal for scalping traders.
By combining LTR, LTRS, WR and IDR, you obtain a multi-level framework that allows you to operate with clarity at any time horizon, from intraday positions to investments spanning months and years.
## // Additional Notes //
════════════════
1) Default parameters are optimized for volatile assets (crypto, tech stocks). For forex or less volatile instruments, consider reducing Deviation to 3-8%.
2) The "Phase in Development" (dashed line) shows the tentative current ZigZag segment that may still change as new bars form.
3) Bug reports, improvement proposals for the ZigZag generator, pattern determination, or Fibo composition, etc., will be greatly appreciated and taken into account for a future version. Best regards and happy hunting.
(Sorry: Spanish translation erased trying to avoid confusing publishing banning rules).

TQ Silver / Gold (Weekly Macro)This indicator tracks the Silver / Gold ratio on a weekly basis to determine whether silver is leading gold (risk appetite returning inside metals) or gold is leading silver (a more defensive precious-metals posture).
Within the TQ Weekly Macro Framework, this indicator is designed to be used after confirming the broader macro environment using TQ Gold Trend (Weekly Macro), TQ Gold / DXY (Weekly Macro), and TQ Gold / SPY (Weekly Macro).
Why Silver / Gold matters
>When Silver / Gold rises, silver is outperforming gold — often associated with reflation, growth expectations, or broad risk appetite within precious metals.
>When Silver / Gold falls, gold is outperforming silver — often associated with defense, uncertainty, or tighter financial conditions.
>This ratio is not a timing tool — it is a regime and leadership indicator within the metals complex.
How it works (regime rules)
Using weekly data:
Compute Silver ÷ Gold
Apply a 30-week SMA
Regime definitions:
Bull: Ratio above a rising 30-week SMA (silver leading)
Bear: Ratio below a falling 30-week SMA (gold leading)
Neutral: Transition / range
A clear label marks the current regime.
How to use it in your system
Use after confirming:
TQ Gold Trend (Weekly Macro)
TQ Gold / DXY (Weekly Macro)
TQ Gold / SPY (Weekly Macro)
> If Silver / Gold is Bull, metals participation is broadening and silver often has more upside torque.
> If Silver / Gold is Bear, gold leadership is defensive and silver exposure may underperform.
> Neutral often signals rotation or consolidation.
Best timeframe
Designed for weekly macro regime analysis.

ICT Weekly Lines [OPEN/MID]This indicator plots two core weekly reference levels:
- Weekly Open: the opening price of the current confirmed week (a common “weekly anchor”).
- Weekly Mid: the 50% level of the previous confirmed week’s range.
Why weekly levels matter
Weekly levels act like “macro structure” on lower timeframes. Even if you trade 1m–15m, price often reacts around weekly anchors because they’re widely watched and represent higher-timeframe positioning.
Practical use cases
1. Directional bias filter
- Above Weekly Open → bullish tilt / “premium” willingness.
- Below Weekly Open → bearish tilt / “discount” willingness.
2. Mean reversion vs continuation
- Weekly Mid often behaves like a “magnet” in balanced conditions.
- Strong trends can use it as a “pullback boundary” (hold mid → continuation, reclaim mid → reversal attempts).
3. Stop/target structure
- Weekly Open/Mid can act as logical target zones or invalidation lines because they’re higher-timeframe derived.

Master Accumulation Weekly Buy SignalsMaster Accumulation Weekly Buy Signals
The Master Accumulation Weekly Buy Signals indicator is designed to help traders identify potential buy opportunities based on the accumulation and distribution of volume, with a primary focus on weekly timeframes. This indicator combines the On Balance Volume (OBV) and the Accumulation/Distribution (AD) indicators to generate buy signals when both metrics show a decline.
Key Features:
Percentage Change Calculation: Calculates the percentage change in OBV and AD over a specified length tailored to weekly timeframes.
Timeframe Adaptability: While optimized for weekly timeframes, the indicator can also adjust to daily and monthly charts.
Volume Validation: Ensures that volume data is available and valid for accurate calculations.
Buy Signals: Generates buy signals when both OBV and AD percentage changes are negative, indicating potential accumulation by informed traders.
Visual Alerts: Plots buy signal triangles below the price bars on the main chart for easy identification.
How It Works:
On Balance Volume (OBV): Tracks the cumulative volume, considering the direction of price changes, and calculates the percentage change over the specified period, primarily for weekly analysis.
Accumulation/Distribution (AD): Measures the flow of volume into or out of a security, considering the relationship between the closing price and the high-low range, and calculates the percentage change over the specified period, primarily for weekly analysis.
Buy Signal Generation: A buy signal is generated when both OBV and AD show a negative percentage change, suggesting a potential buying opportunity.
How to Use:
Apply the indicator to your chart and select the weekly timeframe for optimal performance.
Look for buy signal triangles that appear below the price bars on the main chart.
Use the buy signals as part of your broader trading strategy, confirming them with other technical analysis tools and indicators.
Important Note:
This indicator is a tool to assist in identifying potential buy signals based on volume accumulation patterns. It is primarily designed for weekly timeframes and should not be used as a standalone trading strategy. Always perform comprehensive analysis and consider risk management practices before making any trading decisions.
This description highlights the indicator's primary focus on weekly timeframes while providing comprehensive information about its features and usage.
THIS IS TEST ONLY*******

RD Key Levels (Weekly, Daily, Previous vWAP)The RexDog Key Levels indicator plots the weekly open, daily open, and the previous day vWAP close.
These are all critical price levels (zones) to know when trading any market or instrument. These areas are also high probability reaction areas that you can trade using simple confirmation trading patterns.
First, I'll cover an overview of the indicator then I'll share general usage tips.
Weekly Open - default is white/orange. White is when price is above the weekly open. Orange is when price is below the weekly open.
Weekly High/Low - there are options to turn on the weekly high and lows. Default plot is circles. Green is the high. Red is the low.
Daily Open - default is green/red. Green is when price is above the daily open. Red is when price is below the daily open.
Previous vWAPs - aqua single lines. These are the closing price of the daily vWAPs.
Top Indicators - The triangles at the top of the chart signify is price is currently above or below the weekly open. This is helpful on lower timeframe charts (5m, 15m) to get a quick indication when price is far extended beyond the weekly open. Green triangle = above weekly open. Red triangle = below weekly open.
General Usage
Each one of these levels are important levels markets look use for continuation or failure of momentum and bias. I also find it extremely helpful to think of these levels as magnets, dual magnets. They both attract and repel price at the same time. Now you might say, how is that helpful to have opposing views at the same time? Be indifferent to direction, create your own rules on when these price zones repel or attract price, I have my own.
Here's the easiest way to use these price levels.
As price approaches one of these levels to expect a reaction. A reaction is price is going in one direction and price hits a price level zone and reacts in the opposite direction.
These are price zones, sometimes you will see a reaction right at the price but visualize these areas as zones of reaction.
A high percentage of the time when price approaches these level zones there will be a reaction. So trade the reaction .
How do you do that?
Simple. Trade patterns that repeat. I have 3 solid patterns I trade around these key levels:
The first pattern is early entry with precise scale in rules and a very effective protective stop loss placement.
The second pattern is wait for confirmation that the level holds. This requires more patience and for you to fully trust the chart. The benefit of this pattern is with confirmation you have even more precise stop placement.
There is a bonus third pattern I trade around these levels. I call this the confirmation and bluff entry. It's a combination of both of the patterns above. You wait for confirmation but on any pull back you call the bluff on the market and enter on key test. Trade management here is critical. In addition to the pattern you trade you should have a series of failure patterns that tell you to get out of the trade, I use 2 primary failure patterns.
I trade all markets, same system, same rules, so I'll show a few examples.
Usually I start with Bitcoin but let's start with equities:
BA - Boeing - 8 Trades
Here we see weekly low patterns, previous week low test, vwAP hold patterns, day magnets and day holding. Then 2 week failures and a double hold pattern.
These are all straightforward trades to execute following really simple patterns.
BTCUSD Previous vWAP and Day Open Trades
We see here on the circle areas both daily open and previous day vWAP zone tests. Within this chart are all 3 highly effective patterns I trade.
SPY - 7 High Probability Trades
Here we see a pDay vWAP mixed with a daily failure. Next a daily retest, then a pDay vWAP failure, then a vWAP capture and test. Then a double weekly failure test (great trade there) and finally a daily test.
I could provide more examples but most are just derivatives of the above examples.

Daily & Weekly Levels (Sticky + Individual Alerts)🚀 Sticky Levels: PDH/PDL & Weekly High/Low
💡 Overview
This lightweight Pine Script v6 utility is designed for high-frequency traders and scalpers who require key Daily and Weekly levels without cluttering their price action. Optimized for speed and clarity, it ensures your most important S/R zones are always exactly where you need them.
🌟 Key Features
📌 Sticky Right Alignment – Labels are anchored to the right price scale using a customizable offset. They stay perfectly visible on mobile devices (Android/iOS) regardless of zoom level or scrolling.
⚡ Performance Optimized – Specifically built for low timeframes (15s, 1m, 5m). By using barstate.islast and tuple-based request.security calls, it ensures zero lag and minimal resource usage.
📅 Daily Levels – Instantly plot Previous Day High (PDH) and Previous Day Low (PDL).
🗓️ Weekly Levels – Monitor Previous Week High (PWH), Previous Week Low (PWL), and Current Weekly Open (WO).
🔔 Individual Alert Management – Granular control over notifications. You can manually enable/disable alerts for each specific level to avoid "alert fatigue."
💎 Clean Visuals – Uses elegant dashed lines and non-intrusive labels with an optional price display for pinpoint accuracy.
🛠️ How to Customize Your Setup
1. Visibility & Visuals
Toggle Levels: Turn each level on or off independently in the settings.
Label Offset: Adjust the "3cm" margin by changing the bar offset to fit your screen perfectly.
Price Toggle: Show or hide exact price values next to the labels.
2. Individual Alert Toggles In the settings menu, you will find a 🔔 icon next to each level. You can manually choose which specific levels should trigger a notification:
Enable PDH alerts for breakout trades.
Keep Weekly Open alerts off if you only use it as a visual bias.
Focus only on what matters for your strategy!
❓ Why use this script?
Standard horizontal lines often disappear when you scroll back in time or clutter the immediate price action on lower timeframes. This script solves that by keeping labels fixed at the right margin, providing a professional trading interface similar to high-end institutional platforms. Whether you are at your desk or trading on the go, your key levels remain clear and "sticky."
🚦 Quick Setup Guide
Add to Chart: Save the script and add it to your favorite symbols.
Configure: Open settings and check the "Alert" box for your desired levels.
Create Alert: Press Alt+A, set Condition to this indicator, and select "Any alert() function call".
Trade: Receive precise, non-spammy notifications directly to your phone or desktop.

Options X-Level Lock Tracker (Weekly Fri PM)What this indicator is
Options X Lock Tracker is a weekly trade‑management dashboard for defined‑risk premium selling where the “trade thesis” is primarily about finishing on the correct side of a single level (X) by expiration. In this framework, X is the short strike (the “line”) you sell, and the goal is to remain on the correct side of X through settlement.
This script helps you:
Compute candidate PUT X and/or CALL X levels using a volatility‑based model,
Lock those X levels on specific weekdays (Mon/Tue/Wed),
Track touches/breaches during the week, and
Evaluate win/loss at weekly settlement.
Core features
1) X‑Level computation (PUT and/or CALL)
Can compute PUT X, CALL X, or both.
Can use a target delta approach or a 1‑sigma move approach.
Volatility input can be HV (log returns) or ATR, with configurable lookback lengths and caps/floors.
2) Expiry / settlement controls
Settlement is aligned to next Friday with a configurable timezone + settle hour/minute (e.g., Fri 16:00 New York).
3) Strike rounding + optional “snap”
Rounds strikes to your chosen strike increment (e.g., 5‑point spacing for index products).
Optional “snap” can align X to nearby prior daily/weekly key levels (H/L/C/Mid) rather than purely model output.
4) Locking workflow (Mon / Tue / Wed)
You can enable locking on Monday, Tuesday, and/or Wednesday.
Locks occur on the daily close (confirmed bar), and once locked, the level is held for the week.
5) Visual plotting
Plots the locked X levels as horizontal lines extended to the right:
PUT lines are solid, CALL lines are dashed, and
Lines are color‑coded by lock day (Mon/Tue/Wed).
6) Touch/Breach tracking
Tracks whether price touched/breached the locked X during the week (after the lock moment).
7) Friday settlement result (win/loss)
On Friday’s confirmed close, evaluates results:
Short PUT considered a win if settle > put strike
Short CALL considered a win if settle < call strike
8) Table dashboard (weekly “control panel”)
The table is meant to be your weekly at‑a‑glance tracker. For each lock day and each side it can show:
Locked strike (X),
“Now” distance from price,
Touch status,
Settle status (once Friday passes),
W% = a real‑time probability estimate (normal approximation).
Important: W% is a real‑time probability estimate, not a historical win‑rate backtest.
9) RSI context + RSI alerts
Optional RSI context in the table and RSI‑based bias framing.
Includes alert conditions for RSI crossing above/below 50 (useful for regime shifts).
Recommended chart setup / best practices
This tracker is intentionally built around daily locking, and is designed for 1D charts where the lock event is the daily close.
Make sure your settlement timezone/time matches the product you’re trading (and your intended settlement convention).
If you trade instruments with different strike spacing, update Strike increment accordingly.
Limitations / notes
Probability outputs (W%) are model estimates and can diverge from real option pricing (skew, kurtosis, jumps, event risk, liquidity, etc.).
This is a decision support / tracking tool. It is not an automated execution system, and it does not include slippage/fees in outcomes.
Disclaimer
This indicator is for educational and informational purposes only and does not constitute financial advice. Options involve substantial risk and are not suitable for all traders. Always use defined risk controls and trade within your plan.
