[TTI] Closing Range Indicator📜 ––––HISTORY & CREDITS––––
This Pine Script Utility indicator, titled " Closing Range Indicator," is designed and developed by TintinTrading but inspired by the teaching of Investor's Business Daily (IBD) and William O'Neil. It aims to help traders identify the closing range of a given timeframe, either daily or weekly.
🦄 –––UNIQUENESS–––
The unique feature of this indicator lies in its ability to simulate a functionality of Closing Range calculation based on hovering of the mouse over the close. It employs a conditional display that allows the user to set the indicator as 'invisible' without removing it from the chart and hence provides a numerical closing range value when hovering over the indicator.
🛠️ ––––WHAT IT DOES––––
The Closing Range Indicator calculates the closing range of a trading bar in terms of percentages. It computes the difference between the closing price and the low price of the bar, and then divides it by the range of the bar.
A stock that closes on the high would display 100%
A stock that closes on the low would display 0%
Generally, the higher the percentage the more bullish the close but there are exceptions to this rule.
The indicator can operate on two timeframes:
Daily : Computes the closing range based on the daily high, low, and closing prices.
Weekly : Computes the closing range based on the weekly high, low, and closing prices. If you enable the weekly it will show the weekly close on all daily timeframes. Meaning that if the week Closing range is 54.15% on Friday, it will show the value 54.15% for all days prior to Friday from the same week.
The indicator places a label at the close of each bar, with the label's tooltip showing the calculated closing range percentage. I generally hide the label and just reference the tooltip calculation with a a hoover on top of the bar.
💡 ––––HOW TO USE IT––––
Installation: Add the indicator to your TradingView chart by searching for " Closing Range Indicator" in the indicator library.
Reorder: Reorder the indicator so that it sits as the first indicator (even above the price) on the Pane. This will make sure that you always trigger the tooltip functionality.
Go to Settings:
Timeframe: Choose between daily ('D') and weekly ('W') timeframes from the settings.
Visibility: Enable the 'Make Invisible' option if you want the indicator to be hidden.
Interpretation:
A higher percentage indicates that the closing price is closer to the high of the range, signaling bullish sentiment.
A lower percentage indicates bearish sentiment.
Tooltip: Hover over the label to view the closing range in percentage terms.
Search in scripts for "williams"

Candle Combo ScreenerThe Candle Combo Screener allows you to see candlestick combinations for up to 5 different tickers at the same time . If one of the candle combination is detected the corresponding cell will be highlighted to alert you.
Candle Combinations Detected
Bullish Kicker
Bullish & Bearish Oops Reversals
Open Equals High / Low
Inside Day
Select any 5 tickers. Colors and table settings are fully customizable to fit your style.
Bullish Kicker
The opening price of the current candle gaps up above the body of the prior day's candle AND the prior day's candle close was less than the open.
Oops Reversals
Bullish: Price opens below the prior day’s low and closes above.
Bearish: Price opens above the prior day's high and closes below.
Open Equals High / Low
The current candles opening price is equal to either the high or low of the day.
Inside Day
The current candles high and low are contained within the prior day's high and low.

WillyCycle Oscillator&DoubleMa/ErkOzi/version 2This oscillator can be customized by adjusting the length of the Willy period, the length of Willy's EMA, and the upper and lower bands. The upper and lower bands help traders identify overbought and oversold conditions.
The WillyCycle Oscillator is a technical analysis tool used to measure the momentum of an asset and identify overbought and oversold conditions based on the price range of a specific period and calculating the percentage of the closing price in that range. The WillyCycle Oscillator consists of two main components: Willy and Willy's EMA. The Willy component is the percentage calculation of the asset's price range, and Willy's EMA is the exponential moving average of the Willy component. Willy's EMA is used to smooth out the Willy component and make it easier to identify trends.
*** When the oscillator is above the 80 level, it indicates that the asset is overbought, and when it is below the 20 level, it indicates that the asset is oversold. Traders can use these levels as a guide for buying and selling signals.
***Traders can also use the WillyCycle Oscillator to identify trend reversals. When the oscillator rises above the 50 level, it signals a potential uptrend, and when it falls below the 50 level, it signals a potential downtrend.
***I have added a smoothed line option to the WillyCycle Oscillator, which allows traders to see a more smoothed version of the oscillator. This option can be enabled by setting the 'smoothed' input to true. The default value for the smoothed line is 15.
***We have also changed the value range of the WillyCycle Oscillator from -100 to 100 to 0 to 100. This change was made to make the oscillator more user-friendly and easier to read.
In conclusion, the WillyCycle Oscillator is a versatile tool that can help traders identify potential trading opportunities and trend reversals. Traders can customize the oscillator to fit their trading style and preferences. Adding a smoothed line and changing the value range can enhance the user experience and make the oscillator easier to use.

WillyCycle Oscillator&DoubleMa/ErkOzi/"This code creates a technical analysis indicator used to calculate and visualize the WillyCycle oscillator and double moving average indicators on the price of a financial asset. The functionality can be summarized as follows:
*Calculate the WillyCycle oscillator: The WillyCycle is an oscillator calculated based on the highest and lowest values of an asset. This oscillator is used to measure overbought or oversold conditions of the asset.
*Calculate the double moving average: The double moving average helps determine trends by calculating the short-term and long-term moving averages of asset prices.
*Use the WillyCycle oscillator and double moving average indicators together: The WillyCycle oscillator is combined with the double moving averages to provide a clearer indication of overbought and oversold conditions.
*Visualize the indicator with color coding: The indicator is color-coded to show overbought and oversold conditions. Additionally, line and background colors are changed to make the indicator more readable.
Many parameters can be adjusted on the indicator: The indicator can be customized and modified by the user. For example, the period of the WillyCycle oscillator and the lengths of the double moving averages can be adjusted."
The strategy is based on two indicators - the WillyCycle oscillator and the double moving average. The WillyCycle oscillator measures overbought and oversold conditions of the asset based on its highest and lowest values. The double moving average calculates short-term and long-term moving averages of the asset's price, which can help identify trends.
The WillyCycle oscillator and the double moving average are combined in this strategy to provide a clearer indication of overbought and oversold conditions. When the WillyCycle oscillator indicates that the asset is oversold and the short-term moving average crosses above the long-term moving average, it may signal a buy opportunity. Conversely, when the WillyCycle oscillator indicates that the asset is overbought and the short-term moving average crosses below the long-term moving average, it may signal a sell opportunity.
To make it easier for traders to read and interpret the indicator, color-coding is used to indicate overbought and oversold conditions. The user can also customize the indicator by adjusting parameters such as the period of the WillyCycle oscillator and the lengths of the double moving averages.
*ıt provides successful buy and sell signals for price reversals.
*You can open counter trades in overbought and oversold areas by following the averages.

Quick and Simple - WPR+RSI+CCITake a look.
Couple of confluencial reversal signals from popular indicators (W%R, RSI & CCI). I can only say this shows how random the "stanard tools" are and how the market makers "play" these kind of tools to their advantage.
That said. It's better tha average, but not top-class, so expect to have to take signals with other confluence. DON'T take the plots or signals as buy / sell signals, they are just confluencial movements from these indicators based on how they should be "traditionally" used. Instead, use it as a guide as to what other traders may be thinking, or as a pull-back identifier.
Included 100 period ema as basic trend filter.
Not my normal type of script + been away for some time so be kind, lol :)
You might find it useful however so sharing.
More stuff to follow :)

Defu_RSIThis is a composite indicator, a collection of multiple indicators.
Includes:
1. in the simple RSI oversold and overbought area, I rewritten the RSI index of pine, which is more in line with the change of the relative intensity of rise and fall.
2. the red and green column line to the top is rewritten by William w% index. The red and green column indicates the top of the stage. When the column line disappears, it indicates the top of the stage. It is very reliable.
3. CCI green line: calculate CCI index through EMA weighting, smooth CCI curve and reflect trend change.
4. the j-link of KDJ variant indicates the real-time change of trend, which is used in conjunction with CCI index. Please observe carefully
5. the intra day fluctuation indicator is represented by a red orange column line below the 0 axis, and a simple filter is added to indicate the turning point of the trend.
I will continue to update when I have time
//==============The above is translated by Google , please pass the administrator
这是个复合指标,是多个指标的集合。
包含有 1. 简单RSI超卖超买区,我改写了pine自带的rsi指标,这个更加符合涨跌相对强度的变化。
2.到顶红绿柱线,由威廉W%指标改写,红绿柱表示阶段的顶部,当柱线消失时,表示阶段顶部,非常可靠。
3. CCI 绿色线,通过ema加权计算CCI指标,平滑CCI曲线,反应趋势变化。
4.用KDJ变种的J线连表示趋势的即时变化,这个配合CCI指标使用。请仔细观察
5.日内波动指示器,在0轴下方用红橙柱线表示,加了简单的过滤器,表示趋势的转折点。

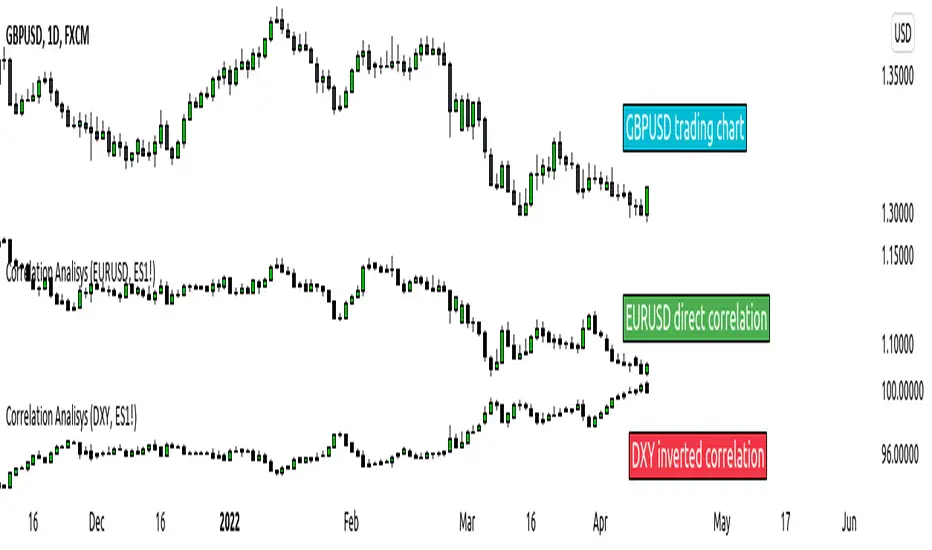
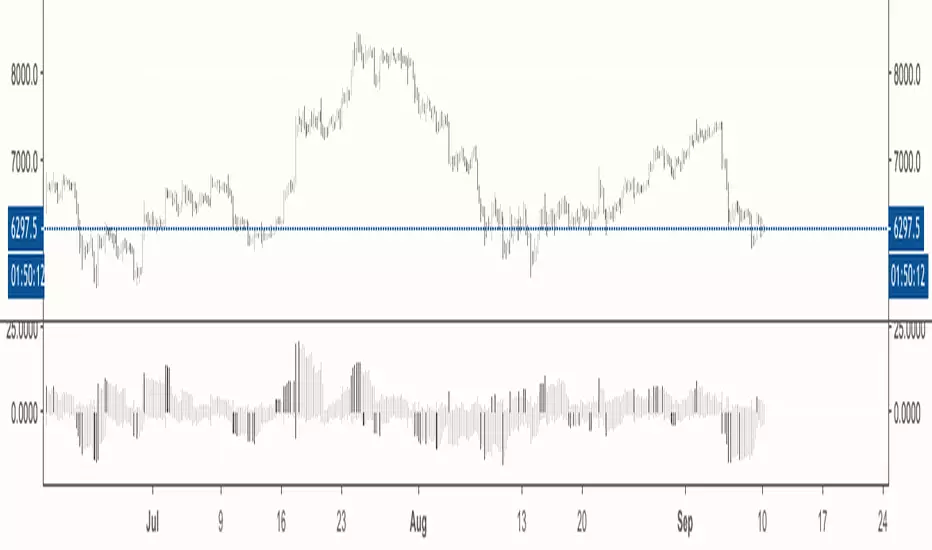
ICT index correlated market indicatorThis is not a real indicator, but is what ICT use as indicator for trading futures indexes.
it can only display SP500, Dow Jon Industrial Average and Nasdaq, if someone want other market can copy the code and change some parameters (is more easy than it can appear)
A good idea is using this other market on backtest to confirm the divergence idea of Linda Raske, than use it to spot quickly in real market.
Another idea published by ICT is the "hidden entry pattern", the entry signal appear in ES or YM but I trade NQ for volatility, so I use the trigger of SP500 or Dow to enter in Nasdaq.
Rember always don't trust anybody, do your own backtest and research!
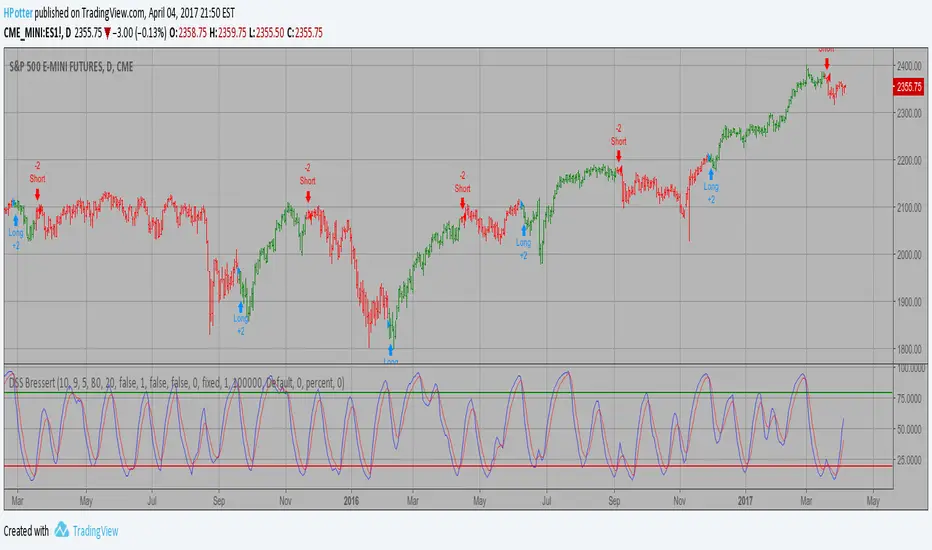
Combo Backtest 123 Reversal & DSS Bressert This is combo strategies for get a cumulative signal.
First strategy
This System was created from the Book "How I Tripled My Money In The
Futures Market" by Ulf Jensen, Page 183. This is reverse type of strategies.
The strategy buys at market, if close price is higher than the previous close
during 2 days and the meaning of 9-days Stochastic Slow Oscillator is lower than 50.
The strategy sells at market, if close price is lower than the previous close price
during 2 days and the meaning of 9-days Stochastic Fast Oscillator is higher than 50.
Second strategy
Double Smoothed Stochastics (DSS) is designed by William Blaw.
It attempts to combine moving average methods with oscillator principles.
WARNING:
- For purpose educate only
- This script to change bars colors.

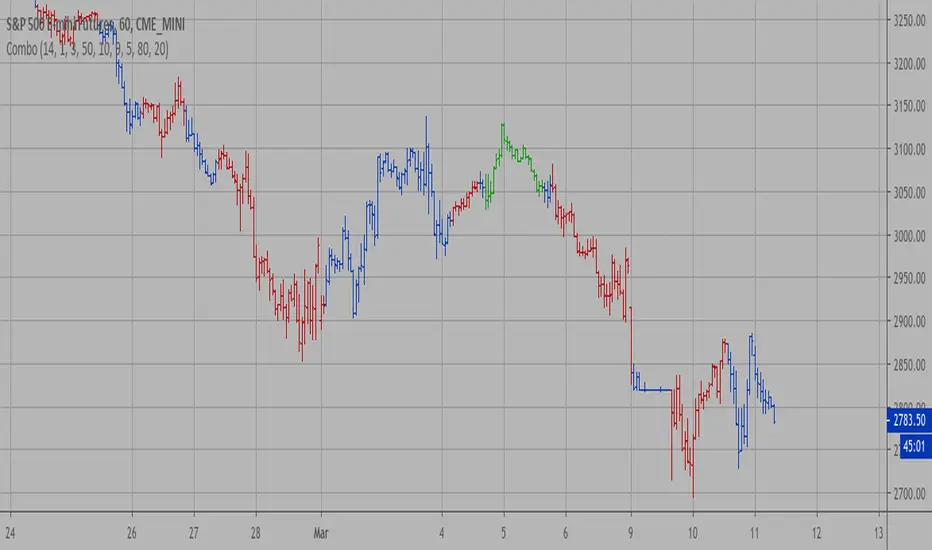
Combo Strategy 123 Reversal & DSS Bressert This is combo strategies for get a cumulative signal.
First strategy
This System was created from the Book "How I Tripled My Money In The
Futures Market" by Ulf Jensen, Page 183. This is reverse type of strategies.
The strategy buys at market, if close price is higher than the previous close
during 2 days and the meaning of 9-days Stochastic Slow Oscillator is lower than 50.
The strategy sells at market, if close price is lower than the previous close price
during 2 days and the meaning of 9-days Stochastic Fast Oscillator is higher than 50.
Second strategy
Double Smoothed Stochastics (DSS) is designed by William Blaw.
It attempts to combine moving average methods with oscillator principles.
WARNING:
- For purpose educate only
- This script to change bars colors.
Combo Backtest 123 Reversal & Directional Trend Index (DTI) This is combo strategies for get a cumulative signal.
First strategy
This System was created from the Book "How I Tripled My Money In The
Futures Market" by Ulf Jensen, Page 183. This is reverse type of strategies.
The strategy buys at market, if close price is higher than the previous close
during 2 days and the meaning of 9-days Stochastic Slow Oscillator is lower than 50.
The strategy sells at market, if close price is lower than the previous close price
during 2 days and the meaning of 9-days Stochastic Fast Oscillator is higher than 50.
Second strategy
This technique was described by William Blau in his book "Momentum,
Direction and Divergence" (1995). His book focuses on three key aspects
of trading: momentum, direction and divergence. Blau, who was an electrical
engineer before becoming a trader, thoroughly examines the relationship between
price and momentum in step-by-step examples. From this grounding, he then looks
at the deficiencies in other oscillators and introduces some innovative techniques,
including a fresh twist on Stochastics. On directional issues, he analyzes the
intricacies of ADX and offers a unique approach to help define trending and
non-trending periods.
Directional Trend Index is an indicator similar to DM+ developed by Welles Wilder.
The DM+ (a part of Directional Movement System which includes both DM+ and
DM- indicators) indicator helps determine if a security is "trending." William
Blau added to it a zeroline, relative to which the indicator is deemed positive or
negative. A stable uptrend is a period when the DTI value is positive and rising, a
downtrend when it is negative and falling.
WARNING:
- For purpose educate only
- This script to change bars colors.

Combo Strategy 123 Reversal & Directional Trend Index (DTI) This is combo strategies for get a cumulative signal.
First strategy
This System was created from the Book "How I Tripled My Money In The
Futures Market" by Ulf Jensen, Page 183. This is reverse type of strategies.
The strategy buys at market, if close price is higher than the previous close
during 2 days and the meaning of 9-days Stochastic Slow Oscillator is lower than 50.
The strategy sells at market, if close price is lower than the previous close price
during 2 days and the meaning of 9-days Stochastic Fast Oscillator is higher than 50.
Second strategy
This technique was described by William Blau in his book "Momentum,
Direction and Divergence" (1995). His book focuses on three key aspects
of trading: momentum, direction and divergence. Blau, who was an electrical
engineer before becoming a trader, thoroughly examines the relationship between
price and momentum in step-by-step examples. From this grounding, he then looks
at the deficiencies in other oscillators and introduces some innovative techniques,
including a fresh twist on Stochastics. On directional issues, he analyzes the
intricacies of ADX and offers a unique approach to help define trending and
non-trending periods.
Directional Trend Index is an indicator similar to DM+ developed by Welles Wilder.
The DM+ (a part of Directional Movement System which includes both DM+ and
DM- indicators) indicator helps determine if a security is "trending." William
Blau added to it a zeroline, relative to which the indicator is deemed positive or
negative. A stable uptrend is a period when the DTI value is positive and rising, a
downtrend when it is negative and falling.
WARNING:
- For purpose educate only
- This script to change bars colors.

Willams %R with 13 EMA and middle pointWillams %R with 13 EMA and middle point. It also uses the textbook formula instead of the Tradingview one.
Ergodic CSI Backtest This is one of the techniques described by William Blau in his book
"Momentum, Direction and Divergence" (1995). If you like to learn more,
we advise you to read this book. His book focuses on three key aspects
of trading: momentum, direction and divergence. Blau, who was an electrical
engineer before becoming a trader, thoroughly examines the relationship between
price and momentum in step-by-step examples. From this grounding, he then looks
at the deficiencies in other oscillators and introduces some innovative techniques,
including a fresh twist on Stochastics. On directional issues, he analyzes the
intricacies of ADX and offers a unique approach to help define trending and
non-trending periods.
This indicator plots Ergotic CSI and smoothed Ergotic CSI to filter out noise.
You can change long to short in the Input Settings
WARNING:
- For purpose educate only
- This script to change bars colors.

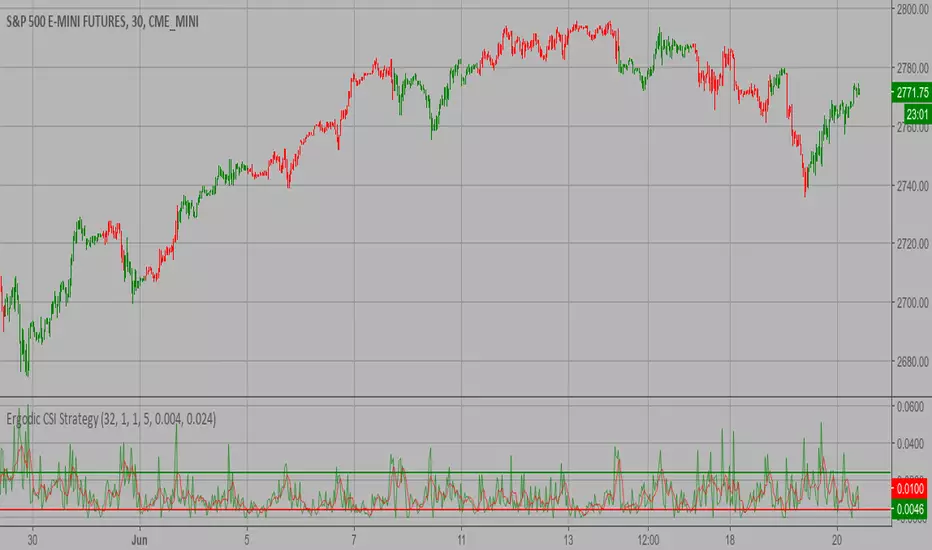
Ergodic CSI Strategy This is one of the techniques described by William Blau in his book
"Momentum, Direction and Divergence" (1995). If you like to learn more,
we advise you to read this book. His book focuses on three key aspects
of trading: momentum, direction and divergence. Blau, who was an electrical
engineer before becoming a trader, thoroughly examines the relationship between
price and momentum in step-by-step examples. From this grounding, he then looks
at the deficiencies in other oscillators and introduces some innovative techniques,
including a fresh twist on Stochastics. On directional issues, he analyzes the
intricacies of ADX and offers a unique approach to help define trending and
non-trending periods.
This indicator plots Ergotic CSI and smoothed Ergotic CSI to filter out noise.
WARNING:
- This script to change bars colors.
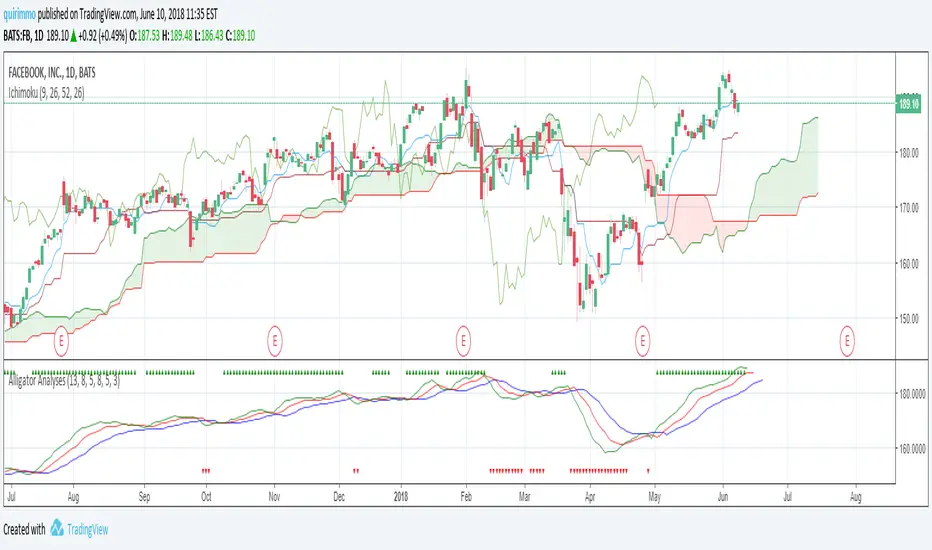
Alligator AnalysesA simple script in order to plot the Alligator Indicator with triangles plotted on the graph in order to see directly if the alligator is sleeping or eating.
You will see green up triangles when the alligator is bullish eating, while red down triangles when the alligator is bearish eating.
You will not see anything on the chart when the alligator is sleeping.
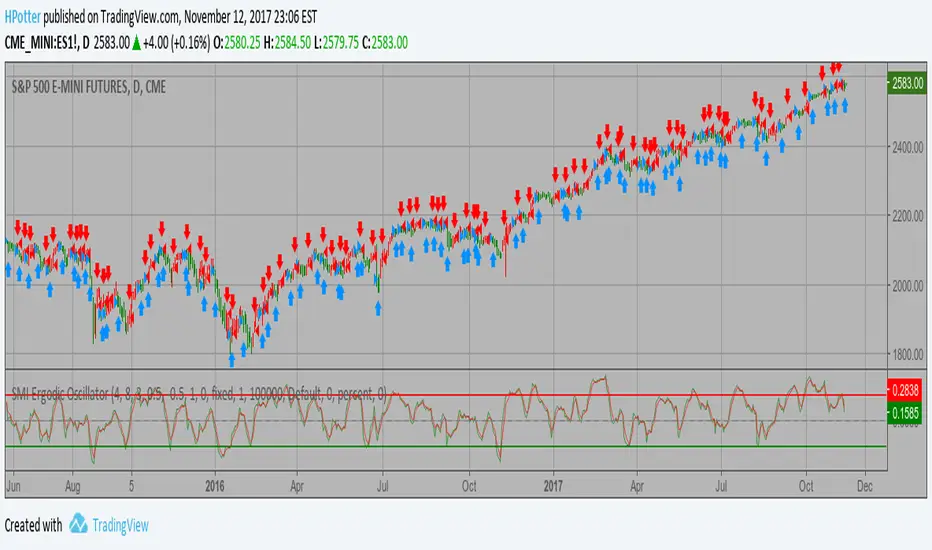
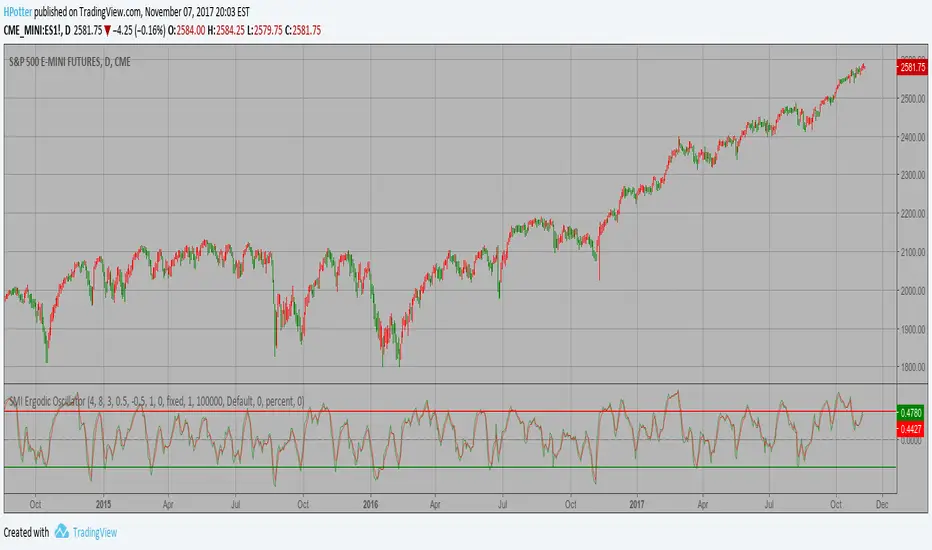
SMI Ergodic Oscillator Backtest ver.2 The SMI Ergodic Indicator is the same as the True Strength Index (TSI) developed by
William Blau, except the SMI includes a signal line. The SMI uses double moving averages
of price minus previous price over 2 time frames. The signal line, which is an EMA of the
SMI, is plotted to help trigger trading signals. Adjustable guides are also given to fine
tune these signals. The user may change the input (close), method (EMA), period lengths
and guide values.
You can use in the xPrice any series: Open, High, Low, Close, HL2, HLC3, OHLC4 and ect...
WARNING:
- For purpose educate only
SMI Ergodic Oscillator Strategy ver.2 The SMI Ergodic Indicator is the same as the True Strength Index (TSI) developed by
William Blau, except the SMI includes a signal line. The SMI uses double moving averages
of price minus previous price over 2 time frames. The signal line, which is an EMA of the
SMI, is plotted to help trigger trading signals. Adjustable guides are also given to fine
tune these signals. The user may change the input (close), method (EMA), period lengths
and guide values.
You can use in the xPrice any series: Open, High, Low, Close, HL2, HLC3, OHLC4 and ect...
WARNING:
- For purpose educate only
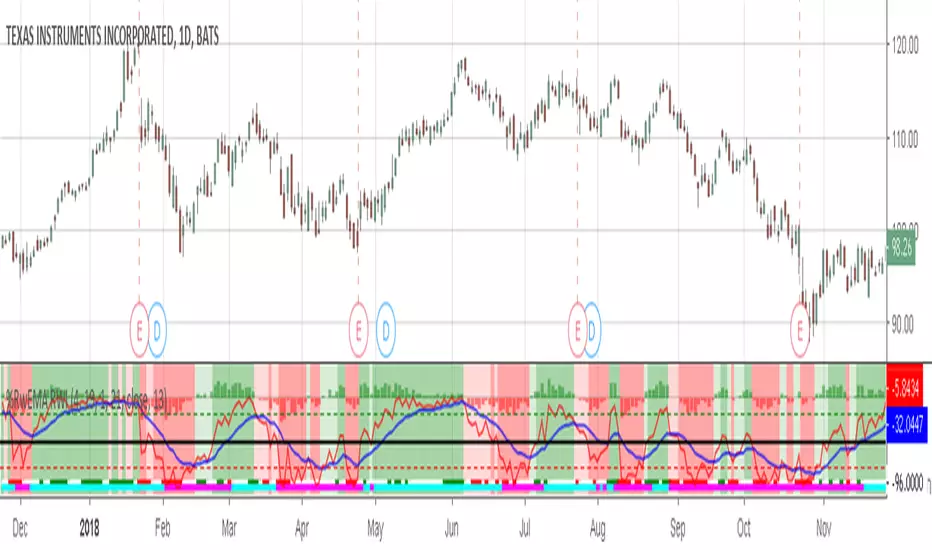
Willams %RwEMAspy
Was looking for something else when surfed into an old question
wanting %R 21 period with EMA 13 period of the %R signal
and being a rookie at this, made this code to post for them.
Tried to comment the script in such a way that other rookies
like me could make better sense of what is being done. Hope
this helps someone. I find it useful as one of my indicators for
trading.
Pinescript for tradingview.com user Tom1trader
All time frames.
Interpretation:
%R (Red) crosses above it's average (Blue) - bull
%R crosses below it's average - bear. Background
color changes green-up red-down with above crossings.
Most but not all of serious price movement takes place
from the time the %R (red) goes into oversold (or bought) and
exits again.
%R centerline crosses can also be useful.
I use various indicators and want all of the confirmation
that I can get for expectations BUT I never know what the
next bar will do and define my risks accordingly.
SMI Ergodic Oscillator The SMI Ergodic Indicator is the same as the True Strength Index (TSI) developed by
William Blau, except the SMI includes a signal line. The SMI uses double moving averages
of price minus previous price over 2 time frames. The signal line, which is an EMA of the
SMI, is plotted to help trigger trading signals. Adjustable guides are also given to fine
tune these signals. The user may change the input (close), method (EMA), period lengths
and guide values.
You can use in the xPrice any series: Open, High, Low, Close, HL2, HLC3, OHLC4 and ect...

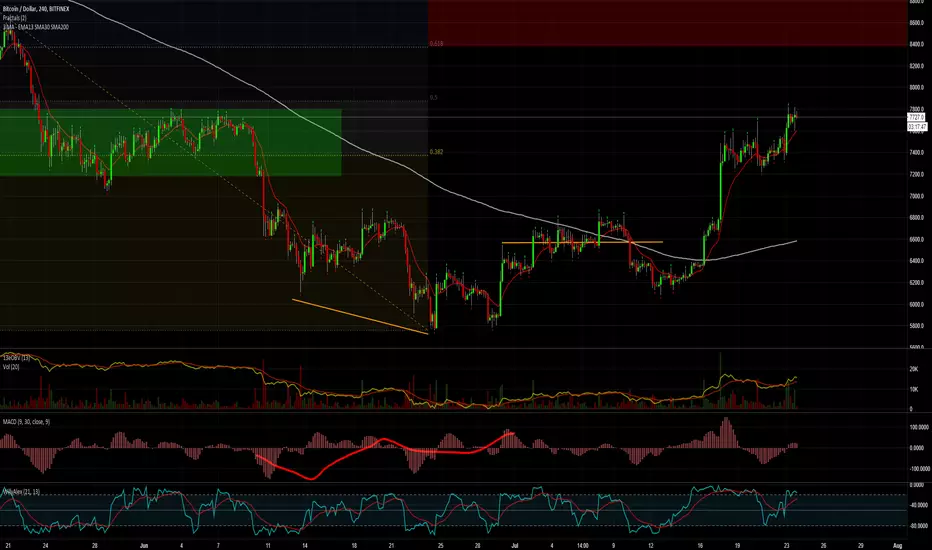
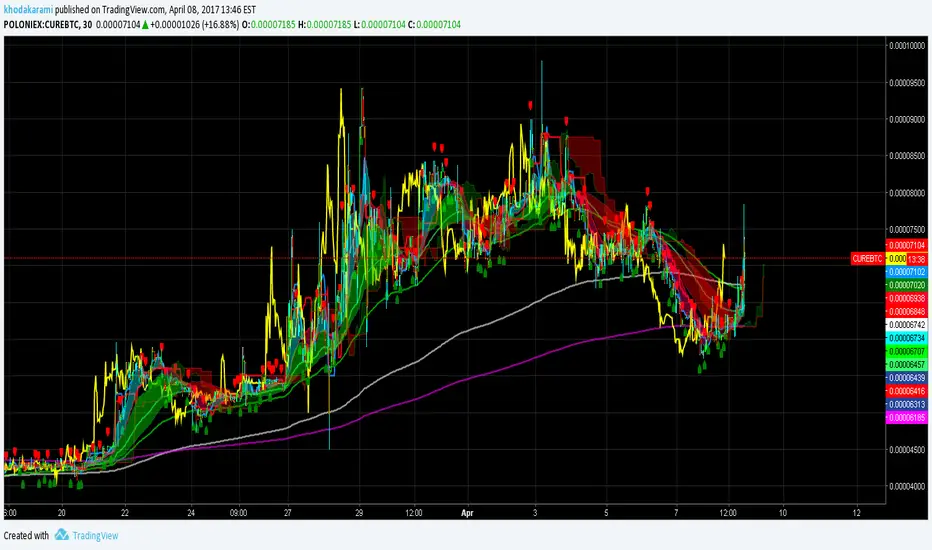
Guerrilla AdvancedThis indicator was designed with people without Pro License in mind (Including many of my close friends).
Basically, you will get a combo of few different tools in one box, with ability to turn them on and off with a single check mark, also, you have total control over the input numbers that was used in calculations if you so want to, for example, sometimes when i see a massive bullish up trend, i reduce the short rally from 12 to 8 even 6 to get faster signal for selling the trend.
So, what will you get in this pack?
1- Ichimoko. Yes, you heard it right, although we have it in the default tools but hey, it will use one indicator slot and if you don't have a pro license, you will use that slot
2- Rally. This is an old yet very powerful system for getting buy or sell signals, basically, you get two lines and for making the life easier i draw a cloud between them. when the trend passes above the cloud and it was bellow it in past, right after the very first candle that gets above the cloud you can put the buy order, and vice versa, the moment a candle body enters the cloud, if you want an aggressive signal, you can sell, if not, you may want to wait to see if the candles drop bellow the cloud or not then decide.
3- Resistance Support Cloud. Most of us always heard about resistance and support "lines" but many of us don't know that, in each trend, the trend line itself is a resistance or support line, and when you are going in a bullish or bearish tunnel, the floor and roof of tunnels are again resistance and supports, using this part of the tool, just like rally, you get a cloud that shows you the resistance / support "zone"
4- William Fractals. To be honest, I got this part of the code from another source available around. Why? looking at those fractal indicators, you can easily eyeball the trend line or existence of a tunnel.
5- Different EMA lines. If you are one of those people that use EMA lines for their trading, have fun with them, there are few different standard ones and even a custom one that you can put your desired number for it.
DSS Bressert (Double Smoothed Stochastic) Strategy Backtest Double Smoothed Stochastics (DSS) is designed by William Blaw.
It attempts to combine moving average methods with oscillator principles.
You can change long to short in the Input Settings
Please, use it only for learning or paper trading. Do not for real trading.