SCTI V30Description
The SCTI V30 is an advanced multi-functional technical analysis indicator for TradingView that combines multiple analytical approaches into a single comprehensive tool. This indicator provides:
Multiple Moving Average Types (EMA, SMA, PMA with various calculation methods)
Customizable VWAP with standard deviation bands
Sophisticated Divergence Detection across 12 different indicators
Volume Profile Analysis with peak/trough detection
Highly Configurable Display Options
The indicator is designed to help traders identify trends, potential reversals, and key support/resistance levels across different timeframes.
Features
1. Moving Average Systems
EMA Section: 13 configurable EMA periods (8, 13, 21, 34, 55, 89, 144, 233, 377, 610, 987, 1597, 2584)
SMA Section: 13 configurable SMA periods (same as EMA)
PMA Section: 11 customizable moving averages with multiple calculation methods:
ALMA, EMA, RMA, SMA, SWMA, VWAP, VWMA, WMA
Adjustable lengths from 12 to 1056
Customizable colors, widths, and fill options between MAs
2. VWAP Implementation
Multiple anchor periods (Session, Week, Month, Quarter, Year, etc.)
Standard deviation or percentage-based bands
Option to hide on daily/weekly/monthly timeframes
Customizable band multipliers (1.0, 2.0, 3.0)
3. Divergence Detection
Detects regular and hidden divergences across 12 indicators:
MACD, MACD Histogram, RSI, Stochastic, CCI, Momentum
OBV, VW-MACD, Chaikin Money Flow, Money Flow Index
Williams %R, and custom external indicators
Customizable detection parameters:
Pivot point period (1-50)
Source (Close or High/Low)
Divergence type (Regular, Hidden, or Both)
Minimum number of divergences required (1-11)
Maximum pivot points to check (1-20)
Maximum bars to look back (30-200)
4. Volume Profile Analysis
Configurable profile length (10-5000 bars)
Value Area threshold (0-100%)
Profile placement (Left or Right)
Number of rows (30-130)
Profile width adjustment
Volume node detection:
Peaks (with cluster option)
Troughs (with cluster option)
Highest/Lowest volume nodes
Customizable colors for all elements
Input Parameters
The indicator is organized into 7 parameter groups:
Basic Indicator Settings - Toggle visibility of main components
EMA Settings - Configure 13 EMA periods and visibility
SMA Settings - Configure 13 SMA periods and visibility
PMA Settings - Advanced moving average configuration
VWAP Settings - Volume-weighted average price configuration
Divergence Settings - Comprehensive divergence detection options
Volume Profile & Node Detection - Volume analysis configuration
How to Use
Trend Identification: Use the multiple moving averages to identify trend direction and strength. The Fibonacci-based periods (21, 34, 55, 89, 144, etc.) are particularly useful for this.
Support/Resistance: The VWAP and volume profile components help identify key support/resistance levels.
Divergence Trading: Look for divergences between price and the various indicators to spot potential reversal points.
Volume Analysis: The volume profile shows where the most trading activity occurred, highlighting important price levels.
Customization: Adjust the settings to match your trading style and timeframe. The indicator is highly configurable to suit different trading approaches.
Alerts
The indicator includes alert conditions for:
Positive regular divergence detected
Negative regular divergence detected
Positive hidden divergence detected
Negative hidden divergence detected
Any positive divergence (regular or hidden)
Any negative divergence (regular or hidden)
Notes
The indicator may be resource-intensive due to its comprehensive calculations, especially on lower timeframes with long lookback periods.
Some features (like VWAP) can be hidden on higher timeframes to improve performance.
The default settings are optimized for daily charts but can be adjusted for any timeframe.
This powerful all-in-one indicator provides traders with a complete toolkit for technical analysis, combining trend-following, momentum, volume, and divergence techniques into a single, customizable solution.
Search in scripts for "williams"

Consensus Signal Matrix Pro [By TraderMan] Consensus Signal Matrix Pro 🌟
What Does It Do? 📊
Consensus Signal Matrix Pro is a comprehensive technical analysis indicator designed for financial markets. 🧠 It aggregates signals from over 30 popular technical indicators (e.g., EMA, RSI, MACD, Bollinger Bands, Supertrend, Ichimoku, etc.) to provide a unified BUY, SELL, or NEUTRAL recommendation. 💡 This tool helps traders make informed decisions by consolidating signals and presenting them in a clear table format. 📈 It is particularly suited for leveraged trading (without built-in TP/SL). 🚀
How Does It Work? 🔍
Multi-Indicator Analysis 🛠️:
The indicator calculates signals from 30 different technical indicators (e.g., EMA 9/21, RSI, MACD, Supertrend, Ichimoku, Williams %R, etc.).
Each indicator generates a BUY, SELL, or NEUTRAL signal based on price action and volume data.
For example: RSI < 30 triggers a "BUY" signal, while RSI > 70 triggers a "SELL" signal. 🔔
Signal Aggregation and Consensus 🤝:
All indicator signals are collected into an array.
The number of BUY, SELL, and NEUTRAL signals is counted.
A percentage difference (percentDiff) is calculated by dividing the difference between BUY and SELL signals by the total number of indicators.
Based on this difference:
>20%: General status is GENERAL BUY. ✅
<-20%: General status is GENERAL SELL. ❎
In between: General status is NEUTRAL. ⚖️
Position Recommendation 💸:
The position type is determined based on the general status:
GENERAL BUY → LONG position recommended. 📈
GENERAL SELL → SHORT position recommended. 📉
NEUTRAL → No position (NONE). 🚫
Table Visualization 📋:
The indicator displays all signals and the general status in a table located in the top-right corner of the TradingView chart. 🎨
The table lists each indicator’s name, its signal (BUY/SELL/NEUTRAL), total indicator count, BUY/SELL/NEUTRAL counts, general status, and position type. 🖼️
Color coding is used: Green (BUY), Red (SELL), Gray (NEUTRAL), Orange (headers). 🌈
How to Use It? 🛠️
Setup ⚙️:
Copy and paste the indicator code into the Pine Editor on TradingView and compile it. 🖥️
Add it to your chart (works on any timeframe, though it uses D1 data for daily ATR). ⏰
Review the Table 📖:
Check the table displayed in the top-right corner of the chart.
Review each indicator’s signal (BUY/SELL/NEUTRAL) and the overall signal distribution.
Focus on the GENERAL STATUS and POSITION TYPE rows. 🔎
Position Opening Decision 💰:
LONG Position: If GENERAL STATUS is "GENERAL BUY" and the table shows mostly green (BUY) signals, consider opening a LONG position. 📈
SHORT Position: If GENERAL STATUS is "GENERAL SELL" and the table shows mostly red (SELL) signals, consider opening a SHORT position. 📉
NEUTRAL Status: If the status is "NEUTRAL," avoid opening a position. ⚖️
Risk Management ⚠️:
The indicator does not include Take Profit (TP) or Stop Loss (SL) levels. You must apply your own risk management strategy.
Recommended: Use ATR-based volatility (shown in the table as ATR signal) or support/resistance levels to set manual TP/SL. 🛡️
Timeframe and Asset ⏳:
Can be used on any financial asset (stocks, forex, crypto, etc.).
Works on short-term (1H, 4H) or long-term (D1, W1) charts. Evaluate signal speed based on your timeframe. 📅
How to Open Positions? 🎯
Trust the General Status: Use GENERAL STATUS (GENERAL BUY or GENERAL SELL) as the primary guide. A strong percentage difference (>20% or <-20%) indicates a more reliable signal. ✅
Check Signal Strength: Look at the table to assess the number of BUY or SELL signals. For example, if 20 out of 30 indicators signal BUY, it’s a strong LONG signal. 💪
Align with Market Conditions: Before acting, analyze the broader market trend (bullish, bearish, or sideways). For instance, SELL signals may be less reliable in a strong bull market. 📡
Combine with Other Analyses: Use the indicator alongside support/resistance levels, news flow, or fundamental analysis for confirmation. 🧩
Caution: The indicator is designed for leveraged trading but lacks TP/SL. Manage volatility and risk tolerance carefully. ⚠️
Advantages and Considerations 🌟
Advantages 😊:
Simplifies analysis by combining multiple indicators into one table.
Provides a quick overview of market direction.
User-friendly for both beginners and experienced traders.
Considerations ⚠️:
No signal is 100% accurate; markets can be unpredictable.
You must develop your own risk management strategy.
Signals may be misleading during high volatility; use additional confirmation.
Final Note 🎉:
Consensus Signal Matrix Pro is a powerful tool for traders seeking a consolidated view of multiple technical signals. 🚀 By combining diverse indicators into a single, easy-to-read table, it streamlines decision-making. However, always combine it with sound risk management and market context for the best results. 💸 Happy trading! 🤑

Reversal Radar
**Reversal Radar - Multi-Indicator Confirmation System**
This script combines five proven technical analysis methods into a unified reversal signal, reducing false signals through multi-indicator confirmation.
**INDICATORS USED:**
1. ADX/Directional Movement System
Determines trend direction via +DI and -DI comparison. Signal only during downtrend condition (DI- > DI+). Filters out sideways markets.
2. Custom Linear Regression Momentum
Proprietary momentum calculation based on linear regression. Measures price deviation from Keltner Channel midline. Signal on negative but rising momentum (beginning trend reversal).
3. Williams VIX Fix (WVF)
Identifies panic-selling phases. Calculates relative distance to recent high. Signal when exceeding Bollinger Bands or historical percentiles.
4. RSI Oversold Filter
Default RSI < 35 (adjustable 30-40). Filters only oversold zones for reversal setups.
5. MACD Confirmation
Signal only when MACD below zero line and below signal line. Confirms ongoing weakness before potential reversal.
**FUNCTIONALITY:**
The system generates a BUY signal only when ALL activated filters are simultaneously met. Each indicator can be individually enabled/disabled. Flexible parameter adjustment for different markets/timeframes. Reduces false signals through multi-confirmation.
**APPLICATION:**
Suitable for swing trading on higher timeframes (4H, Daily), reversal strategies in oversold markets, and combination with additional confirmation indicators.
Setup: Activate desired filters, adjust parameters to market/timeframe, check BUY signal as entry opportunity. Additional confirmation through volume/support recommended.
**INNOVATION:**
The Custom Linear Regression Momentum is a proprietary development combining Keltner Channel logic with linear regression for more precise momentum detection than standard oscillators.
**DISCLAIMER:**
This tool serves as technical analysis support. No signal should be traded without additional confirmation and risk management.

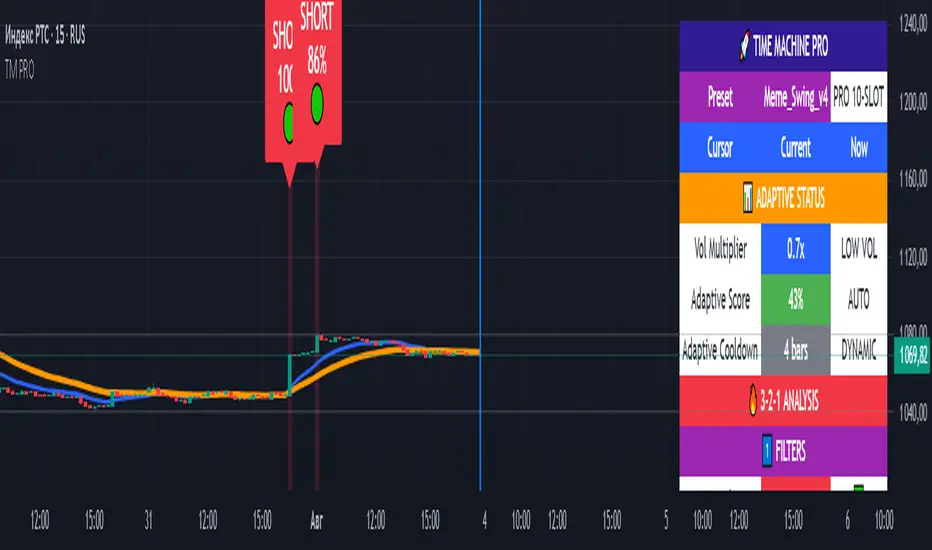
TIME MACHINE PRO-01# TIME MACHINE PRO - Revolutionary Trading Indicator with Historical Analysis
## 🎯 Overview
TIME MACHINE PRO is a sophisticated multi-timeframe trading indicator that combines 10 customizable technical indicators with a unique time-travel cursor feature. Analyze historical signals, learn from past market behavior, and make informed trading decisions with percentage-based confidence scores.
## ✨ Key Features
### 🕰️ Time Machine Cursor
- **Analyze signals from any point in history** (up to 500 bars back)
- **See exact indicator values** at historical moments
- **Learn from past signal performance** to improve future trades
- **Real-time historical analysis** with date/time display
### 🎰 10 Professional Indicator Slots
**Core Oscillators:**
- RSI, Stochastic, MACD, CCI, Williams %R
- MFI, ROC, Bollinger Bands Width
- Stochastic RSI, Awesome Oscillator
- Parabolic SAR, Ichimoku Cloud
**Customizable Parameters:**
- Individual weights (0.1-3.0) for each indicator
- Custom overbought/oversold levels
- Adjustable periods and sensitivity
- Enable/disable any combination
### 📊 Advanced Signal System
- **3-2-1 Logic**: 3 Filters → 2 Signals → 1 Trigger
- **Percentage-based signal strength** (0-100%)
- **Color-coded confidence levels**:
- 🟢 Green (80%+) - High confidence
- 🟡 Yellow (65-79%) - Medium confidence
- 🟠 Orange (50-64%) - Low confidence
- **Adaptive algorithm** adjusts to market volatility
### 🎛️ 7 Professional Presets
**1. Meme_Scalp_v4** - Quick scalping for meme coins
- Optimized for 1m-5m timeframes
- High sensitivity, more signals
- Perfect for DOGE, SHIB, PEPE
**2. Meme_Swing_v4** - Balanced swing trading ⭐ (Recommended for beginners)
- Best for 15m-1h timeframes
- Balanced accuracy and frequency
- Universal crypto trading
**3. Alt_Short_v4** - Altcoin shorting strategy
- Focused on SHORT signals
- Great for bear markets
- Optimized for altcoin volatility
**4. Pump_Hunter_v4** - Pump detection system
- Ultra-fast reaction to price spikes
- High-volatility market specialist
- Advanced pump/dump detection
**5. Conservative_v4** - Conservative long-term trading
- High accuracy, fewer signals
- Perfect for large portfolios
- 4h-1D timeframes
**6. Professional_v4** - All 10 slots active
- Maximum analysis power
- For experienced traders
- Complete market overview
**7. Custom** - Create your own strategy
- Full control over all parameters
- Save configurations via screenshots
- Unlimited customization
### 📈 Comprehensive Analytics Table
**Real-time display includes:**
- **Adaptive Status**: Volatility multiplier, adaptive scores
- **3-2-1 Analysis**: Filters, signals, triggers breakdown
- **Slot Status**: All 10 indicators with current values and weights
- **Enhanced Conditions**: Pump-dump detection, extreme overbought alerts
- **Final Scores**: Long/Short percentages with final signal decision
### 🎨 Visual Elements
**On-Chart Signals:**
- Clear LONG/SHORT labels with confidence percentages
- Risk level indicators (🟢🟡🟠)
- Background highlighting during signal periods
- EMA trend lines (Fast: Blue, Slow: Orange)
- Time cursor line for historical analysis
## 📋 Perfect For
### 🚀 Cryptocurrency Trading
- **Bitcoin & Ethereum** - Major pairs with high liquidity
- **Altcoins** - SOL, AVAX, MATIC, ADA optimized settings
- **Meme Coins** - Special algorithms for DOGE, SHIB, PEPE
- **All timeframes** - From 1-minute scalping to daily swing trading
### 📊 Trading Styles
- **Scalping** - Ultra-fast entries with Meme_Scalp_v4
- **Swing Trading** - Medium-term positions with balanced signals
- **Short Selling** - Specialized bear market detection
- **Conservative** - High-accuracy, low-frequency signals
### 👥 Trader Levels
- **Beginners** - Ready-to-use presets with clear signals
- **Intermediate** - Historical analysis for learning and improvement
- **Advanced** - Full customization with 10-slot system
- **Professional** - Complex multi-indicator strategies
## 🔧 Technical Specifications
### System Requirements
- TradingView platform (Free or Pro)
- Modern web browser
- Stable internet connection
- Recommended: 1920x1080+ resolution
### Compatibility
- **✅ Fully Supported**: All crypto pairs, 1m-1D timeframes
- **⚠️ Limited**: Forex pairs, stock markets
- **❌ Not Recommended**: Exotic low-liquidity pairs
### Performance
- **Pine Script v6** - Latest version with optimal performance
- **Real-time calculations** - Instant updates with each candle
- **Low resource usage** - Optimized code for smooth operation
- **500 bars history** - Maximum lookback for cursor analysis
## 💡 How to Use
### Quick Start (Beginners)
1. Add indicator to chart
2. Select **"Meme_Swing_v4"** preset
3. Set timeframe to **15m or 1h**
4. Trade signals **70%+** only
5. Use **cursor** to learn from history
### Advanced Setup (Experienced)
1. Choose **"Custom"** mode
2. Configure individual slots
3. Adjust weights and parameters
4. Test with historical cursor
5. Save settings via screenshot
### Risk Management
- **Never risk more than 2-5%** per trade
- **Always use stop-losses**
- **Consider overall market trend**
- **Wait for cooldown periods**
## 🎯 What Makes It Unique
### Revolutionary Time Travel Feature
- **First indicator with historical cursor** functionality
- **Learn from past signals** without backtesting complexity
- **See exactly what happened** after each historical signal
- **Improve strategy** by understanding signal outcomes
### Adaptive Intelligence
- **Auto-adjusts to market volatility** (Low/Normal/High modes)
- **Dynamic cooldown periods** prevent signal spam
- **Smart score adaptation** for different market conditions
- **Volume-based confirmations** for signal validation
### Professional Grade Analytics
- **Complete transparency** - see every component of each signal
- **Detailed breakdown** of filters, signals, and triggers
- **Real-time adaptation status** monitoring
- **Professional-level information** usually found in premium tools
## 📞 Support & Community
### 🔄 Regular Updates
- Algorithm improvements and optimizations
- New presets based on market conditions
- Bug fixes and performance enhancements
- Community-requested features
### 📚 Learning Resources
- Comprehensive user manual included
- Step-by-step tutorials for all levels
- Best practices and risk management guides
- Community sharing of successful configurations
### 💬 Community Features
- Share custom presets via screenshots
- Discuss strategies with other users
- Learn from experienced traders
- Get support and tips
## ⚠️ Important Disclaimers
- **Not financial advice** - Educational tool only
- **No guarantee of profits** - Trading involves risk
- **Past performance** doesn't predict future results
- **Always use proper risk management**
- **Test thoroughly** before live trading
## 🚀 Get Started Today
Transform your trading with the power of time travel analysis. Whether you're a beginner looking for clear signals or a professional trader seeking advanced customization, TIME MACHINE PRO adapts to your needs.
**Experience the future of technical analysis - where you can learn from the past to profit in the present!**
---
**Categories**: Trend Analysis, Oscillators, Volatility
**Best Timeframes**: 5m, 15m, 1h, 4h
**Recommended Pairs**: BTC/USDT, ETH/USDT, SOL/USDT, DOGE/USDT
**Skill Level**: All levels (Beginner to Professional)
*Like this indicator? Please leave a comment and boost! Your feedback helps us improve and add new features.* ⭐
SCTI V28Indicator Overview | 指标概述
English: SCTI V28 (Smart Composite Technical Indicator) is a multi-functional composite technical analysis tool that integrates various classic technical analysis methods. It contains 7 core modules that can be flexibly configured to show or hide components based on traders' needs, suitable for various trading styles and market conditions.
中文: SCTI V28 (智能复合技术指标) 是一款多功能复合型技术分析指标,整合了多种经典技术分析工具于一体。该指标包含7大核心模块,可根据交易者的需求灵活配置显示或隐藏各个组件,适用于多种交易风格和市场环境。
Main Functional Modules | 主要功能模块
1. Basic Indicator Settings | 基础指标设置
English:
EMA Display: 13 configurable EMA lines (default shows 8/13/21/34/55/144/233/377/610/987/1597/2584 periods)
PMA Display: 11 configurable moving averages with multiple MA types (ALMA/EMA/RMA/SMA/SWMA/VWAP/VWMA/WMA)
VWAP Display: Volume Weighted Average Price indicator
Divergence Indicator: Detects divergences across 12 technical indicators
ATR Stop Loss: ATR-based stop loss lines
Volume SuperTrend AI: AI-powered super trend indicator
中文:
EMA显示:13条可配置EMA均线,默认显示8/13/21/34/55/144/233/377/610/987/1597/2584周期
PMA显示:11条可配置移动平均线,支持多种MA类型(ALMA/EMA/RMA/SMA/SWMA/VWAP/VWMA/WMA)
VWAP显示:成交量加权平均价指标
背离指标:12种技术指标的背离检测系统
ATR止损:基于ATR的止损线
Volume SuperTrend AI:基于AI预测的超级趋势指标
2. EMA Settings | EMA设置
English:
13 independent EMA lines, each configurable for visibility and period length
Default shows 21/34/55/144/233/377/610/987/1597/2584 period EMAs
Customizable colors and line widths for each EMA
中文:
13条独立EMA均线,每条均可单独配置显示/隐藏和周期长度
默认显示21/34/55/144/233/377/610/987/1597/2584周期的EMA
每条EMA可设置不同颜色和线宽
3. PMA Settings | PMA设置
English:
11 configurable moving averages, each with:
Selectable types (default EMA, options: ALMA/RMA/SMA/SWMA/VWAP/VWMA/WMA)
Independent period settings (12-1056)
Special ALMA parameters (offset and sigma)
Configurable data source and plot offset
Support for fill areas between MAs
Price lines and labels can be added
中文:
11条可配置移动平均线,每条均可:
选择不同类型(默认EMA,可选ALMA/RMA/SMA/SWMA/VWAP/VWMA/WMA)
独立设置周期长度(12-1056)
设置ALMA的特殊参数(偏移量和sigma)
配置数据源和绘图偏移
支持MA之间的填充区域显示
可添加价格线和标签
4. VWAP Settings | VWAP设置
English:
Multiple anchor period options (Session/Week/Month/Quarter/Year/Decade/Century/Earnings/Dividends/Splits)
3 configurable standard deviation bands
Option to hide on daily and higher timeframes
Configurable data source and offset settings
中文:
多种锚定周期选择(会话/周/月/季/年/十年/世纪/财报/股息/拆股)
3条可配置标准差带
可选择在日线及以上周期隐藏
支持数据源选择和偏移设置
5. Divergence Indicator Settings | 背离指标设置
English:
12 detectable indicators: MACD, MACD Histogram, RSI, Stochastic, CCI, Momentum, OBV, VWmacd, Chaikin Money Flow, MFI, Williams %R, External Indicator
4 divergence types: Regular Bullish/Bearish, Hidden Bullish/Bearish
Multiple display options: Full name/First letter/Hide indicator name
Configurable parameters: Pivot period, data source, maximum bars checked, etc.
Alert functions: Independent alerts for each divergence type
中文:
检测12种指标:MACD、MACD柱状图、RSI、随机指标、CCI、动量、OBV、VWmacd、Chaikin资金流、MFI、威廉姆斯%R、外部指标
4种背离类型:正/负常规背离,正/负隐藏背离
多种显示选项:完整名称/首字母/不显示指标名称
可配置参数:枢轴点周期、数据源、最大检查柱数等
警报功能:各类背离的独立警报
6. ATR Stop Loss Settings | ATR止损设置
English:
Configurable ATR length (default 13)
4 smoothing methods (RMA/SMA/EMA/WMA)
Adjustable multiplier (default 1.618)
Displays long and short stop loss lines
中文:
可配置ATR长度(默认13)
4种平滑方法(RMA/SMA/EMA/WMA)
可调乘数(默认1.618)
显示多头和空头止损线
7. Volume SuperTrend AI Settings | Volume SuperTrend AI设置
English:
AI Prediction:
Configurable neighbors (1-100) and data points (1-100)
Price trend length and prediction trend length settings
SuperTrend Parameters:
Length (default 3)
Factor (default 1.515)
5 MA source options (SMA/EMA/WMA/RMA/VWMA)
Signal Display:
Trend start signals (circle markers)
Trend confirmation signals (triangle markers)
6 Alerts: Various trend start and confirmation signals
中文:
AI预测功能:
可配置邻居数(1-100)和数据点数(1-100)
价格趋势长度和预测趋势长度设置
SuperTrend参数:
长度(默认3)
因子(默认1.515)
5种MA源选择(SMA/EMA/WMA/RMA/VWMA)
信号显示:
趋势开始信号(圆形标记)
趋势确认信号(三角形标记)
6种警报:各类趋势开始和确认信号
Usage Recommendations | 使用建议
English:
Trend Analysis: Use EMA/PMA combinations to determine market trends, with long-period EMAs (e.g., 144/233) as primary trend references
Divergence Trading: Look for potential reversals using price-indicator divergences
Stop Loss Management: Use ATR stop loss lines for risk management
AI Assistance: Volume SuperTrend AI provides machine learning-based trend predictions
Multiple Timeframes: Verify signals across different timeframes
中文:
趋势分析:使用EMA/PMA组合判断市场趋势,长周期EMA(如144/233)作为主要趋势参考
背离交易:结合价格与指标的背离寻找潜在反转点
止损设置:利用ATR止损线管理风险
AI辅助:Volume SuperTrend AI提供基于机器学习的趋势预测
多时间框架:建议在不同时间框架下验证信号
Parameter Configuration Tips | 参数配置技巧
English:
For short-term trading: Focus on 8-55 period EMAs and shorter divergence detection periods
For long-term investing: Use 144-2584 period EMAs with longer detection parameters
In ranging markets: Disable some EMAs, mainly rely on VWAP and divergence indicators
In trending markets: Enable more EMAs and SuperTrend AI
中文:
对于短线交易:可重点关注8-55周期的EMA和较短的背离检测周期
对于长线投资:建议使用144-2584周期的EMA和较长的检测参数
在震荡市:可关闭部分EMA,主要依靠VWAP和背离指标
在趋势市:可启用更多EMA和SuperTrend AI
Update Log | 更新日志
English:
V28 main updates:
Added Volume SuperTrend AI module
Optimized divergence detection algorithm
Added more EMA period options
Improved UI and parameter grouping
中文:
V28版本主要更新:
新增Volume SuperTrend AI模块
优化背离检测算法
增加更多EMA周期选项
改进用户界面和参数分组
Final Note | 最后说明
English: This indicator is suitable for technical traders with some experience. We recommend practicing with demo trading to familiarize yourself with all features before live trading.
中文: 该指标适合有一定经验的技术分析交易者使用,建议先通过模拟交易熟悉各项功能后再应用于实盘。

Golden Sweep - ZTFGolden Sweep - ZTF: Multi-Confluence Reversal Detection System
Purpose & Methodology:
The Golden Sweep combines six distinct market structure analysis methods into a unified confluence system designed to identify high-probability reversal points at inverse Fair Value Gaps (iFVGs). Rather than relying on single-indicator signals, this system requires simultaneous confirmation across multiple independent market dimensions to filter out noise and reduce false signals.
Core Logic & Technical Approach:
1. Fair Value Gap Analysis Foundation
The system begins by detecting standard Fair Value Gaps (price inefficiencies where gaps exist between candle wicks) and monitors when price returns to fill these gaps, creating inverse FVGs. This forms the base signal trigger.
2. Liquidity Sweep Confirmation Engine
Uses pivot-based swing detection to identify when price has recently swept through key support/resistance levels, indicating stop-loss hunting activity. The algorithm tracks recent liquidity events within a configurable lookback period and correlates them with iFVG formations.
3. VWAP Statistical Positioning
Calculates real-time Volume Weighted Average Price with standard deviation bands. Signals are only validated when price is positioned at statistically significant VWAP deviations (configurable zones), ensuring alignment with institutional flow patterns.
4. Balanced Price Range (BPR) Structure Analysis
Detects overlapping bullish and bearish Fair Value Gaps that create consolidation zones. The system identifies when new iFVGs form within or near these balanced ranges, indicating potential breakout reversals from established accumulation/distribution areas.
5. Turtle Soup Reversal Pattern Recognition
Implements Larry Connors' turtle soup methodology to detect false breakouts. Identifies when price penetrates recent highs/lows but closes back within the prior range, indicating failed breakout attempts that often precede strong reversals.
6. Exhaustion Signal Detection
Employs dual-timeframe momentum analysis using Williams %R methodology with optimized smoothing parameters. Detects overbought/oversold exhaustion conditions and confirms when momentum shifts from extreme readings back toward equilibrium, indicating potential trend exhaustion reversals.
Confluence Requirement Logic:
A Golden Sweep signal only triggers when ALL enabled filters simultaneously confirm within their respective lookback periods. This six-dimensional approach significantly reduces signal frequency while increasing reliability by ensuring multiple market forces align before generating alerts.
Session & Timing Integration:
Incorporates session-based filtering to account for varying market dynamics across trading sessions (NY Open, London Close, etc.), as different sessions exhibit distinct liquidity and volatility characteristics.
Implementation Notes:
All calculations use confirmed bar data to prevent repainting
Configurable lookback periods allow adaptation to different timeframes and market conditions
Visual overlays are optional and independent of signal generation logic
Built-in risk management through signal rarity and confluence requirements
This systematic approach addresses the common problem of indicator overload by creating a structured framework where multiple analysis methods must agree before signaling, resulting in fewer but higher-quality trade opportunities.
⚠️ Disclaimer: This indicator is for educational purposes only. It does not constitute financial advice or a recommendation to buy or sell any security. Trading involves risk — always do your own research and use proper risk management.

Gator Trader FX ScannerThe Gator Trader FX Scanner is designed to identify high-probability reversals by combining the Relative Strength Index (RSI) with Bill Williams Divergent Candles.
How It Works:
The scanner continuously scans multiple assets and timeframes for overbought and oversold RSI conditions. It then filters for divergent candles that signal potential shifts in momentum.
Color-Coded Signals:
Dark Green: RSI > 70 (Overbought) — potential for a pullback.
Dark Red: RSI < 30 (Oversold) — watch for possible bounce.
Bright Green: RSI > 70 plus a bearish divergent bar — strong reversal alert to the downside.
Bright Red: RSI < 30 plus a bullish divergent bar — strong reversal alert to the upside.

Briese CoT Movement IndexThis Briese CoT (Commitments of Traders) Movement Index histogram indicator was built based on the formula by Stephen Briese in his book "The Commitments of Traders Bible":
"...difference between the COT Index and its reading of one or several weeks prior. I use six." —Chapter 7, page 75.
The code is a bit of a remix of the "ICT Commitment of Traders°" indicator by toodegrees and is meant for use in a new pane below a Weekly Chart .
The upper and lower thresholds are +40/-40. Some context: "A ± 40 point surge in the COT Index within a six-week period frequently marks the end of a counter-trend price reaction"
40 Point CoT Surge Rules (Commercials) from page 76
"During a correction from a prevailing uptrend, a +40 point movement in the CoT Index within a six-week period often marks the end of a corrective pullback, and the resumption of the major uptrend."
"During a reaction in a prevailing downtrend, a -40 point movement in the CoT Index within a six-week period frequently marks the end of a price reaction, and the resumption of the established downtrend."
"The failure of a ± point CoT Movement Index signal to restart the prevailing trend is a tip-off to a major trend change"
I'd recommend reading Briese's book for examples on how to properly interpret this indictor.
This indicator can be used in conjunction with another one I've published called the "Williams x Briese Hybrid CoT Index" which can be found on my scripts page.

WVAD with Gap Compensation**Indicator Name:** WVAD with Gap Compensation
**Purpose:** Enhances the classic Williams Vix Fix (WVAD) by incorporating the impact of price gaps (jump ups/downs) in its calculation.
**Key Features:**
1. **Gap Detection:** Automatically identifies significant gaps (default: >0.5% from prior bar's high/low).
2. **Gap Compensation:** Adjusts the WVAD calculation by adding the gap size to the daily price change.
3. **Dynamic Weighting:** Applies a multiplier (1.2x or 1.5x) to the WVAD value on days with medium/large gaps (based on ATR).
4. **Visualization:**
- Plots the enhanced WVAD line (blue) and optionally the original WVAD (gray circles).
- Marks gap events with colored arrows (green ▲ for gap up, red ▼ for gap down) and connects the gap's impact with dashed lines.
- Includes a zero line for reference.
**Use Cases:**
- Gauges the true strength of money flow by accounting for gaps.
- Identifies potential trend shifts around gap events.
- Filters noise by focusing on significant gaps.
**Parameters:**
- `Accumulation Period`: Number of days to sum WVAD (default: 12).
- `Gap Threshold (%)`: Minimum gap size to trigger compensation (default: 0.5%).
- `Show Original WVAD`: Toggles display of the classic WVAD.
**Version:** Pine Script® v6

TIME-SPLT ACADEMY INDICATOR# TIME-SPLT ACADEMY CISD + FVG + TSM FRACTALS - Comprehensive Market Structure Analysis Tool
## Overview
This indicator combines three essential market structure analysis components into a unified trading tool: Change in State Direction (CISD), Fair Value Gaps (FVG), and TSM Fractals. This integration provides traders with a complete framework for identifying market structure breaks, price imbalances, and key pivot levels on any timeframe.
## Component 1: CISD (Change in State Direction)
**What it is:** CISD identifies significant breaks in market structure by tracking when price decisively breaks above previous swing highs (bullish CISD) or below previous swing lows (bearish CISD). This concept is fundamental to understanding trend changes and continuation patterns.
**How it works:**
- Monitors swing highs and lows using customizable pivot periods
- Tracks when price closes above a previous swing high (bullish structure break)
- Tracks when price closes below a previous swing low (bearish structure break)
- Draws horizontal lines from the pivot point to the break point with "CISD" labels
- Works on multiple timeframes simultaneously
**Trading Applications:**
- Identifies trend changes and continuation signals
- Provides entry signals on structure breaks
- Helps determine market bias and direction
## Component 2: FVG (Fair Value Gaps)
**What it is:** Fair Value Gaps are price imbalances that occur when there's a gap between the high of one candle and the low of another candle two periods later, with the middle candle not filling this gap. These represent areas where price moved inefficiently and often return to "fill" the gap.
**How it works:**
- Analyzes 3-candle patterns to identify gaps
- Bearish FVG: Gap between low and high where price dropped leaving unfilled space above
- Bullish FVG: Gap between high and low where price rose leaving unfilled space below
- Tracks 8 different candle body combinations for each direction (up, down, doji patterns)
- Monitors gap mitigation when price returns to fill the imbalance
- Changes color when gaps are partially or fully mitigated
**Gap Detection Logic:**
- Bearish FVG patterns: DDD, DDJ, JDD, UDJ, JDU, UDD, DDU, UDU
- Bullish FVG patterns: DUD, DUJ, JUD, UUJ, JUU, UUD, DUU, UUU
- (D=Down candle, U=Up candle, J=Doji candle)
**Trading Applications:**
- High-probability reversal zones when price returns to FVGs
- Support and resistance levels
- Target areas for limit orders
- Risk management reference points
## Component 3: TSM Fractals
**What it is:** TSM Fractals identify significant pivot highs and lows using Williams Fractal methodology. These mark potential reversal points and key support/resistance levels.
**How it works:**
- Identifies fractal highs: peaks where the center candle's high is higher than surrounding candles
- Identifies fractal lows: valleys where the center candle's low is lower than surrounding candles
- Uses customizable lookback periods (default 15) for fractal identification
- Displays horizontal lines with "$" symbols at fractal levels
- Maintains a configurable number of recent fractals on the chart
**Trading Applications:**
- Key support and resistance levels
- Potential reversal zones
- Confluence with other analysis tools
- Stop loss placement reference points
## Why This Combination Works
**Synergistic Analysis:** Each component provides different but complementary information:
1. **CISD** shows when market structure changes, indicating trend shifts or continuation
2. **FVGs** reveal where price has moved inefficiently and may return for rebalancing
3. **Fractals** highlight key pivot points that often act as support/resistance
**Trading Edge:** The combination allows for:
- **Entry Confirmation:** Wait for CISD breaks near unfilled FVGs at fractal levels
- **Risk Management:** Use FVG boundaries and fractal levels for stop placement
- **Target Selection:** Project moves to opposite FVGs or fractal levels
- **Market Context:** Understand whether you're trading with or against structure
## Key Features
**Multi-Timeframe CISD:**
- Customizable timeframe settings (Minute, Hour, Day, Week, Month)
- Adjustable swing length for pivot identification
- Customizable line styles, widths, and colors
- Optional alerts on structure breaks
**Advanced FVG Management:**
- Automatic gap size filtering
- Real-time mitigation tracking
- Color-coded active vs. mitigated gaps
- Optional pip value labels
- Large gap alerts for significant imbalances
**Intelligent Fractal Display:**
- Configurable fractal periods
- Maximum fractal count management
- Clean visual presentation
- Historical fractal preservation
## Settings & Customization
**CISD Settings:**
- Timeframe selection and multipliers
- Swing length adjustment (default 7)
- Line styling options
- Color customization for bullish/bearish breaks
- Alert toggle options
**FVG Settings:**
- Show/hide toggles for each direction
- Minimum gap size filtering
- Alert threshold for large gaps
- Color schemes for active and mitigated gaps
- Optional size labels in pips
**Fractal Settings:**
- Fractal period adjustment (default 15)
- Maximum display count (default 10)
- Show/hide toggle
## Educational Value
This indicator teaches traders to:
- Understand market structure concepts
- Recognize price inefficiencies
- Identify key pivot points
- Combine multiple analysis methods
- Develop systematic trading approaches
## Use Cases
**Swing Trading:** Identify major structure breaks with FVG confluence
**Day Trading:** Use lower timeframe CISDs with intraday FVGs
**Scalping:** Quick entries at FVG mitigation near fractal levels
**Position Trading:** Higher timeframe structure analysis with major FVGs
## Technical Implementation
- Utilizes Pine Script v6 for optimal performance
- Efficient array management for historical data
- Real-time calculations without repainting
- Memory-optimized box and line management
- Multi-timeframe data handling with proper security functions
This comprehensive tool eliminates the need for multiple separate indicators, providing everything needed for complete market structure analysis in one cohesive package. The educational component helps traders understand not just what the signals are, but why they work and how to use them effectively in different market conditions.

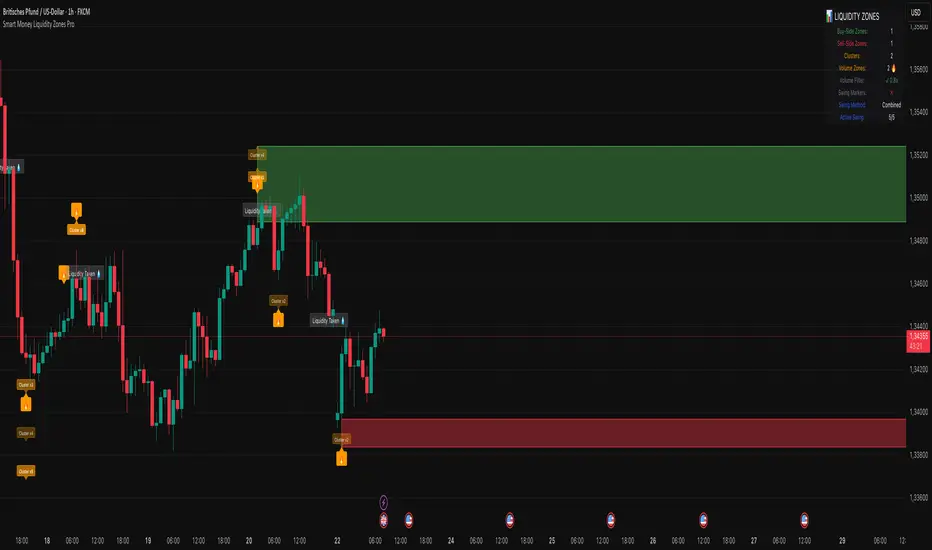
Smart Money Liquidity Zones ProThe Smart Money Liquidity Zones Pro indicator identifies and visualizes key liquidity areas in the market where institutional traders (smart money) are likely to have placed their stop-loss orders. These zones represent areas of high liquidity that often act as magnets for price, making them valuable reference points for trading decisions.
What the Indicator Does
Core Functionality
Swing Point Detection: The indicator identifies significant swing highs and lows using three different methods (Classic, Fractal, or Combined) to locate potential liquidity pools.
Liquidity Zone Creation: At each valid swing point, the indicator creates a horizontal zone representing an area where stop-loss orders are likely clustered.
Zone Clustering: When multiple swing points occur near the same price level, the indicator intelligently combines them into larger cluster zones, indicating stronger liquidity areas.
Volume Confirmation: The indicator can filter zones based on volume, showing only those swing points that occurred with significant trading volume.
Zone Break Detection: When price closes through a liquidity zone, the indicator marks it as "Liquidity Taken" and removes the zone from the chart.
Zone Types
Buy-Side Liquidity Zones (Green): Created at swing highs where short sellers' stop-losses are likely placed
Sell-Side Liquidity Zones (Red): Created at swing lows where long traders' stop-losses are likely placed
Trading Strategies
Basic Concepts
Liquidity Runs: Price often moves toward these zones to trigger stop-loss orders before reversing. This creates trading opportunities.
Support and Resistance: Unbroken liquidity zones can act as support (sell-side) or resistance (buy-side) levels.
Breakout Confirmation: When price breaks through a zone with strong momentum, it often continues in that direction.
Entry Strategies
Strategy 1: Liquidity Grab Reversa l
Wait for price to spike into a liquidity zone
Look for rejection candles (wicks) at the zone
Enter in the opposite direction after confirmation
Place stop-loss beyond the liquidity zone
Strategy 2: Zone Break Continuation
Wait for price to close decisively through a zone
Enter on the retest of the broken zone
Target the next liquidity zone in the direction of the break
Strategy 3: Zone Clustering Trade
Focus on areas with multiple overlapping zones (clusters)
These areas offer higher probability setups
Trade bounces from cluster zones with tighter risk management
Risk Management
Always use stop-losses beyond the liquidity zones
Consider the overall market context and trend
Zones on higher timeframes are generally more significant
Volume-confirmed zones have higher reliability
Settings Explanation
Swing Detection Settings
Swing Strength (Lookback Bars)
Determines how many bars to look back for swing point validation
Higher values find more significant swings but fewer zones
Recommended settings:
1m-5m charts: 3-5
15m-1h charts: 5-8
Daily charts: 5-10
Weekly charts: 3-5
Monthly charts: 2-3
Adaptive Swing Detection
Automatically adjusts swing detection based on available historical data
Prevents errors when there's limited chart history
Recommended to keep enabled
Minimum Bars for Swing
Sets the absolute minimum bars required for swing detection
Lower values allow detection in limited data conditions
Swing Detection Method
Classic: Strict price comparison for pure swing highs/lows
Fractal: Williams Fractal pattern (2 bars on each side)
Combined: Uses both methods for maximum zone detection
Auto-Adjust for Timeframe
Automatically optimizes settings based on chart timeframe
Prevents inappropriate settings on higher timeframes
Zone Settings
Max Number of Visible Zones
Limits the number of zones displayed to prevent chart clutter
Older zones are automatically removed
Max Zone Duration (Bars)
Zones older than this are automatically deleted
Keeps the chart focused on recent liquidity areas
Enable Zone Clustering
Groups nearby zones into larger clusters
Identifies stronger liquidity areas
Cluster Threshold (%)
Maximum price distance for zones to be clustered
Lower values create tighter clusters
Show Cluster Labels
Displays "Cluster x2", "Cluster x3" etc. on grouped zones
Volume Filter Settings
Enable Volume Filter
When enabled, only creates zones at high-volume swing points
Increases zone quality but reduces quantity
Volume Multiplier
Multiplier for average volume to determine "high volume"
Lower values (0.7-0.9) create more zones
Higher values (1.2+) create fewer, higher-quality zones
Volume SMA Period
Period for calculating average volume
Higher values create smoother volume baseline
Show Volume Confirmation Icon
Displays a fire emoji on volume-confirmed zones
Volume Visualization Settings
Show Volume Dots
Displays dots below high-volume bars
Dynamic Zone Colors
Volume-confirmed zones appear with more intense colors
Show Volume Background
Highlights the chart background on high-volume bars
Visual Settings
Buy-Side/Sell-Side Zone Colors
Customize colors for long and short liquidity zones
Border Width
Thickness of zone borders (1-3)
Show 'Liquidity Taken' Labels
Displays labels when zones are broken
Label Size
Size of the liquidity taken labels
Show Swing Point Markers
Displays triangles at detected swing points
Show Debug Info
Shows diagnostic information for troubleshooting
Dashboard Settings
Show Dashboard
Toggles the information panel display
Dashboard Position
Choose from 6 positions on the chart
Background Color
Dashboard background color
Text Color
Dashboard text color
Text Size
Dashboard text size (tiny/small/normal/large)
Tips for Effective Use
Start with default settings and adjust based on your trading style and timeframe
Use multiple timeframes to identify confluence between zones on different scales
Combine with other indicators like trend analysis or momentum oscillators
Pay attention to clusters as they represent stronger liquidity areas
Monitor volume-confirmed zones for higher probability setups
Adjust zone duration based on your trading timeframe (shorter for scalping, longer for swing trading)
Use the debug feature if zones aren't appearing to understand why
Keep the chart clean by limiting the number of visible zones
Common Issues and Solutions
No zones appearing:
Lower the Swing Strength setting
Switch to Combined detection method
Disable volume filter if active
Check if there's enough historical data
Too many zones:
Increase Swing Strength
Enable volume filter
Reduce Max Number of Visible Zones
Increase Cluster Threshold
Zones disappearing too quickly:
Increase Max Zone Duration
Check if zones are being broken by price
Poor performance on higher timeframes:
Enable Auto-Adjust for Timeframe
Use appropriate Swing Strength for the timeframe
Consider using Classic method instead of Fractal
Cycle Composite 3.6 WeightedThe Cycle Composite is a multi-factor market cycle model designed to classify long-term market behavior into distinct phases using normalized and weighted data inputs.
It combines ten key on-chain, dominance, volatility, sentiment, and trend-following metrics into a single composite output. The goal is to provide a clearer understanding of where the market may stand in the broader cycle (e.g., accumulation, early bull, late bull, or euphoria).
This version (3.4) introduces flexible weighting, trend strength markers, and additional context-aware signals such as risk-on confirmations and altseason flags.
Phases Identified:
The model categorizes the market into one of five zones:
Euphoria (> 85)
Late Bull (70 – 85)
Mid Bull (50 – 70)
Early Bull (30 – 50)
Fear (< 30)
Each phase is determined by a smoothed EMA of the weighted composite score.
Data Sources and Metrics Used (10 total):
BTC Dominance (CRYPTOCAP:BTC.D)
Stablecoin Dominance (USDT + USDC average) (inverted for risk-on)
ETH Dominance (CRYPTOCAP:ETH.D)
BBWP (normalized Bollinger Band Width % over 1-year window)
WVF (Williams VIX Fix for volatility spike detection)
NUPL (Net Unrealized Profit/Loss, external source)
CMF (Chaikin Money Flow, smoothed volume accumulation)
CEX Open Interest (custom input from DAO / external source)
Whale Inflows (custom input from whale exchange transfer data)
Google Trends Average (BTC, Crypto, Altcoin terms)
All inputs are normalized over a 200-bar window and combined via weighted averaging, where each weight is user-configurable.
Additional Features:
Phase Labels: Labels are printed only when a new phase is entered.
Bull Continuation Marker: Triangle up when composite makes higher highs and NUPL increases.
Weakening Marker: Triangle down when composite rolls over in Late Bull and NUPL falls.
Risk-On Signal: Green circle appears when CMF and Google Trends are both rising.
Altseason Flag: Orange diamond appears when dominance of "others.d" exceeds BTC.D and ETH.D and composite is above 50.
Background Shading: Each phase is shaded with a semi-transparent background color.
Timeframe-Aware Display: All markers and signals are shown only on weekly timeframe for clarity.
Intended Use:
This script is intended for educational and macro-trend analysis purposes.
It can be used to:
Identify macro cycle position (accumulation, bull phases, euphoria, etc.)
Spot long-term trend continuation or weakening signals
Add context to price action with external on-chain and sentiment data
Time rotation events such as altseason risk
Disclaimer:
This script does not constitute financial advice.
It is intended for informational and research purposes only.
Users should conduct their own due diligence and analysis before making investment decisions.

Quantum Market Intelligence (QMI)Quantum Market Intelligence (QMI) Indicator
The Quantum Market Intelligence (QMI) is a sophisticated multi-factor technical indicator that combines four key market analysis components into a single composite score. This indicator provides traders with a comprehensive market assessment tool that adapts to changing market conditions. The QMI score oscillates between -100 and +100, offering clear visual signals through color-coded plotting and an informative dashboard display.
The indicator analyzes markets through four distinct lenses: Trend Analysis (using EMAs and volatility-adjusted momentum), Momentum Analysis (combining RSI, Stochastic, and Williams %R), Volume Analysis (incorporating volume ratios and Accumulation/Distribution), and Volatility Analysis (utilizing ATR and Bollinger Bands). These components are intelligently weighted based on detected market regimes - whether trending, volatile, or range-bound. The adaptive mode feature continuously evaluates the indicator's recent performance and adjusts sensitivity accordingly, making it responsive to evolving market dynamics.
Traders can utilize the QMI's signal system which generates four types of alerts: Strong Buy (above 70 and rising), Buy (crossing above 30), Strong Sell (below -70 and falling), and Sell (crossing below -30). The visual presentation includes triangular markers for strong signals, circular markers for regular signals, and background shading that indicates the current market regime. The information table displays real-time metrics including the QMI score, individual component scores, detected market regime, and performance ratio, providing traders with a complete analytical dashboard for informed decision-making.
Important Notice:
The use of this technical indicator does not guarantee profitable results. This indicator should not be used as a standalone analysis tool. It is essential to combine it with other forms of analysis, such as fundamental analysis, risk management strategies, and awareness of current market conditions. Always conduct thorough research.
Note: The effectiveness of any technical indicator can vary based on market conditions and individual trading styles. It's crucial to test indicators thoroughly using historical data before applying them in live trading scenarios.
Disclaimer:
Trading financial instruments involves substantial risk and may not be suitable for all investors. Past performance is not indicative of future results. This indicator is provided for informational and educational purposes only and should not be considered investment advice. Always conduct your own research before making any trading decisions.

Vix_Fix Enhanced MTF [Cometreon]The VIX Fix Enhanced is designed to detect market bottoms and spikes in volatility, helping traders anticipate major reversals with precision. Unlike standard VIX Fix tools, this version allows you to control the standard deviation logic, switch between chart styles, customize visual outputs, and set up advanced alerts — all with no repainting.
🧠 Logic and Calculation
This indicator is based on Larry Williams' VIX Fix and integrates features derived from community requests/advice, such as inverse VIX logic.
It calculates volatility spikes using a customizable standard deviation of the lows and compares it to a moving high to identify potential reversal points.
All moving average logic is based on Cometreon's proprietary library, ensuring accurate and optimized calculations on all 15 moving average types.
🔷 New Features and Improvements
🟩 Custom Visual Styles
Choose how you want your VIX data displayed:
Line
Step Line
Histogram
Area
Column
You can also flip the orientation (bottom-up or top-down), change the source ticker, and tailor the display to match your charting preferences.
🟩 Multi-MA Standard Deviation Calculation
Customize the standard deviation formula by selecting from 15 different moving averages:
SMA (Simple Moving Average)
EMA (Exponential Moving Average)
WMA (Weighted Moving Average)
RMA (Smoothed Moving Average)
HMA (Hull Moving Average)
JMA (Jurik Moving Average)
DEMA (Double Exponential Moving Average)
TEMA (Triple Exponential Moving Average)
LSMA (Least Squares Moving Average)
VWMA (Volume-Weighted Moving Average)
SMMA (Smoothed Moving Average)
KAMA (Kaufman’s Adaptive Moving Average)
ALMA (Arnaud Legoux Moving Average)
FRAMA (Fractal Adaptive Moving Average)
VIDYA (Variable Index Dynamic Average)
This gives you fine control over how volatility is measured and allows tuning the sensitivity for different market conditions.
🟩 Full Control Over Percentile and Deviation Conditions
You can enable or disable lines for standard deviation and percentile conditions, and define whether you want to trigger on over or under levels — adapting the indicator to your exact logic and style.
🟩 Chart Type Selection
You're no longer limited to candlestick charts! Now you can use Vix_Fix with different chart formats, including:
Candlestick
Heikin Ashi
Renko
Kagi
Line Break
Point & Figure
🟩 Multi-Timeframe Compatibility Without Repainting
Use a different timeframe from your chart with confidence. Signals remain stable and do not repaint. Perfect for spotting long-term reversal setups on lower timeframes.
🟩 Alert System Ready
Configure alerts directly from the indicator’s panel when conditions for over/under signals are met. Stay informed without needing to monitor the chart constantly.
🔷 Technical Details and Customizable Inputs
This indicator includes full control over the logic and appearance:
1️⃣ Length Deviation High - Adjusts the lookback period used to calculate the high deviation level of the VIX logic. Shorter values make it more reactive; longer values smooth out the signal.
2️⃣ Ticker - Choose a different chart type for the calculation, including Heikin Ashi, Renko, Kagi, Line Break, and Point & Figure.
3️⃣ Style VIX - Change the visual style (Line, Histogram, Column, etc.), adjust line width, and optionally invert the display (bottom-to-top).
📌 Fill zones for deviation and percentile are active only in Line and Step Line modes
4️⃣ Use Standard Deviation Up / Down - Enable the overbought and oversold zone logic based on upper and lower standard deviation bands.
5️⃣ Different Type MA (for StdDev) - Choose from 15 different moving averages to define the calculation method for standard deviation (SMA, EMA, HMA, JMA, etc.), with dedicated parameters like Phase, Sigma, and Offset for optimized responsiveness.
6️⃣ BB Length & Multiplier - Adjust the period and multiplier for the standard deviation bands, similar to how Bollinger Bands work.
7️⃣ Show StdDev Up / Down Line - Enable or disable the visibility of upper and lower standard deviation boundaries.
8️⃣ Use Percentile & Length High - Activate the percentile-based logic to detect extreme values in historical volatility using a customizable lookback length.
9️⃣ Highest % / Lowest % - Set the high and low percentile thresholds (e.g., 85 for high, 99 for low) that will be used to trigger over/under signals.
🔟 Show High / Low Percentile Line - Toggle the visual display of the percentile boundaries directly on the chart for clearer signal reference.
1️⃣1️⃣ Ticker Settings – Customize parameters for special chart types such as Renko, Heikin Ashi, Kagi, Line Break, and Point & Figure, adjusting reversal, number of lines, ATR length, etc.
1️⃣2️⃣ Timeframe – Enables using SuperTrend on a higher timeframe.
1️⃣3️⃣ Wait for Timeframe Closes -
✅ Enabled – Displays Vix_Fix smoothly with interruptions.
❌ Disabled – Displays Vix_Fix smoothly without interruptions.
☄️ If you find this indicator useful, leave a Boost to support its development!
Every feedback helps to continuously improve the tool, offering an even more effective trading experience. Share your thoughts in the comments! 🚀🔥

Stochastics + VixFix Buy/Sell SignalsThis script is designed for long-term investors using ETFs on a weekly timeframe, where catching high-probability bottoms is the goal. It combines the Stochastic Oscillator with the Williams VixFix to identify moments of extreme fear and potential reversals.
A Buy signal is triggered when:
Stochastic %K drops below 20
VixFix forms a green spike (suggesting a panic-driven market flush)
A Sell signal is triggered when:
Stochastic %K rises above 90
VixFix falls below 5 (indicating excessive complacency)
Catching tops is much harder than catching bottoms.
These Sell signals are not designed to fully exit positions. Instead, they suggest trimming a small portion of ETF holdings — simply to free up liquidity for future opportunities.
This strategy is ideal for:
Long-term ETF investors
Weekly charts
Systematic decision-making in volatile markets
Use in conjunction with macro indicators, sector rotation, and valuation frameworks for best results.

DT_KEY_LEVELSDT_Key_Levels: Powerful Market Structure Analysis Indicator
DT_Key_Levels is an advanced indicator for fundamental market structure analysis, optimized for higher timeframes (D1, W, M). The indicator combines three powerful technical analysis tools — fractals, Fair Value Gaps (FVG), and psychological levels — in one comprehensive solution.
Three Components of the Indicator
1. Enhanced Fractal System
The indicator uses an improved version of Bill Williams' classic fractals, allowing for deeper market structure analysis:
Dual Identification System:
Standard 5-bar fractals (displayed with thick lines) for analyzing reliable support/resistance levels
Light 3-bar fractals (displayed with thin lines) for early identification of potential reversal points
Intelligent Tracking System:
Automatic detection and filtering of completed fractals
Marking fractals with corresponding timeframe designation (HTF-1D, HTF-1W, HTF-1M)
Tracking and marking the All-Time High (ATH)
2. Fair Value Gaps (FVG) System
The indicator identifies and visualizes price gaps in market structure — zones that often act as magnets for future price movements:
Precise Identification of Inefficient Zones:
Bullish FVG: when the current candle's low is above the -2 candle's high
Bearish FVG: when the current candle's high is below the -2 candle's low
Detailed Visualization:
Clear display of upper and lower boundaries of each FVG
Midline (0.5 FVG) for determining key reaction levels within the gap
Marking each FVG with "FF" (Fair value Fill) label for quick identification
Dynamic Management:
Automatic removal of FVGs when they are filled by price movement
Customizable line extension for improved tracking of target zones
3. Intelligent Psychological Levels
The indicator automatically determines key psychological levels with adaptation to the type of instrument being traded:
Specialized Calibration for Various Assets:
Forex (EUR/USD, GBP/USD, USD/JPY): optimization for standard figures and round values
Precious metals (XAUUSD): adaptation to typical gold reaction zones with a $50 step
Cryptocurrencies (BTC, ETH): dynamic step adjustment depending on current price zone
Stock indices (NASDAQ, S&P500, DAX): accounting for the movement characteristics of each index
Smart Adaptation System:
Automatic determination of the optimal step for any instrument
Generation of up to 24 key levels, evenly distributed around the current price
Intelligent filtering to display only significant levels
Practical Application
Strategic Analysis
Identifying Key Structural Levels:
Use monthly and weekly fractals to determine strategic support/resistance zones
Look for coincidences of fractals with psychological levels to identify particularly strong zones of interest
Determine long-term barriers using type 5 fractals on higher timeframes
Analysis of Market Inefficiencies:
Track the formation of FVGs as potential targets for future movements
Use FVG midlines (0.5) as important internal reaction levels
Analyze the speed of FVG filling to understand trend strength
Tactical Trading Decisions
Entry Points and Risk Management:
Use bounces from fractals in the direction of the larger trend as a signal for entry
Place stop-losses behind fractal levels or key psychological levels
Monitor the formation of new fractals as a signal of potential reversal
Determining Target Levels:
Use unfilled FVGs as natural price targets
Apply nearby psychological levels for partial position closing
Project higher timeframe fractals to determine long-term goals
Indicator Advantages
Comprehensive Approach: combining three methodologies for a complete understanding of market structure
Intelligent Adaptation: automatic adjustment to the characteristics of different types of assets
Clean Visual Presentation: despite the abundance of information, the indicator maintains clarity of display
Effective Signal Filtering: automatic removal of completed levels to reduce visual noise
Higher Timeframe Optimization: specifically designed for daily, weekly and monthly charts
Usage Recommendations
Use the indicator only on D1, W, and M timeframes for the most reliable signals
Pay special attention to areas where different types of signals coincide (e.g., fractal + psychological level)
Use higher timeframe fractals as key zones for medium and long-term trading
Track FVGs as potential target zones and focus on their filling

Pro Scalper AI [BullByte]The Pro Scalper AI is a powerful, multi-faceted scalping indicator designed to assist active traders in identifying short-term trading opportunities with precision. By combining trend analysis, momentum indicators, dynamic weighting, and optional AI forecasting, this tool provides both immediate and latched trading signals based on confirmed (closed bar) data—helping to avoid repainting issues. Its flexible design includes customizable filters such as a higher timeframe trend filter, and adjustable settings for ADX, ATR, and Hull Moving Average (HMA), giving traders the ability to fine-tune the strategy to different markets and timeframes.
Key Features :
- Confirmed Data Processing :
Utilizes a helper function to lock in price and volume data only from confirmed (closed) bars, ensuring the reliability of signals without the risk of intrabar repainting.
- Trend Analysis :
Employs ADX and Directional Movement (DI) calculations along with a locally computed HMA to detect short-term trends. An optional higher timeframe trend filter can further refine the analysis.
- Flexible Momentum Modes :
Choose between three momentum calculation methods—Stochastic RSI, Fisher RSI, or Williams %R—to match your preferred style of analysis. This versatility allows you to optimize the indicator for different market conditions.
- Dynamic Weighting & Volatility Adjustments :
Adjusts the contribution of trend, momentum, volatility, and volume through dynamic weighting. This ensures that the indicator responds appropriately to varying market conditions by scaling its sensitivity with user-defined maximum factors.
- Optional AI Forecast :
For those who want an extra edge, the built-in AI forecasting module uses linear regression to predict future price moves and adjusts oscillator thresholds accordingly. This feature can be toggled on or off, with smoothing options available for more stable output.
- Latching Mode for Signal Persistenc e:
The script features a latching mechanism that holds signals until a clear reversal is detected, preventing whipsaws and providing more reliable trade entries and exits.
- Comprehensive Visualizations & Dashboard :
- Composite Oscillator & Dynamic Thresholds : The oscillator is plotted with dynamic upper and lower thresholds, and the area between them is filled with a color that reflects the active trading signal (e.g., Strong Buy, Early Sell).
- Signal Markers : Both immediate (non-latching) and stored (latched) signals are marked on the chart with distinct shapes (circles, crosses, triangles, and diamonds) to differentiate between signal types.
- Real-Time Dashboard : A customizable dashboard table displays key metrics including ADX, oscillator value, chosen momentum mode, HMA trend, higher timeframe trend, volume factor, AI bias (if enabled), and more, allowing traders to quickly assess market conditions at a glance.
How to Use :
1. S ignal Interpretation :
- Immediate Signals : For traders who prefer quick entries, the indicator displays immediate signals such as “Strong Buy” or “Early Sell” based on the current market snapshot.
- Latched Signals : When latching is enabled, the indicator holds a signal state until a clear reversal is confirmed, offering sustained trade setups.
2. Trend Confirmation :
- Use the HMA trend indicator and the optional higher timeframe trend filter to confirm the prevailing market direction before acting on signals.
3. Dynamic Thresholds & AI Forecasting :
- Monitor the dynamically adjusted oscillator thresholds and, if enabled, the AI bias to gauge potential shifts in market momentum.
4. Risk Management :
- Combine these signals with additional analysis and sound risk management practices to determine optimal entry and exit points for scalping trades.
Disclaimer :
This script is provided for educational and informational purposes only and does not constitute financial advice. Trading involves risk, and past performance is not indicative of future results. Always perform your own analysis and use proper risk management strategies before trading.

Professional MSTI+ Trading Indicator"Professional MSTI+ Trading Indicator" is a comprehensive technical analysis tool that combines over 20 indicators to generate high-quality trading signals and assess market sentiment. The script integrates standard indicators (MACD, RSI, Bollinger Bands, Stochastic, Simple Moving Averages, and Volume Analysis) with advanced components (Squeeze Momentum, Fisher Transform, True Strength Index, Heikin-Ashi, Laguerre RSI, Hull MA) and further includes metrics such as ADX, Chaikin Money Flow, Williams %R, VWAP, and EMA for in-depth market analysis.
Key Features:
Multiple Presets for Different Trading Styles:
Choose from optimal configurations like Professional, Swing Trading, Day Trading, Scalping, or Reversal Hunter. Note that the presets may not work perfectly on all pairs, and manual calibration might be required. This flexibility allows you to fine-tune the settings to align with your unique strategies and signals.
Multi-Layered Signal Filtering:
Filters based on trend, volume, and volatility help eliminate false signals, enhancing the accuracy of market entries.
Comprehensive Fear & Greed Index:
The indicator aggregates data from RSI, volatility, momentum, trend, and volume to gauge overall market sentiment, providing an additional layer of market context.
Dynamic Information Panel:
Displays detailed status updates for each component (e.g., MACD, RSI, Laguerre RSI, TSI, Fisher Transform, Squeeze, Hull MA, etc.) along with a visual strength bar that represents the intensity of the trading signal.
Signal Generation:
Buy and sell signals are generated when a predefined number of conditions are met and confirmed over multiple bars. These signals are clearly displayed on the chart with arrows, making it easier to spot potential entry and exit points.
Alert Setup:
Built-in alert conditions allow you to receive real-time notifications when trading signals are generated, helping you stay on top of market movements.
"Professional MSTI+ Trading Indicator" is designed to enhance your trading strategy by providing a multi-faceted market analysis and an intuitive visual interface. While the presets offer a robust starting point, they may require manual calibration on certain pairs, giving you the flexibility to configure your own unique strategies and signals.

Optimized WPR Strategy with Filters (Debug)Identifying Market Trends:
The 200-period EMA is used to determine the short-term trend of the market.
When the price is above the 200-period EMA, it suggests a potential bullish market and an uptrend, and the strategy will only look for buying opportunities.
When the price is below the 200-period EMA, it suggests a potential bearish market and a downtrend, and the strategy will only look for selling opportunities.
When the 200-period EMA intersects with the price, it indicates that the market may be in a directionless consolidation phase.
Identifying Potential Reversal Points:
The strategy employs two Williams %R (WPR) indicators: one with a 9-period (fast WPR) and another with a 28-period (slow WPR).
WPR is a momentum indicator used to identify overbought and oversold conditions in the market. Its value oscillates between -100 and 0, with values near -100 indicating oversold conditions and values near 0 indicating overbought conditions.
In an uptrend (when the price is above the 200 EMA), the strategy seeks buying opportunities when both WPR indicators cross above -80 (the oversold zone) from below. This is considered a bullish signal, suggesting the market may be about to rebound. Sell signals are ignored at this time.
In a downtrend (when the price is below the 200 EMA), the strategy seeks selling opportunities when both WPR indicators cross below -20 (the overbought zone) from above. This is considered a bearish signal, suggesting the market may be about to reverse downward. Buy signals are ignored at this time.
Summary:
In summary, this strategy first uses the 200-period EMA to determine the overall trend direction of the market. Then, within the confirmed trend direction, it utilizes the simultaneous crossing of the overbought or oversold zones by the dual WPR indicators to identify potential reversal points as entry signals for trading. The strategy emphasizes that trading signals are only valid when both WPR indicators meet the conditions.
Hull Moving Average Adaptive RSI (Ehlers)Hull Moving Average Adaptive RSI (Ehlers)
The Hull Moving Average Adaptive RSI (Ehlers) is an enhanced trend-following indicator designed to provide a smooth and responsive view of price movement while incorporating an additional momentum-based analysis using the Adaptive RSI.
Principle and Advantages of the Hull Moving Average:
- The Hull Moving Average (HMA) is known for its ability to track price action with minimal lag while maintaining a smooth curve.
- Unlike traditional moving averages, the HMA significantly reduces noise and responds faster to market trends, making it highly effective for detecting trend direction and changes.
- It achieves this by applying a weighted moving average calculation that emphasizes recent price movements while smoothing out fluctuations.
Why the Adaptive RSI Was Added:
- The core HMA line remains the foundation of the indicator, but an additional analysis using the Adaptive RSI has been integrated to provide more meaningful insights into momentum shifts.
- The Adaptive RSI is a modified version of the traditional Relative Strength Index that dynamically adjusts its sensitivity based on market volatility.
- By incorporating the Adaptive RSI, the HMA visually represents whether momentum is strengthening or weakening, offering a complementary layer of analysis.
How the Adaptive RSI Influences the Indicator:
- High Adaptive RSI (above 65): The market may be overbought, or bullish momentum could be fading. The HMA turns shades of red, signaling a possible exhaustion phase or potential reversals.
- Neutral Adaptive RSI (around 50): The market is in a balanced state, meaning neither buyers nor sellers are in clear control. The HMA takes on grayish tones to indicate this consolidation.
- Low Adaptive RSI (below 35): The market may be oversold, or bearish momentum could be weakening. The HMA shifts to shades of blue, highlighting potential recovery zones or trend slowdowns.
Why This Combination is Powerful:
- While the HMA excels in tracking trends and reducing lag, it does not provide information about momentum strength on its own.
- The Adaptive RSI bridges this gap by adding a clear visual layer that helps traders assess whether a trend is likely to continue, consolidate, or reverse.
- This makes the indicator particularly useful for spotting trend exhaustion and confirming momentum shifts in real-time.
Best Use Cases:
- Works effectively on timeframes from 1 hour (1H) to 1 day (1D), making it suitable for swing trading and position trading.
- Particularly useful for trading indices (SPY), stocks, forex, and cryptocurrencies, where momentum shifts are frequent.
- Helps identify not just trend direction but also whether that trend is gaining or losing strength.
Recommended Complementary Indicators:
- Adaptive Trend Finder: Helps identify the dominant long-term trend.
- Williams Fractals Ultimate: Provides key reversal points to validate trend shifts.
- RVOL (Relative Volume): Confirms significant moves based on volume strength.
This enhanced HMA with Adaptive RSI provides a powerful, intuitive visual tool that makes trend analysis and momentum interpretation more effective and efficient.
This indicator is for educational and informational purposes only. It should not be considered financial advice or a guarantee of performance. Always conduct your own research and use proper risk management when trading. Past performance does not guarantee future results.

Multi-Timeframe RPM Gauges with Custom Timeframes by DiGetIntroducing the **Multi-Timeframe RPM Gauges with Custom Timeframes + RSI Combos (mod) by DiGet** – a cutting-edge TradingView indicator meticulously crafted to revolutionize your market analysis.
Imagine having a dynamic dashboard right on your chart that consolidates the power of nine essential technical indicators—RSI, CCI, Stochastic, Williams %R, EMA crossover, Bollinger Bands, ATR, MACD, and Ichimoku Cloud—across multiple timeframes. This indicator not only displays each indicator’s score through an intuitive gauge system but also computes a combined metric to provide you with an at-a-glance understanding of market momentum and potential trend shifts.
**Key Features:**
- **Multi-Timeframe Insight:**
Configure up to four custom timeframes (e.g., 1, 5, 15, 60 minutes) to capture both short-term fluctuations and long-term trends, ensuring you never miss critical market moves.
- **Comprehensive Signal Suite:**
Benefit from a harmonious blend of signals. Whether you rely on momentum indicators like RSI and CCI, volatility measures like Bollinger Bands and ATR, or trend confirmations via EMA, MACD, and Ichimoku, every metric is normalized into actionable percentages.
- **Dynamic, Color-Coded Gauge Display:**
A built-in table presents all your data in a clear, color-coded format—green for bullish, red for bearish, and gray for neutral conditions. This visual representation allows you to quickly gauge market sentiment without sifting through complex charts.
- **Customizable Layout:**
Tailor your experience by toggling individual table columns. Whether you want to focus solely on RSI or dive deep into combined metrics like RSI & CCI or RSI & MACD, the choice is yours.
- **Optimized Utility Functions:**
Proprietary functions standardize indicator values into percentage scores, making it simpler than ever to compare different signals and spot opportunities in real time.
- **User-Friendly Interface:**
Designed for both beginners and seasoned traders, the straightforward input settings let you easily adjust technical parameters and timeframes to suit your personal trading strategy.
This indicator is not just a tool—it’s your new trading companion. It equips you with a multi-dimensional view of the market, enabling faster, more informed decision-making. Whether you’re scanning across various assets or drilling down on a single chart, the Multi-Timeframe RPM Gauges empower you to interpret market data with unprecedented clarity.
Add this indicator to your TradingView chart today and experience a smarter, more efficient way to navigate the markets. Join the community of traders who have elevated their analysis—and be ready to receive countless thanks as you transform your trading strategy!

Alligator Oscillator | TramaAlligator Oscillator | Trama
The Alligator Oscillator | Trama (ATO | Trama) is a momentum-based trading indicator that utilizes Smoothed Moving Averages (SMMA) to measure market trends. Inspired by Bill Williams’ Alligator Indicator, it focuses on the relationship between the Jaw and Lips moving averages, calculating their percentage difference to identify bullish and bearish conditions.
Key Features:
✔ Jaw & Lips SMMA Calculation: Measures the spread between two smoothed moving averages.
✔ Threshold-Based Trading Signals: Identifies trend shifts using customizable long/short thresholds.
✔ Optional Smoothing: Enhances signal reliability with SMA, EMA, HMA, or RMA.
✔ Dynamic Color Modes: Choose between "Cool," "Classic," and "Blue" for visual clarity.
How It Works:
SMMA Calculation:
The Jaw (Long SMMA) is a 15-period smoothed moving average.
The Lips (Short SMMA) is a 4-period smoothed moving average.
Percentage Difference Computation:
Calculates the percentage gap between Lips and Jaw for trend analysis.
Adjusts polarity to maintain consistency in signal direction.
Signal Interpretation:
-Bullish Signal (Cyan, Green, or Light Blue): When percentage difference crosses above the long threshold.
-Bearish Signal (Magenta, Red, or Dark Blue): When percentage difference falls below the short threshold.
-Optional Smoothing:Users can smooth the percentage difference using SMA, EMA, HMA, or RMA for enhanced clarity.
-Dynamic Color Coding:The indicator colors candles based on trend detection.
This indicator is ideal for traders who:
📈 Want a trend-following strategy with clear entry/exit signals.
🔍 Prefer filtered signals with optional smoothing to reduce noise.
⚡ Seek momentum confirmation in combination with other indicators (e.g., RSI, MACD).
Customization Options:
-Threshold Levels: Adjustable long and short levels for fine-tuning sensitivity.
-Smoothing Settings: Choose from SMA, EMA, HMA, RMA or disable smoothing.
-Color Modes: Adapt the visual style to match personal preferences.
Disclaimer:
This indicator is for educational and informational purposes only. It does not constitute financial advice. Always apply proper risk management when trading.

MONEYZEYAH | MAIN OVERLAYThis all-in-one trading tool maps out key market structures, dynamic price zones, and essential trading sessions – giving you the edge to navigate market movements with precision.
🔹 Key Features:
🗺️ Support & Resistance Zones – Automatically detects and highlights critical price areas where the market tends to react.
🎨 Chart Patterns:
Wedges and Flags – Visualize potential breakout patterns in real-time.
Market Structure Shifts:
⚡ CHoCH (Change of Character) – Identifies early signs of trend reversals.
📈 BOS (Break of Structure) – Confirms trend continuation or breakouts.
⚪ Session Overlay:
Highlights London Session First 3 hours with a clean white background, keeping you aligned with high-volatility periods.
🔺 Williams Fractals:
Marks swing highs and lows for easier trend and reversal identification.
🔴 🟢 Moving Averages – Tracks momentum with:
🟢 EMA 50 – Short-term trend direction.
🔴 EMA 200 – Long-term market bias.
🎯 Why Use This Indicator?
Comprehensive visualization of market structure and trading patterns.
Perfect for intraday and swing traders who rely on price action and session timing.
Streamlines technical analysis by integrating multiple essential tools into one powerful indicator.
