Trading Session Analyzer - Best Trading Hours📊 OVERALL DESIGN & PURPOSE
This indicator identifies optimal trading hours based on:
Market session overlaps (when multiple markets are open)
Volume and volatility conditions
Trend strength (ADX)
Range-bound vs trending market detection
Target Use Case: Intraday traders looking to trade during high-liquidity periods with clear directional moves.
Search in scripts for "墨尔本胜利vs墨尔本城"

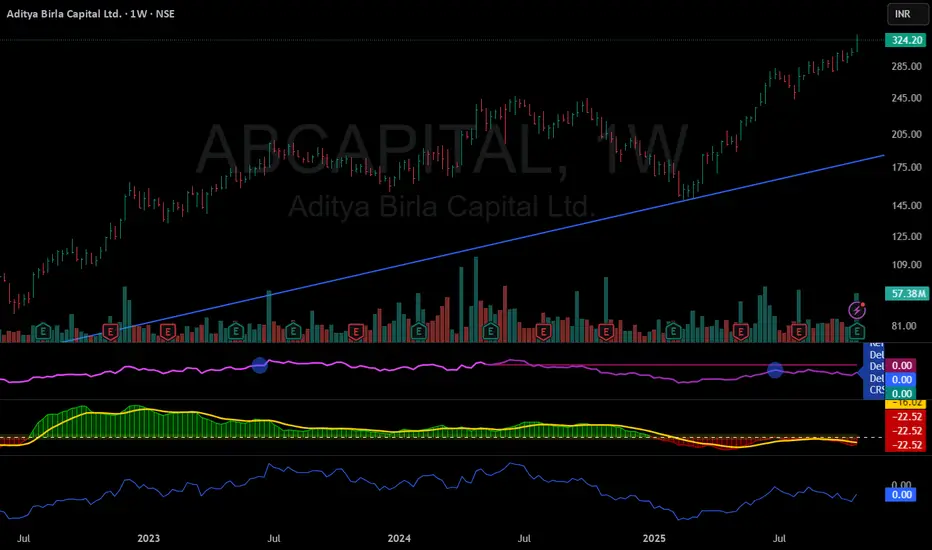
Relative Strength vs XAUIts a simple relative strength chart, right now i have set it with Gold, as it is outperforming most of indices globally.
Directional Volume Cloud MTFThe Directional Volume Cloud MTF transforms raw volume into a visually intuitive cloud histogram that highlights directional bias and exhaustion zones.
🔍 Core Logic
- Volume bias is calculated using candle direction (bullish/bearish) and smoothed via EMA.
- Bias strength is normalized against average volume to produce a ratio from -1 to +1.
- Color and opacity dynamically reflect bias direction and strength — pale clouds indicate weak volume, while vivid clouds signal strong conviction.
Features
- Customizable bullish/bearish colors
- Dynamic opacity based on volume strength
- Declining volume signals for potential reversals
- Multi-timeframe bias overlay (e.g., daily bias on intraday chart)
📈 Use Cases
- Spot volume exhaustion before reversals
- Confirm breakout strength with bias intensity
- Compare short-term vs long-term volume pressure
Whether you're scalping intraday moves or validating swing setups, this cloud-based volume heatmap offers a clean, modular way to visualize market conviction.

v2.0—Tristan's Multi-Indicator Reversal Strategy🎯 Multi-Indicator Reversal Strategy - Optimized for High Win Rates
A powerful confluence-based strategy that combines RSI, MACD, Williams %R, Bollinger Bands, and Volume analysis to identify high-probability reversal points . Designed to let winners run with no stop loss or take profit - positions close only when opposite signals occur.
Also, the 3 hour timeframe works VERY well—just a lot less trades.
📈 Proven Performance
This strategy has been backtested and optimized on multiple blue-chip stocks with 80-90%+ win rates on 1-hour timeframes from Aug 2025 through Oct 2025:
✅ V (Visa) - Payment processor
✅ MSFT (Microsoft) - Large-cap tech
✅ WMT (Walmart) - Retail leader
✅ IWM (Russell 2000 ETF) - Small-cap index
✅ NOW (ServiceNow) - Enterprise software
✅ WM (Waste Management) - Industrial services
These stocks tend to mean-revert at extremes, making them ideal candidates for this reversal-based approach. I only list these as a way to show you the performance of the script. These values and stock choices may change over time as the market shifts. Keep testing!
🔑 How to Use This Strategy Successfully
Step 1: Apply to Chart
Open your desired stock (V, MSFT, WMT, IWM, NOW, WM recommended)
Set timeframe to 1 Hour
Apply this strategy
Check that the Williams %R is set to -20 and -80, and "Flip All Signals" is OFF (can flip this for some stocks to perform better.)
Step 2: Understand the Signals
🟢 Green Triangle (BUY) Below Candle:
Multiple indicators (RSI, Williams %R, MACD, Bollinger Bands) show oversold conditions
Enter LONG position
Strategy will pyramid up to 10 entries if more buy signals occur
Hold until red triangle appears
🔴 Red Triangle (SELL) Above Candle:
Multiple indicators show overbought conditions
Enter SHORT position (or close existing long)
Strategy will pyramid up to 10 entries if more sell signals occur
Hold until green triangle appears
🟣 Purple Labels (EXIT):
Shows when positions close
Displays count if multiple entries were pyramided (e.g., "Exit Long x5")
Step 3: Let the Strategy Work
Key Success Principles:
✅ Be Patient - Signals don't occur every day, wait for quality setups
✅ Trust the Process - Don't manually close positions, let opposite signals exit
✅ Watch Pyramiding - The strategy can add up to 10 positions in the same direction
✅ No Stop Loss - Positions ride through drawdowns until reversal confirmed
✅ Session Filter - Only trades during NY session (9:30 AM - 4:00 PM ET)
⚙️ Winning Settings (Already Set as Defaults)
INDICATOR SETTINGS:
- RSI Length: 14
- RSI Overbought: 70
- RSI Oversold: 30
- MACD: 12, 26, 9 (standard)
- Williams %R Length: 14
- Williams %R Overbought: -20 ⭐ (check this! And adjust to your liking)
- Williams %R Oversold: -80 ⭐ (check this! And adjust to your liking)
- Bollinger Bands: 20, 2.0
- Volume MA: 20 periods
- Volume Multiplier: 1.5x
SIGNAL REQUIREMENTS:
- Min Indicators Aligned: 2
- Require Divergence: OFF
- Require Volume Spike: OFF
- Require Reversal Candle: OFF
- Flip All Signals: OFF ⭐
RISK MANAGEMENT:
- Use Stop Loss: OFF ⭐⭐⭐
- Use Take Profit: OFF ⭐⭐⭐
- Allow Pyramiding: ON ⭐⭐⭐
- Max Pyramid Entries: 10 ⭐⭐⭐
SESSION FILTER:
- Trade Only NY Session: ON
- NY Session: 9:30 AM - 4:00 PM ET
**⭐ = Critical settings for success**
## 🎓 Strategy Logic Explained
### **How It Works:**
1. **Multi-Indicator Confluence**: Waits for at least 2 out of 4 technical indicators to align before generating signals
2. **Oversold = Buy**: When RSI < 30, Williams %R < -80, price below lower Bollinger Band, and/or MACD turning bullish → BUY signal
3. **Overbought = Sell**: When RSI > 70, Williams %R > -20, price above upper Bollinger Band, and/or MACD turning bearish → SELL signal
4. **Pyramiding Power**: As trend continues and more signals fire in the same direction, adds up to 10 positions to maximize gains
5. **Exit Only on Reversal**: No arbitrary stops or targets - only exits when opposite signal confirms trend change
6. **Session Filter**: Only trades during liquid NY session hours to avoid overnight gaps and low-volume periods
### **Why No Stop Loss Works:**
Traditional reversal strategies fail because they:
- Get stopped out too early during normal volatility
- Miss the actual reversal that happens later
- Cut winners short with tight take profits
This strategy succeeds because it:
- ✅ Rides through temporary noise
- ✅ Captures full reversal moves
- ✅ Uses multiple indicators for confirmation
- ✅ Pyramids into winning positions
- ✅ Only exits when technical picture completely reverses
---
## 📊 Understanding the Display
**Live Indicator Counter (Top Corner / end of current candles):**
Bull: 2/4
Bear: 0/4
(STANDARD)
Shows how many indicators currently align bullish/bearish
"STANDARD" = normal reversal mode (buy oversold, sell overbought)
"FLIPPED" = momentum mode if you toggle that setting
Visual Indicators:
🔵 Blue background = NY session active (trading window)
🟡 Yellow candle tint = Volume spike detected
💎 Aqua diamond = Bullish divergence (price vs RSI)
💎 Fuchsia diamond = Bearish divergence
⚡ Advanced Tips
Optimizing for Different Stocks:
If Win Rate is Low (<50%):
Try toggling "Flip All Signals" to ON (switches to momentum mode)
Increase "Min Indicators Aligned" to 3 or 4
Turn ON "Require Divergence"
Test on different timeframe (4-hour or daily)
If Too Few Signals:
Decrease "Min Indicators Aligned" to 2
Turn OFF all requirement filters
Widen Williams %R bands to -15 and -85
If Too Many False Signals:
Increase "Min Indicators Aligned" to 3 or 4
Turn ON "Require Divergence"
Turn ON "Require Volume Spike"
Reduce Max Pyramid Entries to 5
Stock Selection Guidelines:
Best Suited For:
Large-cap stable stocks (V, MSFT, WMT)
ETFs (IWM, SPY, QQQ)
Stocks with clear support/resistance
Mean-reverting instruments
Avoid:
Ultra low-volume penny stocks
Extremely volatile crypto (try traditional settings first)
Stocks in strong one-directional trends lasting months
🔄 The "Flip All Signals" Feature
If backtesting shows poor results on a particular stock, try toggling "Flip All Signals" to ON:
STANDARD Mode (OFF):
Buy when oversold (reversal strategy)
Sell when overbought
May work best for: V, MSFT, WMT, IWM, NOW, WM
FLIPPED Mode (ON):
Buy when overbought (momentum strategy)
Sell when oversold
May work best for: Strong trending stocks, momentum plays, crypto
Test both modes on your stock to see which performs better!
📱 Alert Setup
Create alerts to notify you of signals:
📊 Performance Expectations
With optimized settings on recommended stocks:
Typical results we are looking for:
Win Rate: 70-90%
Average Winner: 3-5%
Average Loser: 1-3%
Signals Per Week: 1-3 on 1-hour timeframe
Hold Time: Several hours to days
Remember: Past performance doesn't guarantee future results. Always use proper risk management.

Money Volume • Buyers vs Sellers — @tgambinoxThis indicator estimates the total amount of money traded (Volume × Price)
and splits it between buyers and sellers based on each candle’s behavior.
It displays green bars for buyers and orange bars for sellers, allowing you to see
which side of the market is concentrating the capital.
Useful for detecting flow imbalances, buying/selling pressure,
and confirming price moves alongside total monetary volume (blue line).

Purchasing Power vs Gold, Stocks, Real Estate, BTC (1971 = 100)Visual comparison of U.S. dollar purchasing power versus major assets since 1971, when the U.S. ended the gold standard. Each asset is normalized to 100 in 1971, showing how real value has shifted across gold, real estate, stocks, and Bitcoin over time.
Source: FRED (CPIAUCSL, SP500, MSPUS) • OANDA (XAUUSD) • TradingView (INDEX:BTCUSD/BLX)
Visualization by 3xplain

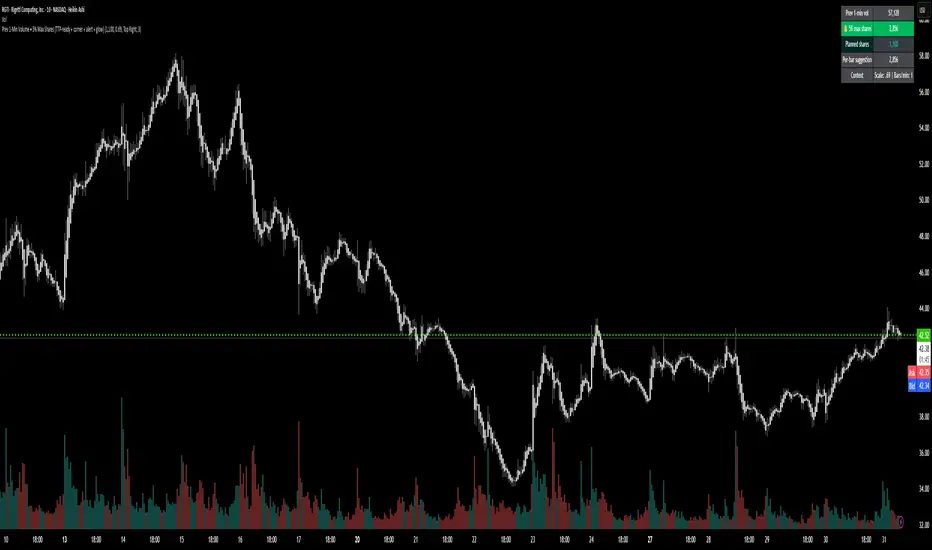
Prev 1-Min Volume • 5% Max Shares (TTP-ready)💡 Overview
This tool was built to help Trade The Pool (TTP) traders comply with the new “5% per minute volume” rule — without needing to calculate anything manually.
It automatically tracks the previous 1-minute volume, calculates 5% of it, and compares that to your planned order size.
If your planned size is within the limit, it shows green ✅.
If you’re above, it flashes red 🚫.
And when liquidity spikes allow for more size, you’ll see a green glow and 🔔 alert — so you can size up confidently without breaking the rule.
⚙️ Features
✅ Auto-calculates 5% volume cap from the previous 1-min candle
✅ Displays previous volume, max allowed shares, and your planned size
✅ TTP “different volume” scaling option (e.g. 0.69 for 45M vs 65M real volume)
✅ Per-bar slice suggestion for 10s scalpers
✅ Corner selector (top-left, top-right, bottom-left, bottom-right)
✅ Visual glow and 🔔 alert when liquidity window opens
✅ Compact and real-time responsive on 10s charts
mysourcetypesncsLibrary "mysourcetypes"
Libreria personale per sorgenti estese (Close, Open, High, Low, Median, Typical, Weighted, Average, Average Median Body, Trend Biased, Trend Biased Extreme, Volume Body, Momentum Biased, Volatility Adjusted, Body Dominance, Shadow Biased, Gap Aware, Rejection Biased, Range Position, Adaptive Trend, Pressure Balanced, Impulse Wave)
rclose()
Regular Close
Returns: Close price
ropen()
Regular Open
Returns: Open price
rhigh()
Regular High
Returns: High price
rlow()
Regular Low
Returns: Low price
rmedian()
Regular Median (HL2)
Returns: (High + Low) / 2
rtypical()
Regular Typical (HLC3)
Returns: (High + Low + Close) / 3
rweighted()
Regular Weighted (HLCC4)
Returns: (High + Low + Close + Close) / 4
raverage()
Regular Average (OHLC4)
Returns: (Open + High + Low + Close) / 4
ravemedbody()
Average Median Body
Returns: (Open + Close) / 2
rtrendb()
Trend Biased Regular
Returns: Trend-weighted price
rtrendbext()
Trend Biased Extreme
Returns: Extreme trend-weighted price
rvolbody()
Volume Weighted Body
Returns: Body midpoint weighted by volume intensity
rmomentum()
Momentum Biased
Returns: Price biased towards momentum direction
rvolatility()
Volatility Adjusted
Returns: Price adjusted by candle's volatility
rbodydominance()
Body Dominance
Returns: Emphasizes body over wicks
rshadowbias()
Shadow Biased
Returns: Price biased by shadow length
rgapaware()
Gap Aware
Returns: Considers gap between candles
rrejection()
Rejection Biased
Returns: Emphasizes price rejection levels
rrangeposition()
Range Position
Returns: Where close sits within the candle range (0-100%)
radaptivetrend()
Adaptive Trend
Returns: Adapts based on recent trend strength
rpressure()
Pressure Balanced
Returns: Balances buying/selling pressure within candle
rimpulse()
Impulse Wave
Returns: Detects impulsive moves vs corrections

MTF Multi EMA - IntradayMTF Multi EMA – Intraday
Purpose:
To quickly analyze trend direction and alignment across multiple timeframes (1m, 3m, 5m, 15m, 30m, and 60m) using fast and slow EMAs for each timeframe — and combine them into a simple “stack score” for easy visual decision-making. The script is tuned for Intraday Trading indicator by default.
Concept
Each timeframe (TF) — like 1m, 3m, 5m, etc. — has two EMAs:
A fast EMA (shorter length)
A slow EMA (longer length)
When the fast EMA > slow EMA, that timeframe is bullish.
When the fast EMA < slow EMA, that timeframe is bearish.
By combining multiple timeframes together, the indicator helps you:
Identify when all trends align bullishly (strong buy bias)
Identify when all trends align bearishly (strong sell bias)
Stay out during mixed or sideways phases
Inputs Explained
Setting Description
1m / 3m / 5m / 15m / 30m / 60m EMA Lengths Controls the EMA period for each timeframe’s fast and slow EMAs.
Fast EMA Color Color for all fast EMAs plotted on chart.
Slow EMA Color Color for all slow EMAs plotted on chart.
Use Smooth Interpolation Ensures smoother plots when merging higher TF data into a smaller chart (recommended ON).
Show Toggle visibility of each timeframe’s EMAs.
Table Position Lets you move the mini dashboard to any chart corner.
Stack Score
The Stack Score measures how many timeframes are bullish vs bearish:
Stack Score Meaning
+6 All timeframes bullish → Strong Uptrend
+3 to +5 Majority bullish → Bullish Bias
0 Neutral / Mixed → Sideways Market
−3 to −5 Majority bearish → Bearish Bias
−6 All timeframes bearish → Strong Downtrend
Table Display
At the chosen chart corner, you’ll see:
TF Direction
1m 🟢 B (Bullish) / 🔴 S (Bearish)
3m 🟢 B (Bullish) / 🔴 S (Bearish)
5m 🟢 B (Bullish) / 🔴 S (Bearish)
15m 🟢 B (Bullish) / 🔴 S (Bearish)
30m 🟢 B (Bullish) / 🔴 S (Bearish)
60m 🟢 B (Bullish) / 🔴 S (Bearish)
Score Final alignment score (color-coded)
Color meanings:
🟢 Green cell = bullish for that TF
🔴 Red cell = bearish for that TF
The Score cell background color changes with strength:
Bright green → strong bull
Yellow → neutral
Red / Maroon → strong bear
How to Use for Trading (Intraday NIFTY 5m)
Recommended Chart: 5-minute timeframe on NIFTY Futures or major index stocks.
🔹 1. Identify Trend Alignment
When Score ≥ +3 → Market bias is bullish.
→ Look for long entries (buy breakouts or EMA retests).
When Score ≤ −3 → Market bias is bearish.
→ Look for short entries (sell breakdowns or retests).
When Score is between −2 and +2 → Trend is mixed.
→ Best to wait — avoid trading in choppy conditions.
🔹 2. Combine with Price Action
Use it with:
Trendline breaks or retests
Candle confirmation (e.g. bullish engulfing or rejection)
Volume surge
Example:
On NIFTY 5m — if score = +5, price breaks above a descending trendline, and 1m–15m EMAs are all rising → strong long signal.
🔹 3. Avoid Conflicts
If lower timeframes (1m/3m/5m) are bullish but higher ones (30m/60m) are bearish,
→ Trend is short-term bullish but larger bias is down — scalps only, not swings.
Optional Alerts
If you add alert conditions (as suggested earlier):
“Strong Bullish Alignment” triggers when score ≥ +5
“Strong Bearish Alignment” triggers when score ≤ −5
This gives you early alerts when full trend alignment occurs — ideal for breakout setups.
Some more Tips
Use 5m or 15m chart as your main view.
Use Stack Score as a trend filter — trade with it, not against it.
Combine with Breakout + Retest strategy or Trendline color-coded system you’re building.
In sideways days (score near 0), reduce risk or skip trades.

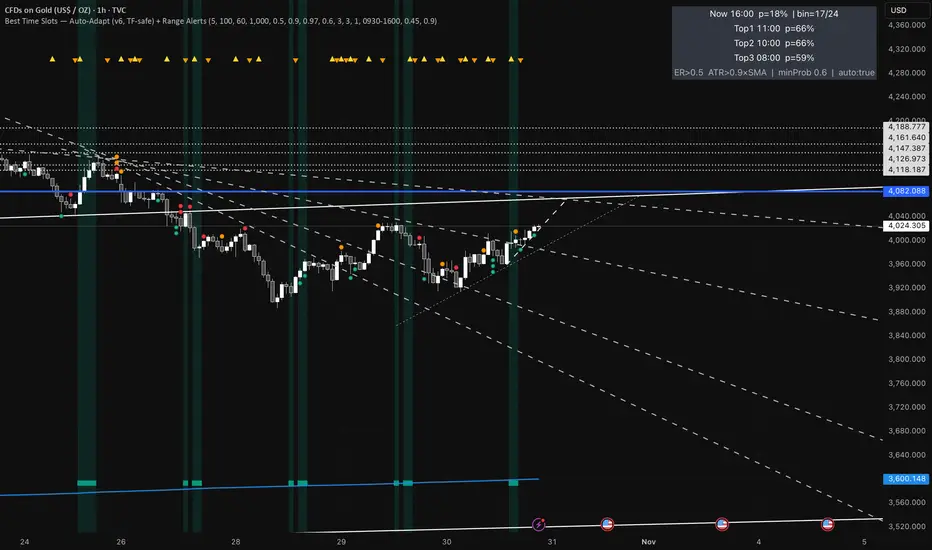
Best Time Slots — Auto-Adapt (v6, TF-safe) + Range AlertsTime & binning
Auto-adapt to timeframe
Makes all time windows scale to your chart’s bar size (so it “just works” on 1m, 15m, 4H, Daily).
• On = recommended. • Off = fixed default lengths.
Minimum Bin (minutes)
The size of each daily time slot we track (e.g., 5-min bins). The script uses the larger of this and your bar size.
• Higher = fewer, broader slots; smoother stats. • Lower = more, narrower slots; needs more history.
• Try: 5–15 on intraday, 60–240 on higher TFs.
Lookback windows (used when Auto-adapt = ON)
Target ER Window (minutes)
How far back we look to judge Efficiency Ratio (how “straight” the move was).
• Higher = stricter/smoother; fewer bars qualify as “movement”. • Lower = more sensitive.
• Try: 60–120 min intraday; 240–600 min for higher TFs.
Target ATR Window (minutes)
How far back we compute ATR (typical range).
• Higher = steadier ATR baseline. • Lower = reacts faster.
• Try: 30–120 min intraday; 240–600 min higher TFs.
Target Normalization Window (minutes)
How far back for the average ATR (the baseline we compare to).
• Higher = stricter “above average range” check. • Lower = easier to pass.
• Try: ~500–1500 min.
What counts as “movement”
ER Threshold (0–1)
Minimum efficiency a bar must have to count as movement.
• Higher = only very “clean, one-direction” bars count. • Lower = more bars count.
• Try: 0.55–0.65. (0.60 = balanced.)
ATR Floor vs SMA(ATR)
Requires range to be at least this many × average ATR.
• Higher (e.g., 1.2) = demand bigger-than-usual ranges. • Lower (e.g., 0.9) = allow smaller ranges.
• Try: 1.0 (above average).
How history is averaged
Recent Days Weight (per-day decay)
Gives more weight to recent days. Example: 0.97 ≈ each day old counts ~3% less.
• Higher (0.99) = slower fade (older days matter more). • Lower (0.95) = faster fade.
• Try: 0.97–0.99.
Laplace Prior Seen / Laplace Prior Hit
“Starter counts” so early stats aren’t crazy when you have little data.
• Higher priors = probabilities start closer to average; need more real data to move.
• Try: Seen=3, Hit=1 (defaults).
Min Samples (effective)
Don’t highlight a slot unless it has at least this many effective samples (after decay + priors).
• Higher = safer, but fewer highlights early.
• Try: 3–10.
When to highlight on the chart
Min Probability to Highlight
We shade/mark bars only if their slot’s historical movement probability is ≥ this.
• Higher = pickier, fewer highlights. • Lower = more highlights.
• Try: 0.45–0.60.
Show Markers on Good Bins
Draws a small square on bars that fall in a “good” slot (in addition to the soft background).
Limit to market hours (optional)
Restrict to Session + Session
Only learn/score inside this time window (e.g., “0930-1600”). Uses the chart/exchange timezone.
• Turn on if you only care about RTH.
Range (chop) alerts
Range START if ER ≤
Triggers range when efficiency drops below this level (price starts zig-zagging).
• Higher = easier to call “range”. • Lower = stricter.
Range START if ATR ≤ this × SMA(ATR)
Also triggers range when ATR shrinks below this fraction of its average (volatility contraction).
• Higher (e.g., 1.0) = stricter (must be at/under average). • Lower (e.g., 0.9) = easier to call range.
Alerts on bar close
If ON, alerts fire once per bar close (cleaner). If OFF, they can trigger intrabar (faster, noisier).
Quick “what happens if I change X?”
Want more highlighted times? ↓ Min Probability, ↓ ER Threshold, or ↓ ATR Floor (e.g., 0.9).
Want stricter highlights? ↑ Min Probability, ↑ ER Threshold, or ↑ ATR Floor (e.g., 1.2).
Want recent days to matter more? ↑ Recent Days Weight toward 0.99.
On 4H/Daily, widen Minimum Bin (e.g., 60–240) and maybe lower Min Probability a bit.
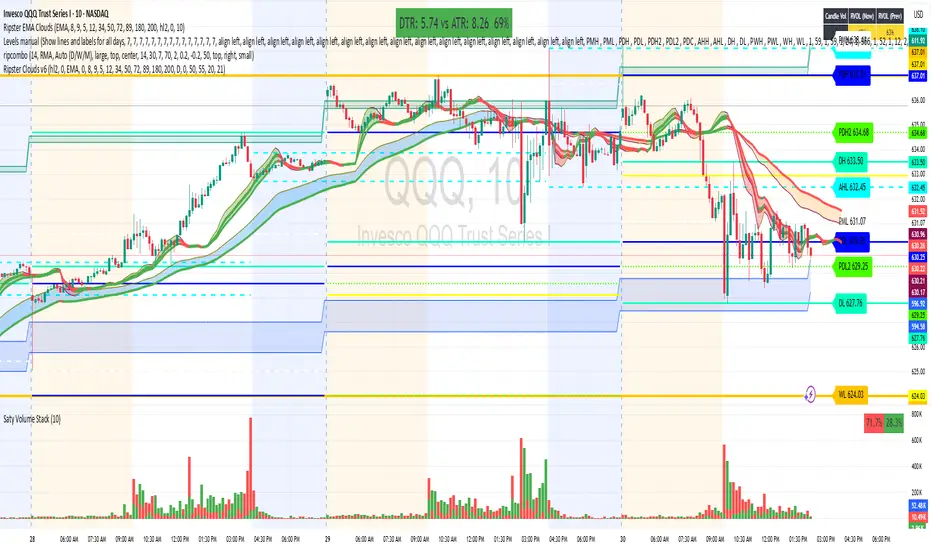
Ripster Clouds (EMA + MTF)v6🧠 Purpose
This indicator combines Ripster EMA Clouds and Multi-Timeframe (MTF) EMA Clouds into one script.
It allows you to visualize short vs long exponential (or simple) moving averages as colored “clouds” to identify trend direction and momentum — across both your current timeframe and a higher timeframe (e.g., daily).
⚙️ Main Features
1. EMA Clouds (Local Timeframe)
Up to 5 separate EMA/SMA cloud sets (8/9, 5/12, 34/50, 72/89, 180/200 by default).
Each can be individually enabled/disabled in the settings.
MA type toggle → Choose between EMA and SMA.
Optional line display toggle for showing the short and long MA lines.
Color-coded trend clouds:
Greenish tones = bullish (short > long)
Reddish tones = bearish (short < long)
Configurable leading offset and global offset for alignment.
2. MTF Clouds (Higher Timeframe)
Two sets of higher timeframe EMA clouds (default: 50/55 and 20/21).
Uses request.security() to pull EMA data from a selected higher timeframe (default = Daily).
Optional line visibility toggle (Display Lines).
Blue and teal semi-transparent fills to distinguish from local clouds.
Each MTF cloud can be toggled independently.
3. Unified Controls
Master toggles:
✅ Show EMA Clouds
✅ Show MTF Clouds
Transparent cloud fills with dynamically changing colors based on EMA crossovers and slope.
No local-scope plot() or fill() calls — fully compliant with Pine v6 rules.
🎨 Color Logic
Each EMA cloud uses a unique color pair (5 total).
Cloud color changes dynamically based on whether the short EMA is above or below the long EMA.
Line color changes with slope:
Olive = EMA rising
Maroon = EMA falling
📊 Technical Structure
Written in Pine Script v6.
All plot() and fill() calls are at global scope to prevent compilation errors.
Uses helper functions only for math/color logic.
Performance-optimized for TradingView’s rendering limits.
🧩 Quick Setup in TradingView
Paste the script into the Pine Editor.
Add to chart.
In settings:
Toggle on/off any EMA or MTF clouds.
Adjust timeframe (Resolution), line visibility, or offsets.
Choose EMA or SMA as the base calculation.
✅ Result
You now have one unified, customizable Ripster EMA + MTF Cloud indicator, stable in Pine v6, with complete flexibility to toggle, style, and analyze multiple timeframe trends on a single chart.
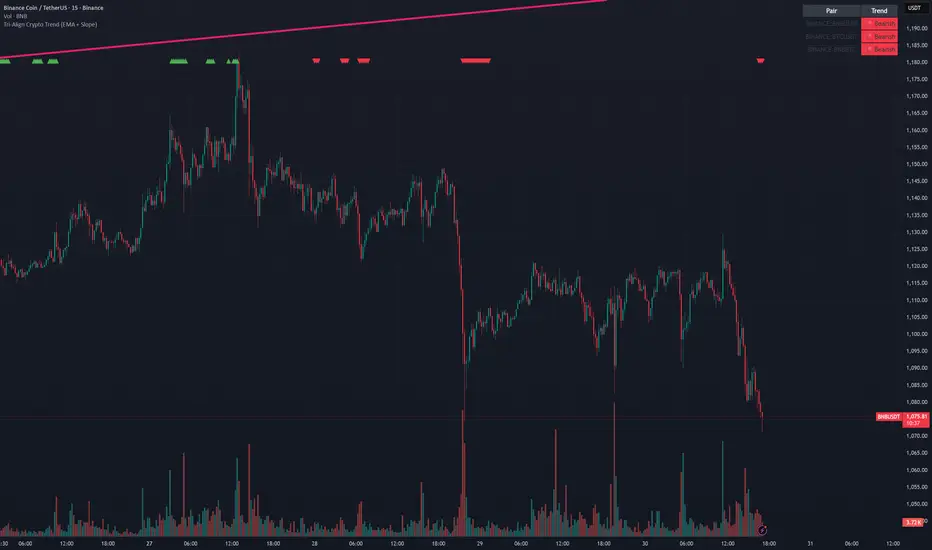
Tri-Align Crypto Trend (EMA + Slope)**Tri-Align Crypto Trend (EMA + Slope)**
Quickly see whether your coin is trending *with* Bitcoin. The indicator evaluates three pairs—**COIN/USDT**, **BTC/USDT**, and **COIN/BTC**—using a fast/slow EMA crossover plus the fast EMA’s slope. Each pair is tagged **Bullish / Bearish / Neutral** in a compact, color-coded table. Alerts fire when **all three** trends align (all bullish or all bearish).
**How to use**
1. Add the indicator to any crypto chart.
2. Set the three symbols (defaults: BNB/USDT, BTC/USDT, BNB/BTC) and optionally choose a signal timeframe.
3. Tune **Fast EMA**, **Slow EMA**, **Slope Lookback**, and **Min |Slope| %** to filter noise and require stronger momentum.
4. Create alerts: *Add alert →* choose the indicator and select **All Three Bullish**, **All Three Bearish**, or **All Three Aligned**.
**Logic**
* Bullish: `EMA_fast > EMA_slow` **and** fast EMA slope ≥ threshold
* Bearish: `EMA_fast < EMA_slow` **and** fast EMA slope ≤ −threshold
* Otherwise: Neutral
Tip: The **COIN/BTC** row reflects relative strength vs BTC—use it to avoid chasing coins that lag the benchmark. (For educational purposes; not financial advice.)
Percentile Rank Oscillator (Price + VWMA)A statistical oscillator designed to identify potential market turning points using percentile-based price analytics and volume-weighted confirmation.
What is PRO?
Percentile Rank Oscillator measures how extreme current price behavior is relative to its own recent history. It calculates a rolling percentile rank of price midpoints and VWMA deviation (volume-weighted price drift). When price reaches historically rare levels – high or low percentiles – it may signal exhaustion and potential reversal conditions.
How it works
Takes midpoint of each candle ((H+L)/2)
Ranks the current value vs previous N bars using rolling percentile rank
Maps percentile to a normalized oscillator scale (-1..+1 or 0–100)
Optionally evaluates VWMA deviation percentile for volume-confirmed signals
Highlights extreme conditions and confluence zones
Why percentile rank?
Median-based percentiles ignore outliers and read the market statistically – not by fixed thresholds. Instead of guessing “overbought/oversold” values, the indicator adapts to current volatility and structure.
Key features
Rolling percentile rank of price action
Optional VWMA-based percentile confirmation
Adaptive, noise-robust structure
User-selectable thresholds (default 95/5)
Confluence highlighting for price + VWMA extremes
Optional smoothing (RMA)
Visual extreme zone fills for rapid signal recognition
How to use
High percentile values –> statistically extreme upward deviation (potential top)
Low percentile values –> statistically extreme downward deviation (potential bottom)
Price + VWMA confluence strengthens reversal context
Best used as part of a broader trading framework (market structure, order flow, etc.)
Tip: Look for percentile spikes at key HTF levels, after extended moves, or where liquidity sweeps occur. Strong moves into rare percentile territory may precede mean reversion.
Suggested settings
Default length: 100 bars
Thresholds: 95 / 5
Smoothing: 1–3 (optional)
Important note
This tool does not predict direction or guarantee outcomes. It provides statistical context for price extremes to help traders frame probability and timing. Always combine with sound risk management and other tools.

FVG MagicFVG Magic — Fair Value Gaps with Smart Mitigation, Inversion & Auto-Clean-up
FVG Magic finds every tradable Fair Value Gap (FVG), shows who powered it, and then manages each gap intelligently as price interacts with it—so your chart stays actionable and clean.
Attribution
This tool is inspired by the idea popularized in “Volumatic Fair Value Gaps ” by BigBeluga (licensed CC BY-NC-SA 4.0). Credit to BigBeluga for advancing FVG visualization in the community.
Important: This is a from-scratch implementation—no code was copied from the original. I expanded the concept substantially with a different detection stack, a gap state machine (ACTIVE → 50% SQ → MITIGATED → INVERSED), auto-clean up rules, lookback/nearest-per-side pruning, zoom-proof volume meters, and timeframe auto-tuning for 15m/H1/H4.
What makes this version more accurate
Full-coverage detection (no “missed” gaps)
Default ICT-minimal rule (Bullish: low > high , Bearish: high < low ) catches all valid 3-candle FVGs.
Optional Strict filter (stricter structure checks) for traders who prefer only “clean” gaps.
Optional size percentile filter—off by default so nothing is hidden unless you choose to filter.
Correct handling of confirmations (wick vs close)
Mitigation Source is user-selectable: high/low (wick-based) or close (strict).
This avoids false “misses” when you expect wick confirmations (50% or full fill) but your logic required closes.
State-aware labelling to prevent misleading data
The Bull%/Bear% meter is shown only while a gap is ACTIVE.
As soon as a gap is 50% SQ, MITIGATED, or INVERSED, the meter is hidden and replaced with a clear tag—so you never read stale participation stats.
Robust zoom behaviour
The meter uses a fixed bar-width (not pixels), so it stays proportional and readable at any zoom level.
Deterministic lifecycle (no stale boxes)
Remove on 50% SQ (instant or delayed).
Inversion window after first entry: if price enters but doesn’t invert within N bars, the box auto-removes once fully filled.
Inversion clean up: after a confirmed flip, keep for N bars (context) then delete (or 0 = immediate).
Result: charts auto-maintain themselves and never “lie” about relevance.
Clarity near current price
Nearest-per-side (keep N closest bullish & bearish gaps by distance to the midpoint) focuses attention where it matters without altering detection accuracy.
Lookback (bars) ensures reproducible behaviour across accounts with different data history.
Timeframe-aware defaults
Sensible auto-tuning for 15m / H1 / H4 (right-extension length, meter width, inversion windows, clean up bars) to reduce setup friction and improve consistency.
What it does (under the hood)
Detects FVGs using ICT-minimal (default) or a stricter rule.
Samples volume from a 10× lower timeframe to split participation into Bull % / Bear % (sum = 100%).
Manages each gap through a state machine:
ACTIVE → 50% SQ (midline) → MITIGATED (full) → INVERSED (SR flip after fill).
Auto-clean up keeps only relevant levels, per your rules.
Dashboard (top-right) displays counts by side and the active state tags.
How to use it
First run (show everything)
Use Strict FVG Filter: OFF
Enable Size Filter (percentile): OFF
Mitigation Source: high/low (wick-based) or close (stricter), as you prefer.
Remove on 50% SQ: ON, Delay: 0
Read the context
While ACTIVE, use the Bull%/Bear% meter to gauge demand/supply behind the impulse that created the gap.
Confluence with your HTF structure, sessions, VWAP, OB/FVG, RSI/MACD, etc.
Trade interactions
50% SQ: often the highest-quality interaction; if removal is ON, the box clears = “job done.”
Full mitigation then rejection through the other side → tag changes to INVERSED (acts like SR). Keep for N bars, then auto-remove.
Keep the chart tidy (optional)
If too busy, enable Size Filter or set Nearest per side to 2–4.
Use Lookback (bars) to make behaviour consistent across symbols and histories.
Inputs (key ones)
Use Strict FVG Filter: OFF(default)/ON
Enable Size Filter (percentile): OFF(default)/ON + threshold
Mitigation Source: high/low or close
Remove on 50% SQ + Delay
Inversion window after entry (bars)
Remove inversed after (bars)
Lookback (bars), Nearest per side (N)
Right Extension Bars, Max FVGs, Meter width (bars)
Colours: Bullish, Bearish, Inversed fill
Suggested defaults (per TF)
15m: Extension 50, Max 12, Inversion window 8, Clean up 8, Meter width 20
H1: Extension 25, Max 10, Inversion window 6, Clean up 6, Meter width 15
H4: Extension 15, Max 8, Inversion window 5, Clean up 5, Meter width 10
Notes & edge cases
If a wick hits 50% or the far edge but state doesn’t change, you’re likely on close mode—switch to high/low for wick-based behaviour.
If a gap disappears, it likely met a clean up condition (50% removal, inversion window, inversion clean up, nearest-per-side, lookback, or max-cap).
Meters are hidden after ACTIVE to avoid stale percentages.

Rolling Correlation vs Another Symbol (SPY Default)This indicator visualizes the rolling correlation between the current chart symbol and another selected asset, helping traders understand how closely the two move together over time.
It calculates the Pearson correlation coefficient over a user-defined period (default 22 bars) and plots it as a color-coded line:
• Green line → positive correlation (move in the same direction)
• Red line → negative correlation (move in opposite directions)
• A gray dashed line marks the zero level (no correlation).
The background highlights periods of strong relationship:
• Light green when correlation > +0.7 (strong positive)
• Light red when correlation < –0.7 (strong negative)
Use this tool to quickly spot diversification opportunities, confirm hedges, or understand how assets interact during different market regimes.

Buying/Selling PressureBuying/Selling Pressure - Volume-Based Market Sentiment
Buying/Selling Pressure identifies market dominance by separating volume into buying and selling components. The indicator uses Volume ATR normalization to create a universal pressure oscillator that works consistently across all markets and timeframes.
What is Buying/Selling Pressure?
This indicator answers a fundamental question: Are buyers or sellers in control? By analyzing how volume distributes within each bar, it calculates cumulative buying and selling pressure, then normalizes the result using Volume ATR for cross-market comparability.
Formula: × 100
Where Delta = Buying Volume - Selling Volume
Calculation Methods
Money Flow (Recommended):
Volume weighted by close position in bar range. Close near high = buying pressure, close near low = selling pressure.
Formula: / (high - low)
Simple Delta:
Basic approach where bullish bars = 100% buying, bearish bars = 100% selling.
Weighted Delta:
Volume weighted by body size relative to total range, focusing on candle strength.
Key Features
Volume ATR Normalization: Adapts to volume volatility for consistent readings across assets
Cumulative Delta: Tracks net buying/selling pressure over time (similar to OBV)
Signal Line: EMA smoothing for trend identification and crossover signals
Zero Line: Clear visual separation between buyer and seller dominance
Color-Coded Display: Green area = buyers control, red area = sellers control
Interpretation
Above Zero: Buyers dominating - cumulative buying pressure exceeds selling
Below Zero: Sellers dominating - cumulative selling pressure exceeds buying
Cross Signal Line: Momentum shift - pressure trend changing direction
Increasing Magnitude: Strengthening pressure in current direction
Decreasing Magnitude: Weakening pressure, potential reversal
Volume vs Pressure
High volume with low pressure indicates balanced battle between buyers and sellers. High pressure with high volume confirms strong directional conviction. This separation provides insights beyond traditional volume analysis.
Best Practices
Use with price action for confirmation
Divergences signal potential reversals (price makes new high/low but pressure doesn't)
Large volume with near-zero pressure = indecision, breakout preparation
Signal line crossovers provide momentum change signals
Extreme readings suggest potential exhaustion
Settings
Calculation Method: Choose Money Flow, Simple Delta, or Weighted Delta
EMA Length: Period for cumulative delta smoothing (default: 21)
Signal Line: Optional EMA of oscillator for crossover signals (default: 9)
Buying/Selling Pressure transforms volume analysis into actionable market sentiment, revealing whether buyers or sellers control price action beneath surface volatility.
This indicator is designed for educational and analytical purposes. Past performance does not guarantee future results. Always conduct thorough research and consider consulting with financial professionals before making investment decisions.


🔥 QUANT MOMENTUM SKORQUANT MOMENTUM SCORE – Description (EN)
Summary: This indicator fuses Price ROC, RSI, MACD, Trend Strength (ADX+EMA) and Volume into a single 0-100 “Momentum Score.” Guide bands (50/60/70/80) and ready-to-use alert conditions are included.
How it works
Price Momentum (ROC): Rate of change normalized to 0-100.
RSI Momentum: RSI treated as a momentum proxy and mapped to 0-100.
MACD Momentum: MACD histogram normalized to capture acceleration.
Trend Strength: ADX is direction-aware (DI+ vs DI–) and blended with EMA state (above/below) to form a combined trend score.
Volume Momentum: Volume relative to its moving average (ratio-based).
Weighting: All five components are weighted, auto-normalized, and summed into the final 0-100 score.
Visuals & Alerts: Score line with 50/60/70/80 guides; threshold-cross alerts for High/Strong/Ultra-Strong regimes.
Inputs, weights and thresholds are configurable; total weights are normalized automatically.
How to use
Timeframes: Works on any timeframe—lower TFs react faster; higher TFs reduce noise.
Reading the score:
<50: Weak momentum
50-60: Transition
60-70: Moderate-Strong (potential acceleration)
≥70: Strong, ≥80: Ultra Strong
Practical tip: Use it as a filter, not a stand-alone signal. Combine score breakouts with market structure/trend context (e.g., pullback-then-re-acceleration) to improve selectivity.
Disclaimer: This is not financial advice; past performance does not guarantee future results.

5x Relative Volume vs 30-Day AverageRelative Volume.
If today's volume is more than average of last 30 days volume by 5x.

Up vs Down Volume Compared to PriceHi team,
I’ve put together a simple TradingView indicator that breaks down the last N candles into up-moves and down-moves, showing how much volume supported each side. It helps you quickly see whether the market is rallying on strong participation or just drifting higher on weak volume.
The tool tracks total up-volume versus down-volume, compares their ratios, and flags when pullbacks are happening with noticeably lower volume than the prior push up — a setup that often signals a healthy continuation rather than a reversal.
It also shows key metrics like total volume, price change, and up/down ratios directly on the chart for quick assessment. You’ll instantly know if you’re looking at a light-volume pullback or a heavy-volume sell-off.
Let’s test it out across a few symbols and discuss any tweaks we’d like — maybe layering an EMA or VWAP filter for cleaner trend confirmation.
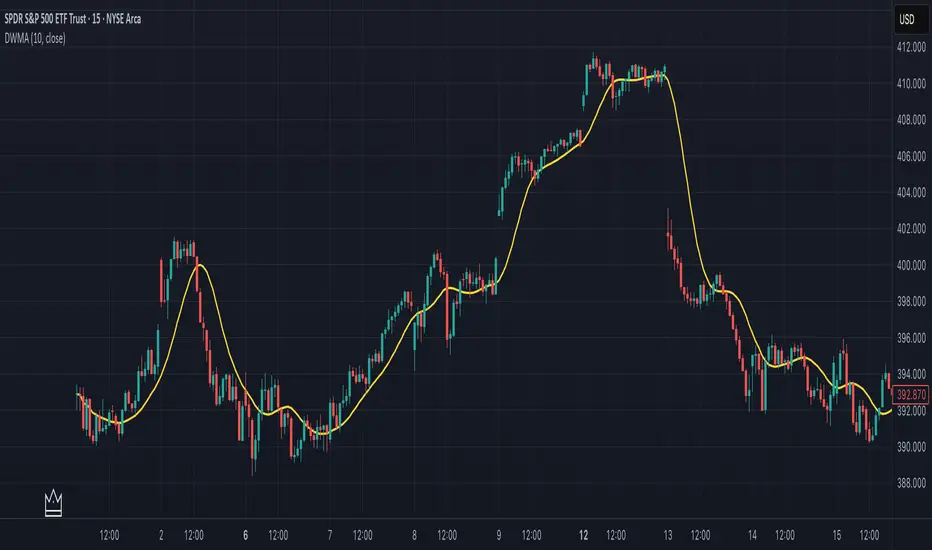
Double Weighted Moving Average (DWMA)# DWMA: Double Weighted Moving Average
## Overview and Purpose
The Double Weighted Moving Average (DWMA) is a technical indicator that applies weighted averaging twice in sequence to create a smoother signal with enhanced noise reduction. Developed in the late 1990s as an evolution of traditional weighted moving averages, the DWMA was created by quantitative analysts seeking enhanced smoothing without the excessive lag typically associated with longer period averages. By applying a weighted moving average calculation to the results of an initial weighted moving average, DWMA achieves more effective filtering while preserving important trend characteristics.
## Core Concepts
* **Cascaded filtering:** DWMA applies weighted averaging twice in sequence for enhanced smoothing and superior noise reduction
* **Linear weighting:** Uses progressively increasing weights for more recent data in both calculation passes
* **Market application:** Particularly effective for trend following strategies where noise reduction is prioritized over rapid signal response
* **Timeframe flexibility:** Works across multiple timeframes but particularly valuable on daily and weekly charts for identifying significant trends
The core innovation of DWMA is its two-stage approach that creates more effective noise filtering while minimizing the additional lag typically associated with longer-period or higher-order filters. This sequential processing creates a more refined output that balances noise reduction and signal preservation better than simply increasing the length of a standard weighted moving average.
## Common Settings and Parameters
| Parameter | Default | Function | When to Adjust |
|-----------|---------|----------|---------------|
| Length | 14 | Controls the lookback period for both WMA calculations | Increase for smoother signals in volatile markets, decrease for more responsiveness |
| Source | close | Price data used for calculation | Consider using hlc3 for a more balanced price representation |
**Pro Tip:** For trend following, use a length of 10-14 with DWMA instead of a single WMA with double the period - this provides better smoothing with less lag than simply increasing the period of a standard WMA.
## Calculation and Mathematical Foundation
**Simplified explanation:**
DWMA first calculates a weighted moving average where recent prices have more importance than older prices. Then, it applies the same weighted calculation again to the results of the first calculation, creating a smoother line that reduces market noise more effectively.
**Technical formula:**
```
DWMA is calculated by applying WMA twice:
1. First WMA calculation:
WMA₁ = (P₁ × w₁ + P₂ × w₂ + ... + Pₙ × wₙ) / (w₁ + w₂ + ... + wₙ)
2. Second WMA calculation applied to WMA₁:
DWMA = (WMA₁₁ × w₁ + WMA₁₂ × w₂ + ... + WMA₁ₙ × wₙ) / (w₁ + w₂ + ... + wₙ)
```
Where:
- Linear weights: most recent value has weight = n, second most recent has weight = n-1, etc.
- n is the period length
- Sum of weights = n(n+1)/2
**O(1) Optimization - Inline Dual WMA Architecture:**
This implementation uses an advanced O(1) algorithm with two complete inline WMA calculations. Each WMA uses the dual running sums technique:
1. **First WMA (source → wma1)**:
- Maintains buffer1, sum1, weighted_sum1
- Recurrence: `W₁_new = W₁_old - S₁_old + (n × P_new)`
- Cached denominator norm1 after warmup
2. **Second WMA (wma1 → dwma)**:
- Maintains buffer2, sum2, weighted_sum2
- Recurrence: `W₂_new = W₂_old - S₂_old + (n × WMA₁_new)`
- Cached denominator norm2 after warmup
**Implementation details:**
- Both WMAs fully integrated inline (no helper functions)
- Each maintains independent state: buffers, sums, counters, norms
- Both warm up independently from bar 1
- Performance: ~16 operations per bar regardless of period (vs ~10,000 for naive O(n²) implementation)
**Why inline architecture:**
Unlike helper functions, the inline approach makes all state variables and calculations visible in a single scope, eliminating function call overhead and making the dual-pass nature explicit. This is ideal for educational purposes and when debugging complex cascaded filters.
> 🔍 **Technical Note:** The dual-pass O(1) approach creates a filter that effectively increases smoothing without the quadratic increase in computational cost. Original O(n²) implementations required ~10,000 operations for period=100; this optimized version requires only ~16 operations, achieving a 625x speedup while maintaining exact mathematical equivalence.
## Interpretation Details
DWMA can be used in various trading strategies:
* **Trend identification:** The direction of DWMA indicates the prevailing trend
* **Signal generation:** Crossovers between price and DWMA generate trade signals, though they occur later than with single WMA
* **Support/resistance levels:** DWMA can act as dynamic support during uptrends and resistance during downtrends
* **Trend strength assessment:** Distance between price and DWMA can indicate trend strength
* **Noise filtering:** Using DWMA to filter noisy price data before applying other indicators
## Limitations and Considerations
* **Market conditions:** Less effective in choppy, sideways markets where its lag becomes a disadvantage
* **Lag factor:** More lag than single WMA due to double calculation process
* **Initialization requirement:** Requires more data points for full calculation, showing more NA values at chart start
* **Short-term trading:** May miss short-term trading opportunities due to increased smoothing
* **Complementary tools:** Best used with momentum oscillators or volume indicators for confirmation
## References
* Jurik, M. "Double Weighted Moving Averages: Theory and Applications in Algorithmic Trading Systems", Jurik Research Papers, 2004
* Ehlers, J.F. "Cycle Analytics for Traders," Wiley, 2013