Multi Timeframe Bollinger BandsMulti Timeframe Bollinger Bands:
This script calculates and displays the Bollinger Bands for three different timeframes. The timeframes, moving averages and sigma values can be adjusted to personal likings. I publish this with an open visibility, feel free to tinker with it or suggest improvements.
Enjoy,
s0ullight
Search in scripts for "弘历投教boll指标代码分析"

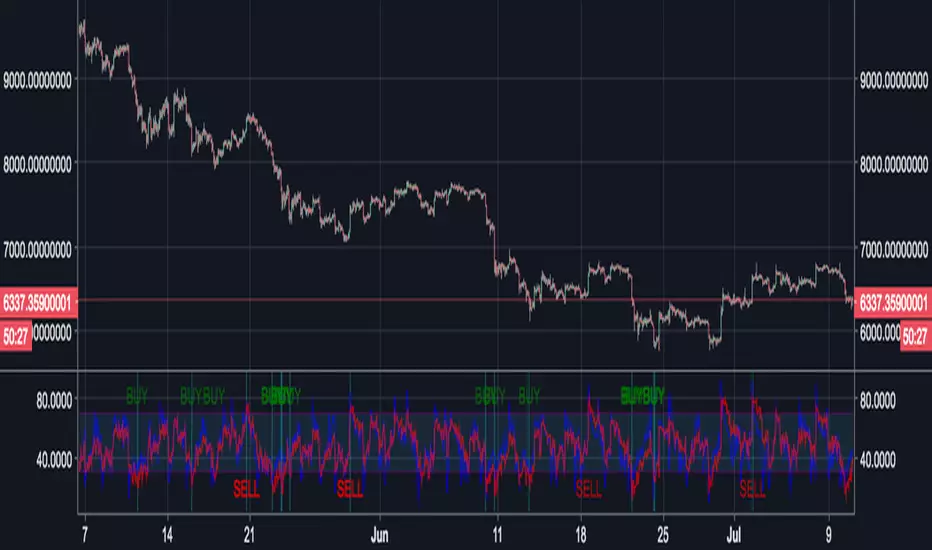
Bollinger Bands %bb (normalised) & RSIIndicator for displaying both Bollinger Bands %bb (normalised) and RSI simultaneously (Usual 0 - 1 range of BB normalised to the 30 - 70 range of RSI).
When both Bollinger Bands %bb and RSI are OB/OS then the column will turn blue and a buy/sell arrow will appear in the indicator provided other conditions pertaining to the OB/OS condition in one of the last two candles are also met.
I use this mainly for Cryptocurrencies for shorter time periods to indicate possible trade opportunities.
You could also set an alert on the arrow indicator appearing to auto trade.
[f(x)] Bollinger Donchian RemixThis is my version of a mixture of Bollinger and Donchian (BB/DC Remix)
It is a modified fork of Dolchian/Bollinger Hybrid by Ricardo Santos ( DBH.V0)
this is the two pictures comparing it.
Made this Fork because Santos' code starts getting chopping with my type of settings.
His time input is 24, but mine varies between 13 and 21.
You really notice in scalping and sometimes intraday timeframes with my settings.
His also differ from mine based on the trendline, where he modifies his Simple Moving Average, which is default color is black, and I use the the default one, which the default color is red.
Also you can change the trendline type input (open,close,hl2,etc...) to tailor your preference.
Note: Default is close, Santos use hl2, I use ohlc4.

RSI Bollinger BandsThis RSI indicator has a Bollinger Bands indicator around it, and a simple moving average.
I still haven't decided yet if the Bollinger Bands should be at 20 (like normal) or at 14 (like the RSI).
Experiment with it and have fun :)

4EMA (8,13,21,55) + Bollinger BandsFive indicators in one.
4 Moving Average Exponential : 8, 13, 21, 55 - as per @Philakone strategy
Bollinger Bands
Check out my other scripts for RSI and Stoch RSI all in one, and 4EMA + Death Cross + Bollinger Bands.

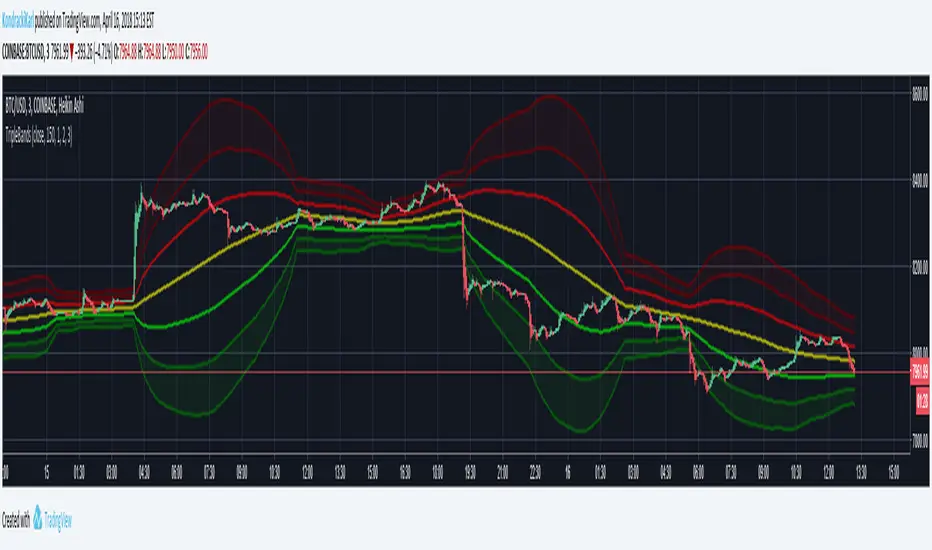
Triple Bollinger BandsTriple Bollinger Bands by Karl Kondracki
Hopefully this script can be of use.
Personally I really enjoy the reliability of Bollinger Bands set to a longer moving average.
Adding two extra deviation settings on the set of bands with the longer ma setting helps to easily show trends.
I tried to make the set as easy to see without drawing attention from other information.
The settings are intended to be as adjustable as possible while keeping things basic.
Hull Moving Average + Bollinger BandsThis study make use of Hull Moving Average and Bollinger Bands.
The crosses give signal about HMA and BB crossovers, they are a bit lagging, if you stare well you will spot them a little earlier. It look like a good idea to buy and sell when HMA is near or on the outside of the outer bands.
By default the Bollinger Bands uses Simple Moving Average with 21 periodes, and Hull Moving Average use 9 periodes. You can alter the settings in the format dialog.
Please use as pleased, and if you do something clever with it I'll be happy to know :D

Bollinger Bands Width with AlertsStandard Bollinger Band Width indicator with some convenience alerts -- please only use these alerts in conjunction with the alert-type "Once per Bar Close" in order to avoid premature (false) signals!
Alerts provided:
- bbw has rounded (started to decrease after period of rising)
- bbw has started rising (after a period of falling)
Many thanks again to J. Bollinger for his indicators and efforts in education.

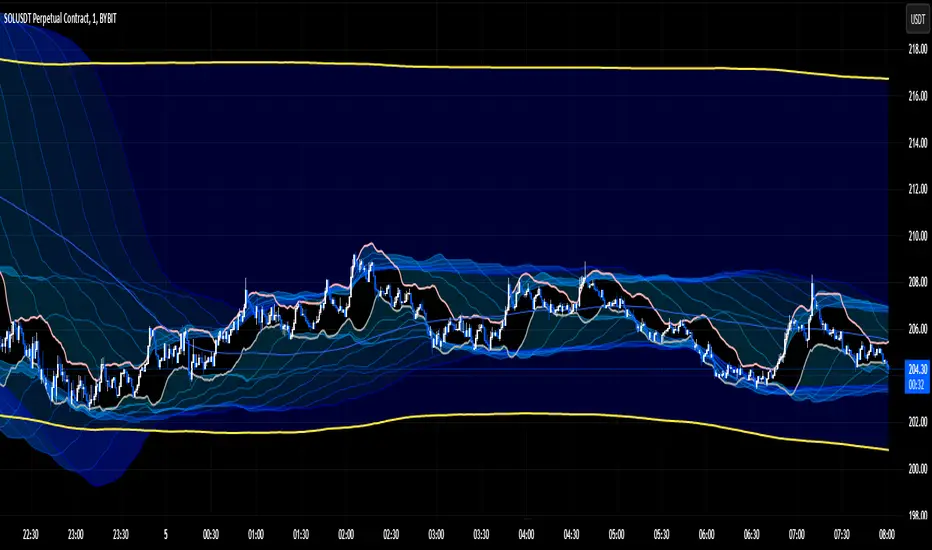
Bollinger Band ribbonThis indicator plots 9 upper and lower lines with increasing length. Lines are 0.618 upper and lower level of Bollinger band.
Exponential Bollinger Bands (EBB)This script is a variation of the popular Bollinger Bands indicator, which uses exponential moving averages (EMA) instead of simple moving averages (SMA) as its core calculation. The indicator is designed to provide a visual representation of volatility, with the distance between the upper and lower bands being determined by the standard deviation of the underlying data.
The script starts by defining a number of helper functions that are used to calculate the moving averages and standard deviations required for the indicator. The first helper function is sma(), which calculates the simple moving average of the input data over a specified length. This function uses linear interpolation to smooth the data when the length is not an integer. The stdev() function calculates the standard deviation of the input data using the simple moving average calculated by the sma() function.
The bes() function calculates the exponential moving average of the input data over a specified length. The estdev() function calculates the standard deviation of the input data using the exponential moving average calculated by the bes() function.
The estdev function calculates the standard deviation using an exponential moving average method, rather than the traditional simple moving average method used by the stdev function. The exponential moving average method gives more weight to recent data, which can make the estdev more responsive to recent changes in volatility. This can make it more useful in certain types of analysis, such as identifying trends in volatility. Additionally, it also uses the same EMA algorithm to calculate the average value of the data set, which can help to keep the output of the estdev and average functions consistent.
The script also defines two more helper functions, average() and standard_deviation(), which allow the user to switch between using simple moving averages (SMA) and exponential moving averages (EMA) as the basis for the indicator. These functions take three arguments, the input data, the length of the moving average, and a string that specifies whether to use SMA or EMA.
The script then defines the input parameters for the indicator. The user can choose whether to use SMA or EMA as the basis for the indicator using the select parameter. The user can also specify the length of the moving average and the multiplier for the standard deviation using the length and multiplier parameters, respectively.
Finally, the script calculates the average and standard deviation of the input data using the selected method (SMA or EMA), and plots the upper and lower bands of the indicator. The upper band is calculated as the average plus the standard deviation multiplied by the specified multiplier, while the lower band is calculated as the average minus the standard deviation multiplied by the specified multiplier.

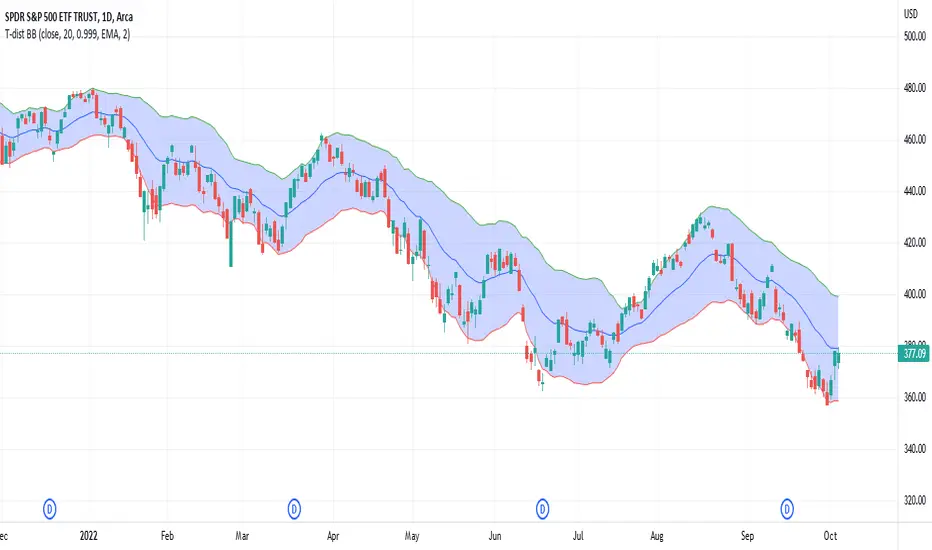
Student's T-Distribution Bollinger BandsThis study shows the prediction interval as Bollinger Bands using Student's T-distribution. This means that the bands will be wider when the data features higher variation, as well as when the sample size (in the form of length) is smaller. The bands will also be wider when the confidence level is lower. The opposite is also true. Assuming we set a confidence level of 0.99 and a source set to the close price, we could reasonably expect that 99% of the time the close price would fall between the upper and lower bounds. Because this is a general statistical method which requires a lot of math, the script has a tendency to be relatively slow, but should be eligible to be used in a wide variety of situations.
Bollinger Bands %B using HMAThe built-in Bollinger Band %b script modified to use the Hull Moving Average as the basis.
Hull Moving Averages have much less lag than a regular moving average.
Do not assume that regular BB interpretation rules apply to this.
This is an experimental indicator at this time.

Bollinger Bands with HMAThe built-in Bollinger Band script modified to use the Hull Moving Average as the basis.
Hull Moving Averages have much less lag than a regular moving average.
Do not assume that regular BB interpretation rules apply to this.
This is an experimental indicator at this time.
CRC.i Bollinger Bands ®This script is yet another variant of the famous Bollinger Bands® TA tool used to track price volatility as it deviates from the mean of a security using standard deviations (positive &negative). Built for my own personal preferences. But perhaps you might like it, too.
Includes
+ Chart Lines: price, upper and lower bands
+ User Options: SMA length, stdev value
+ Heads up Display (HUD) with TARGET's and other related stats
Bugs? Comments? Requests? Ping me @calmrat

Bollinger bands dynamic alertsThis triple Bollinger script is very useful for options traders to determine the trend condition. When the trend stays within 1 sigma limits it is termed as "congestion", breakout of congestion starts the "trending" phase and the big breakout termed "Blowout" happens when the underlying crosses the 2sigma and reaches 3 sigma limits in very short time at steep trend angles. The script provides dynamic alerts as soon as the underlying breaks out of these zones and enables options traders to stay in the trade longer. www.tradingview.com

Asian Session Bollinger BandsThis is a fairly simple adjustment of the Bollinger Bands highlighting and giving the character to the Asian session.

Improved Bollinger Swing Strategy Stock NasdaqThis is an improved bollinger band strategy adapted to Nasdaq Index/Stocks.
The new update include a multiple logic calculation BB adapted for long and short, together with a risk management using movement in %.
Rules for entry
For long we have a crossover between the close and the lower band from the bb
For long we have a crossover between the close and the upper band from the bb
Rules for exit
We exit when we either find a reverse condition, or if we hit the take profit/stop loss levels.
If you have any questions, let me know !

Bollinger Bands Touch MapThis simple script based on Bollinger Bands to collect Touch Point at bandsand display them on the map. Detail of rule as below:
1.Define Touch Point
1.1.Touch Point at Lower Band
+ Key bar:
- Open Price lower than BB lower band, Close Price higher than BB lower band
+ Touch Point:
- Median Price (HL2) of Key bar
1.2.Touch Point at Upper Band
+ Key bar:
- Open Price higher than BB upper band, Close Price lower than BB upper band
+ Touch Point:
- Median Price (HL2) of Key bar
1.3.Zero Point
- Close Price of Current bar
===================================
2.Touch Map
+ Last 5 Touch Point will be show on the map
+ Newest Touch point is numbered as (1) and show at the left of Zero Point
+ Each Point has a label show point's value
===================================
3.Fibonacci
+ Enable: Apply to number of Touch Points indicated
+ Style Up: 0 Level at the bottom
+ Style Down: 0 Level at the top
===================================
4.123 Pattern
+ Pattern: dot 2 and dot 3 at the Top and the Bottom of group 1234
+ M Pattern: dot 3 at the Top of group 135 and at the Bottom of group 234
+ W Pattern: dot 3 at the Bottom of group 135 and at the Top of group 234
===================================
5.Supply Demand Zone
5.1.Supply Zone
+ Supply Zone is area map structure change from upward to downward
+ Supply Zone is limited by 2 dots highest before upward structure broken
5.2.Demand Zone
+ Demand Zone is area map structure change from downward to upward
+ Demand Zone is limited by 2 dots lowest before downward structure broken
============================================================================
6.6.Over Block
6.1.Overbought Block
+ Overbought Block is location Long position covering
+ Ovb Block is limited by higest high and upper band at top of map
6.2.Oversold Block
+ Oversold Block is location Short position covering
+ Ovs Block is limited by lowest low and lower band at bottom of map
===================================
7.RSI Column
+ RSI Overbought is marked by Overbought color
+ RSI Oversold is marked by Oversold color
+ RSI Normal is marked by Normal color
+ Symbol ▲: RSI growing
+ Symbol ▼: RSI falling
===================================
8.Volume Direction
+ Volume growing is marked by Up Color
+ Volume falling is marked by Down Color
+ New Highest Volume on the map is marked by High Color and H Label
+ New Lowest Volume on the map is marked by Low Color and L Label
+ Volume higher than Median level is marked by Up Color and M Label
===================================
9.Useful features
+ Quickly find chart patter: 123, M, W...
+ Quickly find wave patter: I, V, N...
+ Quickly find Key level when moving between different Time Frame
+ Quickly recognize chart is trending or trendless
+ Quickly recognize divergence of Price and Volume
+ Quickly calculate Entry, Stoploss, Takeprofit by using Fibonacci

Bollinger Bands + ADX Strategy// This strategy uses Bollinger Bands to buy when the price
// crosses over the lower band and sell when it crosses down
// the upper band. It only takes trades when the ADX is
// below a certain level, and exits all trades when it's above it.

Best Bollinger BandsRemoving the Simple Moving Average and replacing it with the Hull Moving Average (HMA) in the Bollinger Bands (BB), you can not only predict support, resistance, and price movement, but you can also leverage the value of the BB in evaluating when price is over extended in an up and/or down trend.
EMA Ribbon Bollinger UltimateEma Ribbon and Bollinger Bands.
Background change color if the trend change or if it goes weak.

GSO + RSI + MACD + MFI + Bollinger BandsThis script uses a Gann Swing Oscillator , RSI , MACD , MFI and Bollinger Bands to generate long and short signals for cryptocurrencies on the 5 minute chart.
The Gann Swing Oscillator was inspired by HPotter's GSO.
This script is for educational purposes only. This script is NOT to be used as financial advice. I will not accept liability for any losses which may occur as a result of using this script.

Bollinger Bands + RSI Alerts for 3commas/DCA botHey Folks !
This is in indicator that generates buy alerts combining Bollinger Bands and RSI.
RSI validates the BB signal by confirming we are not in an oversold area.
Interval: 3m to 15m
Recommended settings for 3commas DCA bot
- TP/TTP: 0.3%/0.1%,
- Base Order: Your choice ,
- Safety Order: 1.2 * Your choice of base order
- Safety Order Volume Scale: 1.2,
- Safety Order Step Scale: 1.5,
- Price Deviation to Open Safety Order (% from initial order): 0.25%,
- Max Safety Trades Count: 7
- DO NOT USE STOP LOSS
> Create Alert with Buy Alert and link it to "Message for deal start signal"
