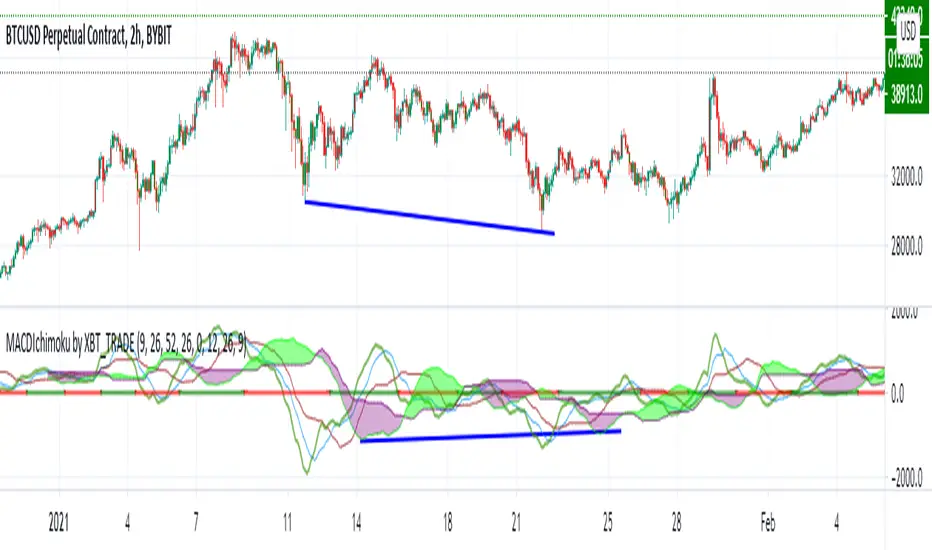
MACD Ichimoku By XBT_TRADE The Green Line is MACD , other are Tenkan and Kijun line from MACD line you can use this indicator and it help you to find komu divergence and price
Search in scripts for "手机同花顺macd指标超出框架"
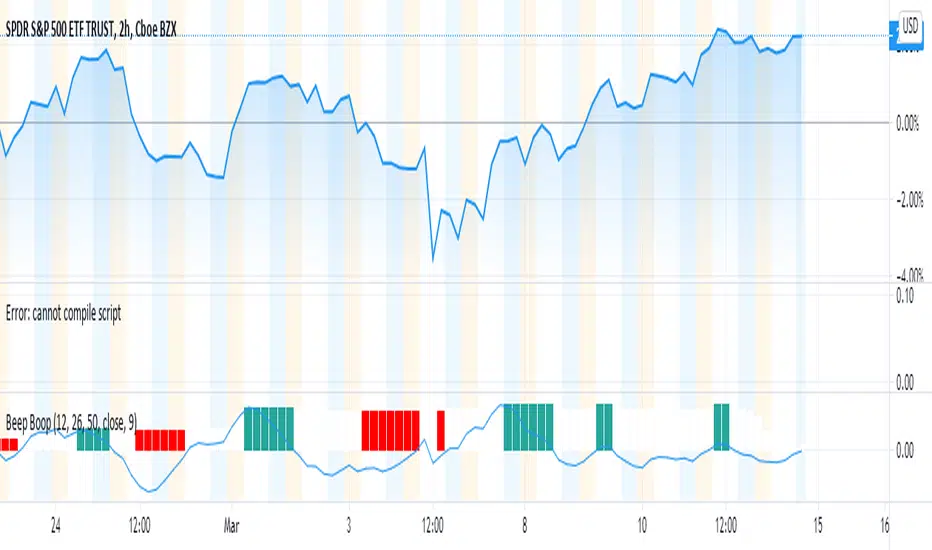
Beep Boop(Improved) Beep Boop Indicator for Trending Markets originally written by Trading Rush.
It is originally based on the MACD 12-26 and the 50 bar EMA.
The macd hist is color coded with green as buy and sell as red.
I added an option to use a couple of lower lag ema's (See line 13 - ema_signal).
Hull MACDMACD constructed using Hull MA and triangular MA.
HMA overshoots while TMA lags, producing an interesting MACD even when the two MAs have the same period.
Coloring shows tops, bots, and inflections.

Elder-Keltner-Impulse-MA Study by STTAStudy Name: Elder-Keltner-Impulse-MA Study by STTA
English:
This indicator shows in a combined way three Keltner Channels with EMA21 and multiplier 1,3,5, the Elder Impulse System and a short EMA 11 to recognize the valuation zone, according to various strategies of Dr. Alexander Elder.
This indicator can be applied on all symbols.
Inputs: displayed symbol
Settings:
Elder Force Index (EFI)
-EIF MACD Length
-EIF MACD Slow Length
-EIF MACD Signal Length
-EIF EMA Length
EMA Short Length
Keltner Channels (KC)
-KC MA Length
-KC Multiplier1-3
-KC Source
-KC Type
-KC Bands Style
Outputs:
-EIF Bar Colors
-KC Upper1-3 channel upper and lower Lines
-MA Short

MACD ProMoving average convergence divergence pro.
Original MACD with new features, Including...
1. Three different modes.
Basic, Logarithmic, Percent (calculates difference of oscillator MAs in percent)
2. Additional moving averages for oscillator, signal and even histogram.
EMA, WMA (linearly weighted), LMA (logarithmically weighted), SMA
Volume Weighted RMA (I've been suggested to make a MACD with the VWEMA that I published recently but that was too fast, this almost 2 times slower because of using RMA instead of EMA)
VWRMA(s) (an alternative for VWRMA which uses candle formation to simulate the volume, can be useful when volume is not provided for the symbol or it is not proper)
And DEMA (Double Exponential MA)
3. Signal Displacement.
If you want to add some delay to signal, could help for extra confirmation of center crosses and removal of some falss ones.
4. Histogram Smoother.
For those who like the smooth curves. Can deliver a cleaner histogram even in volatile markets.
5. Bar color for more fun.

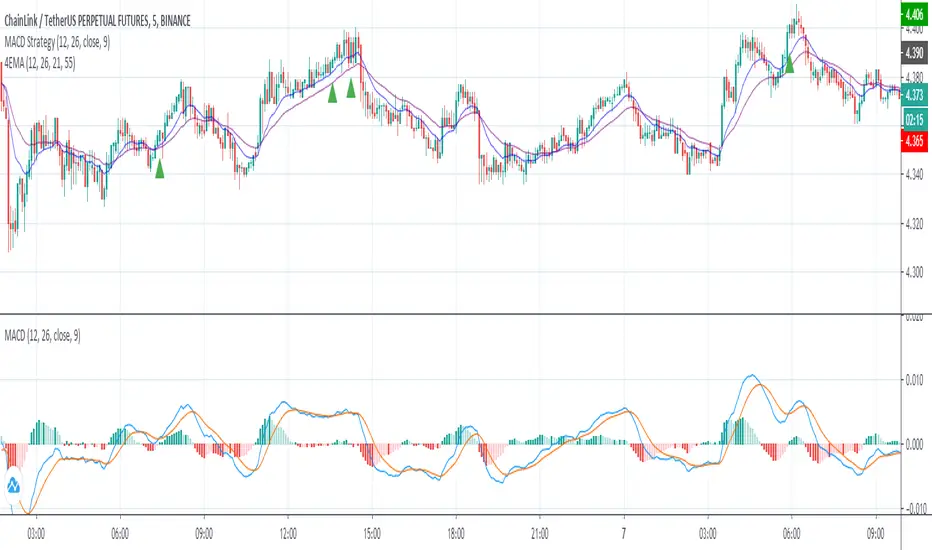
MACD StrategyThis script sends buy and sell signals as alerts to 3Commas (online software with trading bots in cryptocurreny)
It's based on 2 indicators:
- MACD
- 12 EMA and 26 EMA
When the 12 EMA and 26 EMA crossover, the MACD line crosses above 0. The goal here is to look for buy signals when the MACD and Signal are below 0, the histogram is positive, and there was or will be a 12 EMA and 26 EMA crossover.
I struggle with the following:
- There are multiple ways to use this as a crossover signal. I want to calculate the win rate of every posibility.
- What should be my take profit and my stoploss?
I think a 2:1 R/R,and a 60% win rate would make a great strategy! I could use some advice.
MACD Cross+MAStrategy MACD cross + Ma cross
การเข้าจะเข้าต่อเมื่อมีการ Cross ของ MACD ก่อน แล้วมีการ Cross ของเส้น ma 9,26 ตามมา
จากการ Backtest ของผมถือว่าเป้น Indicator ที่ค่อนข้างบอกให้เข้าช้าเลยทีเดียว แต่ใช้ Follow เทรนพอใช้ได้อยู่ครับ
แนะนำให้ใช้ในช่วงที่ตลาดเป็นขาขึ้นนะครับ ช่วงหมียาวอย่างปี 2018 Indicator ตั้วนี้ไม่เวิร์คอย่างแรงเลยครับ
ในภาพ backtest ตั้งแต่ปี 2019 - ปัจจุบันนะครับ
ใช้ใน TF Day จะเห็นผลดีที่สุด

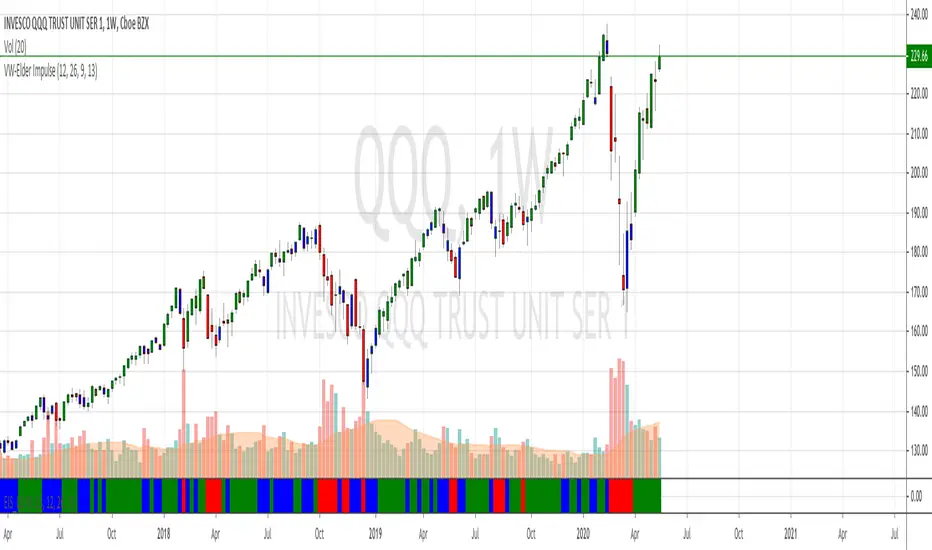
Volume-Weighted Elder Impulse SystemThis is a volume-weighted version of the Elder Impulse System. The Elder Impulse System utilizes the MACD along with EMA13(in general) to find the optimal entry and exit points. In this version, the MACD and EMA have both been changed into a Volume-weighted version. With volume involved, the indicator is, in general, faster than the original Elder Impulse system, in showing entry and exit points.
Macd CloudsDisplays a 4C Macd as a cloud ribbon to act as a chart overlay to quickly visually identify MACD trends.

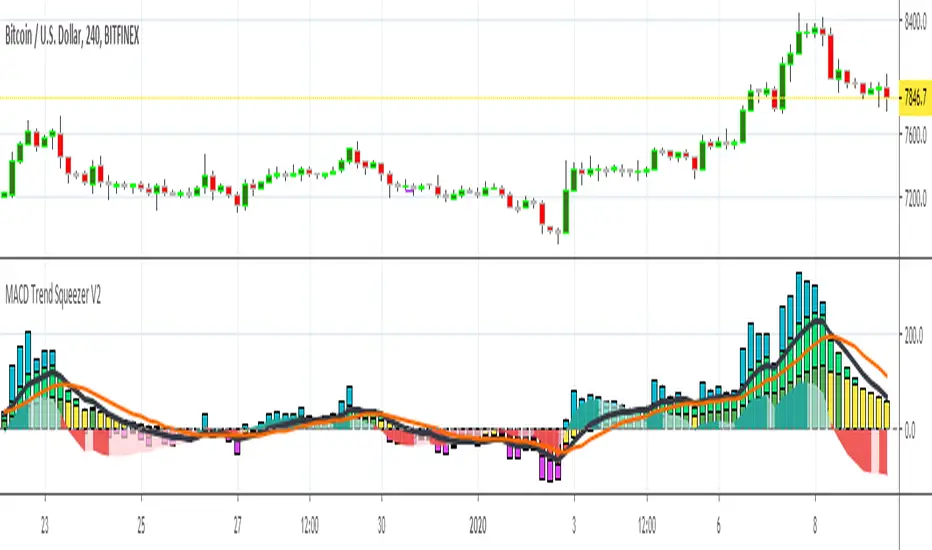
MACD Trend Squeezer V2This is a combination of a slightly sped up MACD overlay on top of a modified Bar Trend Squeeze or highly modified Momentum indicator. Helps to see the trend/momentum matched with the characteristics of the MACD and it's historiography. Very user friendly for adjusting color, transparency, depth, lines, size, etc.
MACD is the dark gray line.
Its signal slower line is orange.
Its historiography is the area fill blues and reds
Trend Squeezer / momentum are the Bars in the background.
// Changes from original version \\
Visual depth mostly. Most of the items are adjustable in the settings.
Increased user friendly inputs to adjust colors, lines, data, etc.
(darken / lighten and change background bar colors, increase/decrease line strengths and colors, adjust field data inputs)
MACD Zero lag impulse systemThis version of impulse uses the double exponential moving average instead of the typical ema.
The impulse system :
The Impulse System combines two simple but powerful indicators.
One measures market inertia, the other its momentum. When both
point in the same direction, they identify an impulse worth following.
We get an entry signal when both indicators get in gear.
The Impulse System uses an exponential moving average to find
uptrends and downtrends. When the EMA rises, it shows that inertia
favors the bulls. When EMA falls, inertia works for the bears. The sec-
ond component is MACD-Histogram, an oscillator whose slope reflects
changes of power among bulls or bears. When MACD-Histogram rises,
it shows that bulls are becoming stronger. When it falls, it shows that
bears are growing stronger.
The Impulse System flags those bars where both the inertia and the
momentum point in the same direction. When both the EMA and
MACD-Histogram rise, they show that bulls are roaring and the uptrend
is accelerating.

MACD + Stochastic + RSI StrategyMy strategy uses a combination of three indicators MACD Stochastic RSI.
The Idea is to buy when (MACD > Signal and RSI > 50 and Stochastic > 50) occures at the same time
This strategy works well on stocks and cryptos especially during market breaking up after consolidation
The best results are on Daily charts, so its NOT a scalping strategy. But it can work also on 1H charts.
The strategy does not have any stops and profit targets, so we can take all the market can give us at the moment.
The exit point only when MACD goes under Signal
Its Preformance is quite stable.
So, use it, trade it.
If it will help you to imprive your trading results, please donate me
BTC: 12kd1F8buWisUBdq27BBwRkUvzW7Ey3og5

Barssince Playground (Threshold & Persistence)Playground file for implementing MACD with threshold values while visualizing the persistence plot, which counts the amount of spent bars since the MACD delta crossed 0 value in either way.

Difusor de Fluxo [André Moraes] - Flow DiffuserPORTUGUÊS
Difusor de Fluxo de André Moraes. É um MACD com mais uma média de longo prazo. Explicação do próprio André Moraes em www.youtube.com
ENGLISH
Flow Diffuser created by André Moraes. It's a MACD with an extra long length average. The author's explanation can be viewed at www.youtube.com

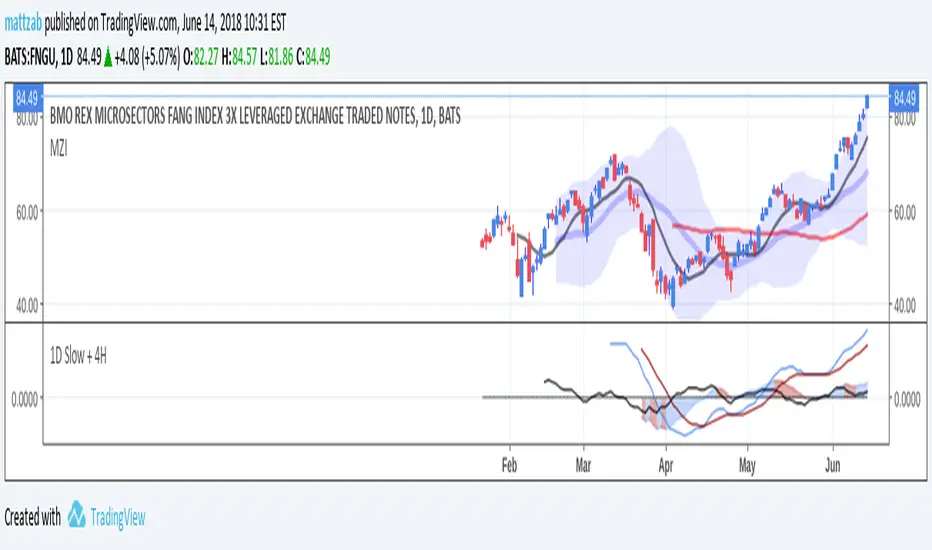
MACD 1D Slow + 4H by mattzab1D MACD, with slightly slower values for a little less noise.
Instead of the 12, 26, 9, this shows the 13, 34, 9.
Instead of showing a histogram, it uses area and color-codes the area blue and red based on directional movement.
Overlaid is a black histogram line showing the 4H MACD, produced by values of 6, 13, 5.
MACD+EMA crossovers Strategy customIt is a Strategy to use EMA crossover and MACD to decide when "buy" and when "sell", the key is spend some time "tuning" the parameters and using the simulation tool to find the best parameters for EMA and MACD there are 6 parameters, but with Excel and patience you could find the best configuration for the past and apply it to the future and see.

MACD Strategy custom for cryptosIt is a MACD with strategy simulation implemented to "tune" the MACD parameters for cryptos, it only use long and close strategy, not short
SB_CM_MacD_Ult_MTFThis strategy places the order based on the MACD signal.
Original Indicator: MacD Custom Indicator-Multiple Time Frame+All Available Options! by ChrisMoody
Link to the Indicator:
If your risk appetite is high you can replace the first statement with the below statement:
strategy(title="SB_CM_MacD_Ult_MTF", shorttitle="SB_CM_MacD_Ult_MTF", default_qty_type = strategy.percent_of_equity, default_qty_value = 100, pyramiding = 5)
You can check for repainting. Did not check for that.
Message if you think of any modifications/ enhancements/ any opportunities. :)
Donations/Tips... :) -
BTC: 1BjswGcRR6c23pka7qh5t5k56j46cuyyy2
ETH: 0x64fed71c9d6c931639c7ba4671aeb6b05e6b3781
LTC: LKT2ykQ8QSzzfTDB6Tnsf12xwYPjgq95h4

MACD MAthis indicator is to be able to predict the movement of the macd, to determine when the macd may overextend and also provides great support and resistance levels, it's made out of 2 exponential moving averages one being 12 and the other 26, just like the moving averages used by the determine the macd a cross of the lines may indicate buy or sell signals

Normalized Moving Average Convergence/DivergenceThis MACD normalizes the price so that it can be compared against moves that took place at prices of significant difference.
There are also options to change if the MACD and the signal line are computed using EMA or SMA.
MACD ColorsThis adds visual cue for when MACD histogram bars is decreasing when above the zero-line, and increasing when below the zero-line.
Based on:
Oscillator Moving Average (OsMA)This code for Oscillator of Moving Averages (OsMA) is based on MACD 4C indicator code published by vkno422 . Many thanks to vkno422. I have borrowed the concept of 4 colours which I find very useful.
For those who are not familiar with OsMA, it is histogram of difference between MACD (oscillator) and its MA (signal line). The zero line cross over of this indicator is used in many strategies.
This version includes MACD & its signal line together with OsMA histogram. I have programmed flexibility for switching OFF/ON individual indicator components as well as changing the periods for various moving averages.
I am dedicating this indicator to the TV trading community hoping that people will find it useful.
