RSI mura visionOverview
The Enhanced RSI with Custom 40/60 Zones is a Pine Script™ v6 open-source indicator that builds on the classic Relative Strength Index by adding two additional horizontal levels at 40 and 60, alongside the standard 30/70. These extra zones help you identify early momentum shifts and distinguish trending markets from ranging ones with greater precision.
Key Features & Originality
* Custom Mid-Zones (40/60): Standard RSI signals can be noisy around the 50 midpoint. By marking 40 as a “weak momentum” threshold and 60 as a “strong momentum” confirmation, you get clearer entry and exit cues.
* Color-Coded Zones: The RSI line changes color when crossing 40, 50, 60, 70, and 30, letting you visually spot momentum acceleration or deceleration.
* Configurable Alerts: Built-in alert conditions fire when RSI crosses 40 or 60 in either direction, so you never miss a potential trend onset or exhaustion.
* Lightweight & Clean: No external dependencies, no look-ahead bias, and minimal repainting—ideal for both novice and professional traders.
How It Works
1. Momentum Decomposition: The standard 14-period RSI measures overbought/oversold extremes. Adding 40/60 lets you see when momentum shifts from neutral to bullish (crossing above 60) or bearish (dropping below 40) earlier than the classic 70/30 thresholds.
2. Trend Confirmation vs. Pullbacks: Readings between 40–60 often correspond to healthy pullbacks within a trend. A bounce off 40 suggests continuation; a rejection at 60 warns of a deeper pullback or reversal.
Usage & Inputs
* RSI Length (default 14): Period for calculating RSI.
* Level Inputs: Customize levels for overbought (70), support (60), neutral (50), weak (40), and oversold (30).
* Alert Toggles: Enable/disable alerts on each cross.
Why This Adds Value
* Early Signals: Capture trend beginnings before the market reaches extreme overbought/oversold levels.
* Noise Reduction: Filter sideways chop by watching the 40–60 corridor.
* Flexibility: Works on any timeframe or ticker.
Pine Script™ Version: v6
Open-Source License: MPL-2.0
Feel free to fork, modify, and share.
Search in scripts for "科创50"

DECODE Moving Average ToolkitDECODE Moving Average Toolkit: Your All-in-One MA Analysis Powerhouse!
This versatile indicator is designed to be your go-to solution for analysing trends, identifying potential entry/exit points, and staying ahead of market movements using the power of Moving Averages (MAs).
Whether you're a seasoned trader or just starting out, the Decode MAT offers a comprehensive suite of features in a user-friendly package.
Key Features:
Multiple Moving Averages: Visualize up to 10 Moving Averages simultaneously on your chart.
Includes 5 Exponential Moving Averages (EMAs) and 5 Simple Moving Averages (SMAs).
Easily toggle the visibility of each MA and customize its length to suit your trading style and the asset you're analyzing.
Dynamic MA Ribbons: Gain a clearer perspective on trend direction and strength with 5 configurable MA Ribbons.
Each ribbon is formed between a corresponding EMA and SMA (e.g., EMA 20 / SMA 20).
The ribbon color changes to indicate bullish (e.g., green) or bearish (e.g., red) sentiment, providing an intuitive visual cue.
Toggle ribbon visibility with a single click.
Powerful Crossover Alerts: Never miss a potential trading opportunity with up to 5 customizable MA Crossover Alerts.
Define your own fast and slow MAs for each alert from any of the 10 available MAs.
Receive notifications directly through TradingView when your specified MAs cross over or cross under.
Optionally display visual symbols (e.g., triangles ▲▼) directly on your chart at the exact crossover points for quick identification.
Highly Customizable:
Adjust the source price (close, open, etc.) for all MA calculations.
Fine-tune the appearance (colors, line thickness) of every MA line, ribbon, and alert symbol to match your charting preferences.
User-Friendly Interface: All settings are neatly organized in the indicator's input menu, making configuration straightforward and intuitive.
How Can You Use the Decode MAT in Your Trading?
This toolkit is incredibly versatile and can be adapted to various trading strategies:
Trend Identification:
Use longer-term MAs (e.g., 50, 100, 200 period) to identify the prevailing market trend. When prices are consistently above these MAs, it suggests an uptrend, and vice-versa.
Observe the MA ribbons: A consistently green ribbon can indicate a strong uptrend, while a red ribbon can signal a downtrend. The widening or narrowing of the ribbon can also suggest changes in trend momentum.
Dynamic Support & Resistance:
Shorter-term MAs (e.g., 10, 20 period EMAs) can act as dynamic levels of support in an uptrend or resistance in a downtrend. Look for price pullbacks to these MAs as potential entry opportunities.
Crossover Signals (Entries & Exits):
Golden Cross / Death Cross: Configure alerts for classic crossover signals. For example, a 50-period MA crossing above a 200-period MA (Golden Cross) is often seen as a long-term bullish signal. Conversely, a 50-period MA crossing below a 200-period MA (Death Cross) can be a bearish signal.
Shorter-Term Signals: Use crossovers of shorter-term MAs (e.g., EMA 10 crossing EMA 20) for more frequent, shorter-term trading signals. A fast MA crossing above a slow MA can signal a buy, while a cross below can signal a sell.
Use the on-chart symbols for quick visual confirmation of these crossover events.
Confirmation Tool:
Combine the Decode MAT with other indicators (like RSI, MACD, or volume analysis) to confirm signals and increase the probability of successful trades. For instance, a bullish MA crossover combined with an oversold RSI reading could strengthen a buy signal.
Multi-Timeframe Analysis:
Apply the toolkit across different timeframes to get a broader market perspective. A long-term uptrend on the daily chart, confirmed by a short-term bullish crossover on the 1-hour chart, can provide a higher-confidence entry.
The DECODE Moving Average Toolkit empowers you to tailor your MA analysis precisely to your needs.

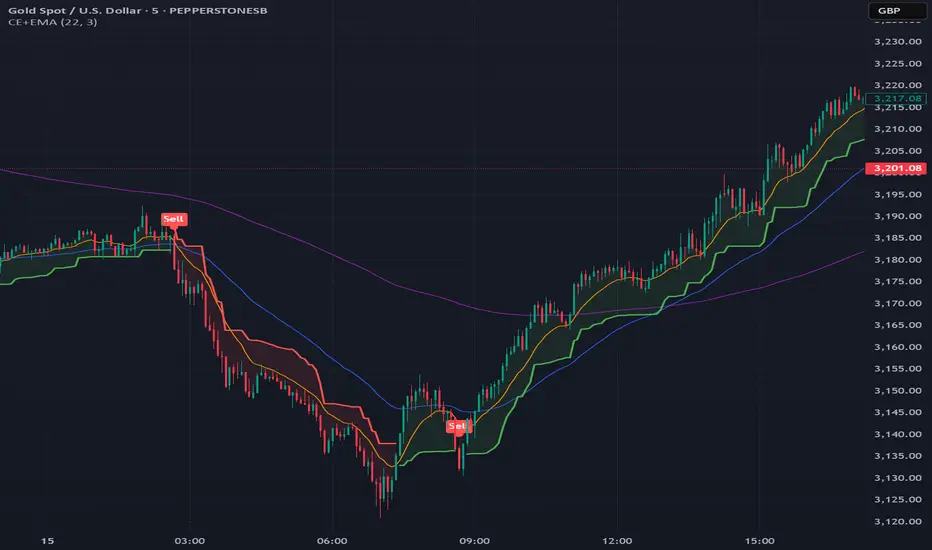
Chandelier Exit + EMA Filtered SignalsThis script is a powerful upgrade to the original Chandelier Exit by Alex Orekhov (everget), combining trend-following logic with higher-quality trade filtering.
✅ Key Features:
Chandelier Exit logic with ATR-based stop levels
Buy/Sell signals only when trend is confirmed:
Buy: Price must be above EMA 13, 50, and 200
Sell: Price must be below EMA 13, 50, and 200
Candle highlighting: Green for Buy, Red for Sell
Signal labels for visual clarity
Toggle to show/hide EMAs
Built-in alerts for:
Buy signal
Sell signal
Trend direction change
🛠️ Inputs:
ATR Period and Multiplier
Toggle: Use Close Price for High/Low Calculation
Toggle: Show/Hide Labels and State Highlight
Toggle: Show/Hide EMA 13, 50, 200
Toggle: Await confirmed bar for alerts
🔔 Alerts Included:
Chandelier Exit Buy
Chandelier Exit Sell
Direction Change (long to short or vice versa)
💡 How to Use:
Use on trending assets (e.g., Gold, Indices, Crypto).
Combine with support/resistance or session filters for optimal results.
Enable alerts to be notified on trade setups.
📢 Credits:
Based on the original Chandelier Exit script by everget.
Enhancements by AP Capital for filtered signals and better visual feedback.
MACD of RSI [TORYS]MACD of RSI — Momentum & Divergence Scanner
Description:
This enhanced oscillator applies MACD logic directly to the Relative Strength Index (RSI) rather than price, giving traders a clearer look at internal momentum and early shifts in trend strength. Now featuring a custom histogram, dual MA types, and RSI-based divergence detection — it’s a complete toolkit for identifying exhaustion, acceleration, and hidden reversal points in real time.
How It Works:
Calculates the MACD line as the difference between a fast and slow moving average of RSI. Adds a Signal Line (MA of the MACD) and plots a Histogram to show momentum acceleration/deceleration. Both RSI MAs and the Signal Line can be toggled between EMA and SMA for custom tuning.
Divergence Detection:
Bullish Divergence : Price makes a lower low while RSI makes a higher low → labeled with a green “D” below the curve.
Bearish Divergence : Price makes a higher high while RSI makes a lower high → labeled with a red “D” above the curve.
Configurable lookback window for tuning sensitivity to pivots, with 4 as the sweet spot.
RSI Pivot Dot Signals:
Plots green dots at RSI oversold pivot lows below 30,
Plots red dots at overbought pivot highs above 70.
Helps detect short-term exhaustion or bounce zones, plotted right on the MACD-RSI curve.
RSI 50 Crosses (Optional):
Optional ▲ and ▼ labels when RSI crosses its 50 midline — useful for momentum trend shifts or pullback confirmation, or to detect consolidation.
Histogram:
Plotted as a column chart showing the distance between MACD and Signal Line.
Colored dynamically:
Bright green : Momentum rising above zero
Light green : Weakening above zero
Bright red : Momentum falling below zero
Light red : Weakening below zero
The zero line serves as the mid-point:
Above = Bullish Bias
Below = Bearish Bias
How to Interpret:
Momentum Confirmation:
Use MACD cross above Signal Line with a rising histogram to confirm breakouts or trend entries.
Histogram shrinking near zero = momentum weakening → caution or reversal.
Exhaustion & Reversals:
Dot signals near RSI extremes + histogram peak can suggest overbought/oversold pressure.
Use divergence labels ("D") to spot early reversal signals before price breaks structure.
Inputs & Settings:
RSI Length
Fast/Slow MA Lengths for MACD (applied to RSI)
Signal Line Length
MA Type: Choose between EMA and SMA for MACD and Signal Line
Pivot Sensitivity for dot markers
Divergence Logic Toggle
Show/hide RSI 50 Crosses
Best For:
Traders who want momentum insight from inside RSI, not price
Scalpers using divergence or exhaustion entries
Swing traders seeking entry confirmation from signal crossovers
Anyone using multi-timeframe confluence with RSI and trend filters
Pro Tips:
Combine this with:
Bollinger Bands breakouts and reversals
VWAP or EMAs to filter entries by trend
Volume spikes or BBW squeezes for volatility confirmation
TTM Scalper Alert to sync structure and momentum

A.K Dynamic EMA/SMA / MTF S&R Zones Toolkit with AlertsThe A.K Dynamic EMA/SMA / MTF Support & Resistance Zones Toolkit is a powerful all-in-one technical analysis tool designed for traders who want a clean yet comprehensive market view. Whether you're scalping lower timeframes or swing trading higher timeframes, this indicator gives you both the structure and signals to take action with confidence.
Key Features:
✅ Customizable EMA/SMA Suite
Display key Exponential and Simple Moving Averages including 5, 9, 20, 50, 100, and 200 EMAs, plus optional 50 SMA for trend filtering. Each line can be toggled individually and color-customized.
✅ Multi-Timeframe Support & Resistance Zones
Automatically detects dynamic S/R zones on key timeframes (5min, 15min, 30min, 1H, 4H, 1D) using swing highs/lows. Zones are color-coded by strength and whether they're broken or active, providing a clear visual roadmap for price reaction levels.
✅ Zone Strength & Break Detection
Distinguishes between strong and weak zones based on price proximity and reaction depth, with visual shading and automatic label updates when a level is broken.
✅ Price Action-Based Buy/Sell Signals
Generates BUY signals when bullish candles react to strong support (supply) zones, and SELL signals when bearish candles react to strong resistance (demand) zones. All logic is adjustable — including candle body vs wick detection, tolerance range, and strength thresholds.
✅ Alerts Engine
Built-in TradingView alerts for price touching support/resistance or triggering buy/sell signals. Perfect for automation or hands-free monitoring.
✅ Optional Candle & Trend Filters
Highlight bullish/bearish candles visually for additional confirmation.
Optional RSI display and 50-period SMA trend filter to guide directional bias.
🧠 Use Case Scenarios:
Identify dynamic supply & demand zones across multiple timeframes.
Confirm trend direction with EMAs and SMA filters.
React quickly to clean BUY/SELL signals based on actual price interaction with strong zones.
Customize it fully to suit scalping, day trading, or swing trading strategies.
📌 Recommended Settings:
Use default zone transparency (65%) and offset (250 bars) for optimal visual clarity.
Enable alerts to get notified when price enters key S/R levels or when a trade signal occurs.
Combine this tool with your entry/exit plan for better decision-making under pressure.
💡 Pro Tip: Add this indicator to a clean chart and let the zones + EMAs guide your directional bias. Use alerts to avoid screen-watching and improve discipline.
Created by:
Version: Pine Script v6
Platform: TradingView

Stochastic RainbowThe Stochastic Rainbow indicator is a multi-layered momentum oscillator designed to provide a comprehensive view of market dynamics by combining multiple stochastic oscillators of varying periods. This approach allows traders to analyze both short-term and long-term momentum within a single visual framework, enhancing decision-making for entries and exits.
🔧 Indicator Settings and Customization
Select from various moving average methods (e.g., SMA, EMA, DEMA, TEMA, WMA, VWMA, RMA, T3) to smooth the stochastic lines. Different methods can affect the responsiveness of the indicator.
The indicator computes five sets of stochastic oscillators with Fibonacci values.
Each %K line is smoothed using the selected moving average type, and a corresponding %D line is plotted for each %K.
🎨 Visual Interpretation
The Stochastic Rainbow indicator plots multiple %K and %D lines, each with distinct colors for easy differentiation.
Additionally, horizontal dotted lines are drawn at levels 80 (Upper Band), 50 (Midline), and 20 (Lower Band) to indicate overbought, neutral, and oversold conditions, respectively.
📈 Trading Strategies Using Stochastic Rainbow
The multi-layered structure of the Stochastic Rainbow allows for nuanced analysis.
Trend Confirmation:
When all %K lines are above 50 and aligned in ascending order (short-term above long-term), it suggests a strong uptrend.
Conversely, when all %K lines are below 50 and aligned in descending order, it indicates a strong downtrend.
Overbought/Oversold Conditions:
If the shorter-term %K lines (e.g., %K 5,3 and %K 8,3) enter the overbought zone (>80) while longer-term lines remain below, it may signal a potential reversal.
Similarly, if shorter-term lines enter the oversold zone (<20) while longer-term lines remain above, it could indicate an upcoming bullish reversal.
Crossovers:
A bullish signal occurs when a %K line crosses above its corresponding %D line.
A bearish signal occurs when a %K line crosses below its corresponding %D line.
Divergence Analysis:
If price makes a new high while the %K lines do not, it may indicate bearish divergence and a potential reversal.
If price makes a new low while the %K lines do not, it may indicate bullish divergence and a potential reversal.
⚙️ Adjusting Settings for Optimal Use
The Stochastic Rainbow's flexibility allows traders to adjust settings to match their trading style and the specific asset's behavior:
Short-Term Trading: Use shorter periods (e.g., 5 for %K) and more responsive moving averages (e.g., WMA, VWMA, EMA, DEMA, TEMA, HMA) to capture quick market movements.
Long-Term Trading: Opt for longer periods (e.g., 55 for %K) and smoother moving averages (e.g., SMA, RMA, T3) to filter out noise and focus on broader trends.
Volatile Markets: Consider using the T3 moving average for its smoothing capabilities, helping to reduce false signals in choppy markets.
By experimenting with different settings, traders can fine-tune the indicator to better suit their analysis and improve decision-making.

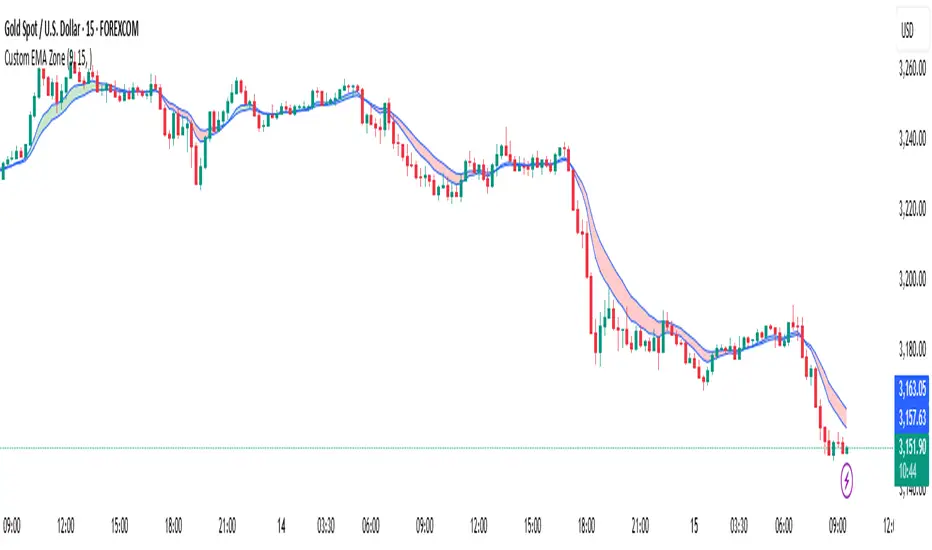
Custom EMA Zone1. Overview
The Custom EMA Cloud Indicator is a technical analysis tool designed to visually display a dynamic zone (or cloud) between two user-defined EMAs. It supports different EMA lengths and allows users to calculate these EMAs using custom timeframes. This flexibility makes it a powerful tool for identifying trends, key price zones, and potential trade signals.
2. Components of the Indicator
2.1. Exponential Moving Averages (EMAs)
EMA 1 (Faster EMA): Calculated using a shorter period (e.g., 21).
EMA 2 (Slower EMA): Calculated using a longer period (e.g., 50).
Users can customize the periods for both EMAs.
2.2. Timeframe Customization
Each EMA can be calculated using a higher timeframe than the chart’s timeframe (e.g., calculate EMA 50 on a 1-hour chart while viewing on a 5-minute chart).
This feature allows users to incorporate higher timeframe trend context into lower timeframe charts.
2.3. Cloud Zone
The cloud is the shaded area between EMA 1 and EMA 2.
Color Logic:
Light Green: Price opens and closes above both EMAs (bullish momentum).
Light Red: Price opens and closes below both EMAs (bearish momentum).
3. How to Use the Indicator
3.1. Trend Identification
When the entire price action is above the cloud, it signals a probable uptrend.
When the entire price action is below the cloud, it indicates a probable downtrend.
When the price is inside the cloud, it reflects probable market consolidation or indecision.
4. Use Cases in Trading Styles
4.1. Scalping
Use short EMAs (e.g., EMA 5 and EMA 13) on 1-minute or 3-minute charts.
Ideal for quick entries and exits during strong momentum moves.
4.2. Swing Trading
Use longer EMAs (e.g., EMA 21 and EMA 50) on 4-hour or daily charts.
Helps capture trend continuation over multiple days.
4.3. Trend Following
Combine with RSI or MACD to confirm trend strength before entering trades.
Stay in the trade as long as price respects the cloud direction.
5. Advantages
Visual Clarity: Simplifies decision-making with clearly defined zones.
Multi-Timeframe Insight: Offers a higher timeframe trend reference.
Customizable: Fits various strategies through adjustable EMAs and timeframes.
6. Limitations
Lagging Nature: As with all moving averages, there may be lag during fast reversals.
False Signals in Sideways Markets: May produce whipsaws during consolidation
RSI Horizontal resistance levelsRSI Horizontal Resistance Levels
Purpose
This study automatically draws horizontal price rays every time the Relative Strength Index (RSI) trades inside a user‑defined band (default = 50 ± 1). The idea is to spotlight price levels that historically coincided with a specific RSI state—levels that often evolve into short‑term support or resistance as sentiment repeats.
How it works
Raw RSI – The script computes an un‑smoothed RSI of the closing price (rsiLength, default = 3).
Trigger zone – Whenever RSI falls within level ± tolerance (e.g., 49 – 51) the close price of that bar becomes a reference.
Horizontal ray – A ray (extend.right) is drawn from that close and continues indefinitely to the right, creating a live price level.
History management – Only the most recent N rays are kept (maxRays, default = 5); the oldest line is deleted automatically to avoid chart clutter.
Inputs
Name Default Description
RSI Length 3 Look‑back of the RSI calculation.
RSI Level 50 Center of the trigger zone. Common alternatives: 30, 70, custom mid‑lines.
Tolerance 1 Width of the RSI band on each side of RSI Level (set 0 for an exact hit).
Max Rays 5 Maximum number of active horizontal levels kept on screen.
Ray Color Yellow Visual color of the rays.
Ray Width 2 Thickness of the rays.
How to use it
Spot recurring reaction zones – Markets often hesitate near prices where momentum has flipped before. The rays reveal those spots automatically.
Combine with candlestick or volume cues – A level marked by this script plus a rejection wick, volume spike, or divergence can strengthen conviction.
Adapt the band –
50 ± tolerance → momentum balance line (trend pullbacks)
70 ± tolerance → overbought fade levels
30 ± tolerance → oversold bounce levels
Works on any asset or timeframe; shorter RSI periods highlight intraday rotations, longer periods capture swing pivots.
Tips & cautions
A drawn line is not a guarantee of future reversal—always validate with price action and risk management.
For high‑frequency strategies, consider lowering tolerance or increasing rsiLength to reduce noise.
You can add custom alerts on RSI crossing the band to receive push or email notifications.
Happy trading!

Adaptive Volume-Weighted RSI (AVW-RSI)Concept Summary
The AVW-RSI is a modified version of the Relative Strength Index (RSI), where each price change is weighted by the relative trading volume for that period. This means periods of high volume (typically driven by institutions or “big money”) have a greater influence on the RSI calculation than periods of low volume.
Why AVW-RSI Helps Traders
Avoids Weak Signals During Low Volume
Standard RSI may show overbought/oversold zones even during low-volume periods (e.g., during lunch hours or after news).
AVW-RSI gives less weight to these periods, avoiding misleading signals.
Amplifies Strong Momentum Moves
If RSI is rising during high volume, it's more likely driven by institutional buying—AVW-RSI reflects that stronger by weighting the RSI component.
Filters Out Retail Noise
By prioritizing high-volume candles, it naturally discounts fakeouts caused by thin markets or retail-heavy moves.
Highlights Institutional Entry/Exit
Useful for spotting hidden accumulation/distribution that classic RSI would miss.
How It Works (Calculation Logic)
Traditional RSI Formula Recap
RSI = 100 - (100 / (1 + RS))
RS = Average Gain / Average Loss (over N periods)
Modified Step – Apply Volume Weight
For each period
Gain_t = max(Close_t - Close_{t-1}, 0)
Loss_t = max(Close_{t-1} - Close_t, 0)
Weight_t = Volume_t / AvgVolume(N)
WeightedGain_t = Gain_t * Weight_t
WeightedLoss_t = Loss_t * Weight_t
Weighted RSI
AvgWeightedGain = SMA(WeightedGain, N)
AvgWeightedLoss = SMA(WeightedLoss, N)
RS = AvgWeightedGain / AvgWeightedLoss
AVW-RSI = 100 - (100 / (1 + RS))
Visual Features on Chart
Line Color Gradient
Color gets darker as volume weight increases, signaling stronger conviction.
Overbought/Oversold Zones
Traditional: 70/30
Suggested AVW-RSI zones: Use dynamic thresholds based on historical volatility (e.g., 80/20 for high-volume coins).
Volume Spike Flags
Mark RSI turning points that occurred during volume spikes with a special dot/symbol.
Trading Strategies with AVW-RSI
1. Weighted RSI Divergence
Regular RSI divergence becomes more powerful when volume is high.
AVW-RSI divergence with volume spike is a strong signal of reversal.
2. Trend Confirmation
RSI crossing above 50 during rising volume is a good entry signal.
RSI crossing below 50 with high volume is a strong exit or short trigger.
3. Breakout Validation
Price breaking resistance + AVW-RSI > 60 with volume = Confirmed breakout.
Price breaking but AVW-RSI < 50 or on low volume = Potential fakeout.
Example Use Case
Stock XYZ is approaching a resistance zone. A trader sees:
Standard RSI: 65 → suggests strength.
Volume is 3x the average.
AVW-RSI: 78 → signals strong momentum with institutional backing.
The trader enters confidently, knowing this isn't just low-volume hype.
Limitations / Tips
Works best on liquid assets (Forex majors, large-cap stocks, BTC/ETH).
Should be used alongside price action and volume analysis—not standalone.
Periods of extremely high volume (news events) might need smoothing to avoid spikes.

Smart Trend Lines [The_lurker]
Smart Trend Lines
A multi-level trend classifier that detects bullish and bearish conditions using a methodology based on drawing trend lines—main, intermediate, and short-term—by identifying peaks and troughs. The tool highlights trend strength by applying filters such as the Average Directional Index (ADX) (A), Relative Strength Index (RSI) (R), and Volume (V), making it easier to interpret trend strength. The filter markers (V, A, R) in the Smart Trend Lines indicator are powerful tools for assessing the reliability of breakouts. Breakouts containing are the most reliable, as they indicate strong volume support, trend strength, and favorable momentum. Breakouts with partial filters (such as or ) require additional confirmation, while breakouts without filters ( ) should be avoided unless supported by other strong signals. By understanding the meaning of each filter and the market context.
Core Functionality
1. Trend Line Types
The indicator generates three distinct trend line categories, each serving a specific analytical purpose:
Main Trend Lines: These are long-term trend lines designed to capture significant market trends. They are calculated based on pivot points over a user-defined period (default: 50 bars). Main trend lines are ideal for identifying macro-level support and resistance zones.
Mid Trend Lines: These are medium-term trend lines (default: 21 bars) that focus on intermediate price movements. They provide a balance between short-term fluctuations and long-term trends, suitable for swing trading strategies.
Short Trend Lines: These are short-term trend lines (default: 9 bars) that track rapid price changes. They are particularly useful for scalping or day trading, highlighting immediate support and resistance levels.
Each trend line type can be independently enabled or disabled, allowing traders to tailor the indicator to their preferred timeframes.
2. Breakout Detection
The indicator employs a robust breakout detection system that identifies when the price crosses a trend line, signaling a potential trend reversal or continuation. Breakouts are validated using the following filters:
ADX Filter: The Average Directional Index (ADX) measures trend strength. A user-defined threshold (default: 20) ensures that breakouts occur during strong trends, reducing false signals in range-bound markets.
RSI Filter: The Relative Strength Index (RSI) identifies overbought or oversold conditions. Breakouts are filtered based on RSI thresholds (default: 65 for overbought, 35 for oversold) to avoid signals in extreme market conditions.
Volume Filter: Breakouts are confirmed only when trading volume exceeds a moving average (default: 20 bars) and aligns with the breakout direction (e.g., higher volume on bullish breakouts when the candle closes higher).
Breakout events are marked with labels on the chart, indicating the type of trend line broken (Main, Mid, or Short) and the filters satisfied (Volume, ADX, RSI). Alerts are triggered for each breakout, providing real-time notifications.
3. Customization Options
The indicator offers extensive customization through input settings, organized into logical groups for ease of use:
Main Trend Line Settings
Length: Defines the number of bars used to calculate pivot points (default: 50).
Bullish Color: Color for upward-sloping (bullish) main trend lines (default: green).
Bearish Color: Color for downward-sloping (bearish) main trend lines (default: red).
Style: Line style options include solid, dashed, or dotted (default: solid).
Mid Trend Line Settings
Length: Number of bars for mid-term pivot points (default: 21).
Show/Hide: Toggle visibility of mid trend lines (default: enabled).
Bullish Color: Color for bullish mid trend lines (default: lime).
Bearish Color: Color for bearish mid trend lines (default: maroon).
Style: Line style (default: dashed).
Short Trend Line Settings
Length: Number of bars for short-term pivot points (default: 9).
Show/Hide: Toggle visibility of short trend lines (default: enabled).
Bullish Color: Color for bullish short trend lines (default: teal).
Bearish Color: Color for bearish short trend lines (default: purple).
Style: Line style (default: dotted).
General Display Settings
Break Check Price: Selects the price type for breakout detection (Close, High, or Low; default: Close).
Show Previous Trendlines: Option to display historical main trend lines (default: disabled).
Label Size: Size of breakout labels (Tiny, Small, Normal, Large, Huge; default: Small).
Filter Settings
ADX Threshold: Minimum ADX value for trend strength confirmation (default: 25).
Volume MA Period: Period for the volume moving average (default: 20).
RSI Filter: Enable/disable RSI filtering (default: enabled).
RSI Upper Threshold: Upper RSI limit for overbought conditions (default: 65).
RSI Lower Threshold: Lower RSI limit for oversold conditions (default: 35).
4. Technical Calculations
The indicator relies on several technical calculations to ensure accuracy:
Pivot Points: Pivot highs and lows are detected using the ta.pivothigh and ta.pivotlow functions, with separate lengths for Main, Mid, and Short trend lines.
Slope Calculation: The slope of each trend line is calculated as the change in price divided by the change in bar index between two pivot points.
ADX Calculation: ADX is computed using a 14-period Directional Movement Index (DMI), with smoothing over 14 bars.
RSI Calculation: RSI is calculated over a 14-period lookback using the ta.rsi function.
Volume Moving Average: A simple moving average (SMA) of volume is used to determine if current volume exceeds the average.
5. Strict Mode Validation
To ensure the reliability of trend lines, the indicator employs a strict mode check:
For bearish trend lines, all prices between pivot points must remain below the projected trend line.
For bullish trend lines, all prices must remain above the projected trend line.
Post-pivot break checks ensure that no breakouts occur between pivot points, enhancing the validity of the trend line.
6. Trend Line Extension
Trend lines are dynamically extended forward until a breakout occurs. The extension logic:
Projects the trend line using the calculated slope.
Continuously validates the extension using strict mode checks.
Stops extension upon a breakout, fixing the trend line at the breakout point.
7. Alerts and Labels
Labels: Breakout labels are placed above (for bearish breakouts) or below (for bullish breakouts) the price bar. Labels include:
A prefix indicating the trend line type (B for Main, M for Mid, S for Short).
A suffix showing satisfied filters (e.g., for Volume, ADX, and RSI).
Alerts: Each breakout triggers a one-time alert per bar close, with a descriptive message indicating the trend line type and filters met.
Detailed Code Breakdown
1. Initialization and Inputs
The script begins by defining the indicator with indicator('Smart Trend Lines ', overlay = true), ensuring it overlays on the price chart. Input settings are grouped into categories (Main, Mid, Short, General Display, Filters) for user convenience. Each input includes a tooltip in both English and Arabic, enhancing accessibility.
2. Technical Indicator Calculations
Volume MA: Calculated using ta.sma(volume, volPeriod) to compare current volume against the average.
ADX: Computed using custom dirmov and adx functions, which calculate the Directional Movement Index and smooth it over 14 periods.
RSI: Calculated with ta.rsi(close, rsiPeriod) over 14 periods.
Price Selection: The priceToCheck function selects the price type (Close, High, or Low) for breakout detection.
3. Pivot Detection
Pivot points are detected using ta.pivothigh and ta.pivotlow for each trend line type. The lookback period is set to the respective trend line length (e.g., 50 for Main, 21 for Mid, 9 for Short).
4. Trend Line Logic
For each trend line type (Main, Mid, Short):
Bearish Trend Lines: Identified when two consecutive pivot highs form a downward slope. The script validates the trend line using strict mode and post-pivot break checks.
Bullish Trend Lines: Identified when two consecutive pivot lows form an upward slope, with similar validation.
Trend lines are drawn using line.new, with separate lines for the initial segment (between pivots) and the extended segment (from the second pivot forward).
5. Breakout Detection and Labeling
Breakouts are detected when the selected price crosses the trend line level. The script checks:
Volume conditions (above average and aligned with candle direction).
ADX condition (above threshold).
RSI condition (within thresholds if enabled). Labels are created with label.new, and alerts are triggered with alert.
6. Trend Line Extension
The extendTrendline function dynamically updates the trend line’s endpoint unless a breakout occurs. It uses strict mode checks to ensure the trend line remains valid.
7. Previous Trend Lines
If enabled, previous main trend lines are stored in arrays (previousBearishStartLines, previousBullishTrendLines, etc.) and displayed on the chart, providing historical context.
Disclaimer:
The information and publications are not intended to be, nor do they constitute, financial, investment, trading, or other types of advice or recommendations provided or endorsed by TradingView.

Time-Based Fair Value Gaps (FVG) with Inversions (iFVG)Overview
The Time-Based Fair Value Gaps (FVG) with Inversions (iFVG) (ICT/SMT) indicator is a specialized tool designed for traders using Inner Circle Trader (ICT) methodologies. Inspired by LuxAlgo's Fair Value Gap indicator, this script introduces significant enhancements by integrating ICT principles, focusing on precise time-based FVG detection, inversion tracking, and retest signals tailored for institutional trading strategies. Unlike LuxAlgo’s general FVG approach, this indicator filters FVGs within customizable 10-minute windows aligned with ICT’s macro timeframes and incorporates ICT-specific concepts like mitigation, liquidity grabs, and session-based gap prioritization.
This tool is optimized for 1–5 minute charts, though probably best for 1 minute charts, identifying bullish and bearish FVGs, tracking their mitigation into inverted FVGs (iFVGs) as key support/resistance zones, and generating retest signals with customizable “Close” or “Wick” confirmation. Features like ATR-based filtering, optional FVG labels, mitigation removal, and session-specific FVG detection (e.g., first FVG in AM/PM sessions) make it a powerful tool for ICT traders.
Originality and Improvements
While inspired by LuxAlgo’s FVG indicator (credit to LuxAlgo for their foundational work), this script significantly extends the original concept by:
1. Time-Based FVG Detection: Unlike LuxAlgo’s continuous FVG identification, this script filters FVGs within user-defined 10-minute windows each hour (:00–:10, :10–:20, etc.), aligning with ICT’s emphasis on specific periods of institutional activity, such as hourly opens/closes or kill zones (e.g., New York 7:00–11:00 AM EST). This ensures FVGs are relevant to high-probability ICT setups.
2. Session-Specific First FVG Option: A unique feature allows traders to display only the first FVG in ICT-defined AM (9:30–10:00 AM EST) or PM (1:30–2:00 PM EST) sessions, reflecting ICT’s focus on initial market imbalances during key liquidity events.
3. ICT-Driven Mitigation and Inversion Logic: The script tracks FVG mitigation (when price closes through a gap) and converts mitigated FVGs into iFVGs, which serve as ICT-style support/resistance zones. This aligns with ICT’s view that mitigated gaps become critical reversal points, unlike LuxAlgo’s simpler gap display.
4. Customizable Retest Signals: Retest signals for iFVGs are configurable for “Close” (conservative, requiring candle body confirmation) or “Wick” (faster, using highs/lows), catering to ICT traders’ need for precise entry timing during liquidity grabs or Judas swings.
5. ATR Filtering and Mitigation Removal: An optional ATR filter ensures only significant FVGs are displayed, reducing noise, while mitigation removal declutters the chart by removing filled gaps, aligning with ICT’s principle that mitigated gaps lose relevance unless inverted.
6. Timezone and Timeframe Safeguards: A timezone offset setting aligns FVG detection with EST for ICT’s New York-centric strategies, and a timeframe warning alerts users to avoid ≥1-hour charts, ensuring accuracy in time-based filtering.
These enhancements make the script a distinct tool that builds on LuxAlgo’s foundation while offering ICT traders a tailored, high-precision solution.
How It Works
FVG Detection
FVGs are identified when a candle’s low is higher than the high of two candles prior (bullish FVG) or a candle’s high is lower than the low of two candles prior (bearish FVG). Detection is restricted to:
• User-selected 10-minute windows (e.g., :00–:10, :50–:60) to capture ICT-relevant periods like hourly transitions.
• AM/PM session first FVGs (if enabled), focusing on 9:30–10:00 AM or 1:30–2:00 PM EST for key market opens.
An optional ATR filter (default: 0.25× ATR) ensures only gaps larger than the threshold are displayed, prioritizing significant imbalances.
Mitigation and Inversion
When price closes through an FVG (e.g., below a bullish FVG’s bottom), the FVG is mitigated and becomes an iFVG, plotted as a support/resistance zone. iFVGs are critical in ICT for identifying reversal points where institutional orders accumulate.
Retest Signals
The script generates signals when price retests an iFVG:
• Close: Triggers when the candle body confirms the retest (conservative, lower noise).
• Wick: Triggers when the candle’s high/low touches the iFVG (faster, higher sensitivity). Signals are visualized with triangular markers (▲ for bullish, ▼ for bearish) and can trigger alerts.
Visualization
• FVGs: Displayed as colored boxes (green for bullish, red for bearish) with optional “Bull FVG”/“Bear FVG” labels.
• iFVGs: Shown as extended boxes with dashed midlines, limited to the user-defined number of recent zones (default: 5).
• Mitigation Removal: Mitigated FVGs/iFVGs are removed (if enabled) to keep the chart clean.
How to Use
Recommended Settings
• Timeframe: Use 1–5 minute charts for precision, avoiding ≥1-hour timeframes (a warning label appears if misconfigured).
• Time Windows: Enable :00–:10 and :50–:60 for hourly open/close FVGs, or use the “Show only 1st presented FVG” option for AM/PM session focus.
• ATR Filter: Keep enabled (multiplier 0.25–0.5) for significant gaps; disable on 1-minute charts for more FVGs during volatility.
• Signal Preference: Use “Close” for conservative entries, “Wick” for aggressive setups.
• Timezone Offset: Set to -5 for EST (or -4 for EDT) to align with ICT’s New York session.
Trading Strategy
1. Macro Timeframes: Focus on New York (7:00–11:00 AM EST) or London (2:00–5:00 AM EST) kill zones for high institutional activity.
2. FVG Entries: Trade bullish FVGs as support in uptrends or bearish FVGs as resistance in downtrends, especially in :00–:10 or :50–:60 windows.
3. iFVG Retests: Enter on retest signals (▲/▼) during liquidity grabs or Judas swings, using “Close” for confirmation or “Wick” for speed.
4. Session FVGs: Use the “Show only 1st presented FVG” option to target the first gap in AM/PM sessions, often tied to ICT’s market maker algorithms.
5. Risk Management: Combine with ICT concepts like order blocks or breaker blocks for confluence, and set stops beyond FVG/iFVG boundaries.
Alerts
Set alerts for:
• “Bullish FVG Detected”/“Bearish FVG Detected”: New FVGs in selected windows.
• “Bullish Signal”/“Bearish Signal”: iFVG retest confirmations.
Settings Description
• Show Last (1–100, default: 5): Number of recent iFVGs to display. Lower values reduce clutter.
• Show only 1st presented FVG : Limits FVGs to the first in 9:30–10:00 AM or 1:30–2:00 PM EST sessions (overrides time window checkboxes).
• Time Window Checkboxes: Enable/disable FVG detection in 10-minute windows (:00–:10, :10–:20, etc.). All enabled by default.
• Signal Preference: “Close” (default) or “Wick” for iFVG retest signals.
• Use ATR Filter: Enables ATR-based size filtering (default: true).
• ATR Multiplier (0–∞, default: 0.25): Sets FVG size threshold (higher values = larger gaps).
• Remove Mitigated FVGs: Removes filled FVGs/iFVGs (default: true).
• Show FVG Labels: Displays “Bull FVG”/“Bear FVG” labels (default: true).
• Timezone Offset (-12 to 12, default: -5): Aligns time windows with EST.
• Colors: Customize bullish (green), bearish (red), and midline (gray) colors.
Why Use This Indicator?
This indicator empowers ICT traders with a tool that goes beyond generic FVG detection, offering precise, time-filtered gaps and inversion tracking aligned with institutional trading principles. By focusing on ICT’s macro timeframes, session-specific imbalances, and customizable signal logic, it provides a clear edge for scalping, swing trading, or reversal setups in high-liquidity markets.

6 Dynamic EMAs by Koenigsegg🚀 6 Dynamic EMAs by Koenigsegg
Take control of your chart with ultimate flexibility. This tool gives you 6 customizable EMAs across any timeframe, helping you read the market like a pro — whether you're scalping seconds or swinging days. Built for precision, designed for dominance.
The combinations? Endless. Mix and match any EMA lengths and timeframes for tailored confluence — exactly how elite traders operate.
🔑 Key Features
✅ 6 Fully Customizable EMAs
⏳ Multi-Timeframe Support (from seconds to months)
🎨 Custom Colors & Thickness for each EMA
🚨 Built-in Cross Alerts for instant trade signals
🧠 Clean, efficient logic using request.security()
🔁 Dynamically toggle EMAs on/off
⚙️ Lightweight for smooth chart performance
🧩 Endless combo potential — confluence on your terms
📈 What Is an EMA?
The EMA is a type of moving average that adjusts more quickly to recent price changes than a Simple Moving Average (SMA). It does this by giving exponentially more weight to the most recent candles.
⚙️ How Does It Function?
Smoothing Price Data:
It takes the average of closing prices over a chosen period (like 20 or 50 candles), but gives more influence to the latest prices.
Reacts Quickly to Price Shifts:
Since recent data is weighted more heavily, the EMA adjusts faster to sudden price changes — helping you spot trend reversals or momentum shifts earlier.
Dynamic Support & Resistance:
Traders often use EMAs as moving support/resistance levels. Price often "respects" EMAs in trending markets — bouncing off them during pullbacks.
Trend Confirmation:
- If price is above the EMA, the market is likely in an uptrend.
- If price is below the EMA, the market is likely in a downtrend.
- Multiple EMAs (like 12/21 or 50/200) crossing each other are used for entry/exit signals.
💡 Example:
If you use a 21 EMA on a chart, it shows you the average price of the last 21 candles, but the most recent ones weigh heavier. This makes the EMA more responsive than an SMA, and better for short-term or active trading.
📊 Why EMAs Matter — and How Multi-Timeframe EMAs Give You the Edge
Exponential Moving Averages (EMAs) are essential tools for identifying trend direction, momentum shifts, and dynamic support/resistance. Because they weight recent price data more heavily, EMAs adapt quickly to changing market conditions, giving traders early insight into reversals or continuations.
Where this script shines is in its multi-timeframe (MTF) capability. For example, plotting a daily EMA on a 4H chart gives you high-level directional guidance while still allowing precision entries. This enables confluence between LTF (low timeframe) signals and HTF (high timeframe) momentum — a crucial edge used by institutional-level traders.
You can configure the tool to run classic combos like the 12/21 crossover on your current chart, while layering in a 50 or 200 EMA from a higher timeframe for macro confirmation. The 6th EMA, colored light blue by default, is perfect for adding one final level of structure insight — often used as a long-term anchor or trend bias marker.
Whether you're riding the wave or catching the reversal, these EMAs serve as your adaptable compass in every environment.
🎯 Purpose
This indicator was built to give traders a clear, responsive, and multi-timeframe edge using dynamic Exponential Moving Averages. Whether you're trend-following, identifying momentum shifts, or building a confluence system — these 6 EMAs are here to align with your strategy and style.
💡 Pro Tip
Instead of cluttering your chart with multiple EMA indicators, this script consolidates all into one sleek tool. You can toggle off bands you don't currently need, like running only the 12/21 EMAs on your active chart timeframe, while adding the 12/21 EMAs from a higher timeframe to guide trade decisions.
With this setup, you're not just reacting — you're orchestrating your trades with intention.
⚠️ Disclaimer
This script is for educational and informational purposes only. It does not constitute financial advice. Always do your own research and trade responsibly. Past performance does not guarantee future results.

ICT Macro Zone Boxes w/ Individual H/L Tracking v3.1ICT Macro Zones (Grey Box Version
This indicator dynamically highlights key intraday time-based macro sessions using a clean, minimalistic grey box overlay, helping traders align with institutional trading cycles. Inspired by ICT (Inner Circle Trader) concepts, it tracks real-time highs and lows for each session and optionally extends the zone box after the session ends — making it a precision tool for intraday setups, order flow analysis, and macro-level liquidity sweeps.
### 🔍 **What It Does**
- Plots **six predefined macro sessions** used in Smart Money Concepts:
- AM Macro (09:50–10:10)
- London Close (10:50–11:10)
- Lunch Macro (11:30–13:30)
- PM Macro (14:50–15:10)
- London SB (03:00–04:00)
- PM SB (15:00–16:00)
- Each zone:
- **Tracks high and low dynamically** throughout the session.
- **Draws a consistent grey shaded box** to visualize price boundaries.
- **Displays a label** at the first bar of the session (optional).
- **Optionally extends** the box to the right after the session closes.
### 🧠 **How It Works**
- Uses Pine Script arrays to define each session’s time window, label, and color.
- Detects session entry using `time()` within a New York timezone context.
- High/Low values are updated per bar inside the session window.
- Once a session ends, the box is optionally closed and fixed in place.
- All visual zones use a standardized grey tone for clarity and consistency across charts.
### 🛠️ **Settings**
- **Shade Zone High→Low:** Enable/disable the grey macro box.
- **Extend Box After Session:** Keep the zone visible after it ends.
- **Show Entry Label:** Display a label at the start of each session.
### 🎯 **Why This Script is Unique**
Unlike basic session markers or colored backgrounds, this tool:
- Focuses on **macro moments of liquidity and reversal**, not just open/close times.
- Uses **per-session logic** to individually track price behavior inside key time windows.
- Supports **real-time high/low tracking and clean zone drawing**, ideal for Smart Money and ICT-style strategies.
Perfect — based on your list, here's a **bundle-style description** that not only explains the function of each script but also shows how they **work together** in a Smart Money/ICT workflow. This kind of cross-script explanation is exactly what TradingView wants to see to justify closed-source mashups or interdependent tools.
---
📚 ICT SMC Toolkit — Script Integration Guide
This set of advanced Smart Money Concept (SMC) tools is designed for traders who follow ICT-based methodologies, combining liquidity theory, time-based precision, and engineered confluences for high-probability trades. Each indicator is optimized to work both independently and synergistically, forming a comprehensive trading framework.
---
First FVG Custom Time Range
**Purpose:**
Plots the **first Fair Value Gap (FVG)** that appears within a defined session (e.g., NY Kill Zone, Custom range). Includes optional retest alerts.
**Best Used With:**
- Use with **ICT Macro Zones (Grey Box Version)** to isolate FVGs during high-probability times like AM Macro or PM SB.
- Combine with **Liquidity Levels** to assess whether FVGs form near swing points or liquidity voids.
---
ICT SMC Liquidity Grabs and OB s
**Purpose:**
Detects **liquidity grabs** (stop hunts above/below swing highs/lows) and **bullish/bearish order blocks**. Includes optional Fibonacci OTE levels for sniper entries.
**Best Used With:**
- Use with **ICT Turtle Soup (Reversal)** for confirmation after a liquidity grab.
- Combine with **Macro Zones** to catch order blocks forming inside timed macro windows.
- Match with **Smart Swing Levels** to confirm structure breaks before entry.
ICT SMC Liquidity Levels (Smart Swing Lows)
**Purpose:**
Automatically marks swing highs/lows based on user-defined lookbacks. Tracks whether those levels have been breached or respected.
**Best Used With:**
- Combine with **Turtle Soup** to detect if a swing level was swept, then reversed.
- Use with **Liquidity Grabs** to confirm a grab occurred at a meaningful structural point.
- Align with **Macro Zones** to understand when liquidity events occur within macro session timing.
ICT Turtle Soup (Liquidity Reversal)
**Purpose:**
Implements the classic ICT Turtle Soup model. Looks for swing failure and quick reversals after a liquidity sweep — ideal for catching traps.
Best Used With:
- Confirm with **Liquidity Grabs + OBs** to identify institutional activity at the reversal point.
- Use **Liquidity Levels** to ensure the reversal is happening at valid previous swing highs/lows.
- Amplify probability when pattern appears during **Macro Zones** or near the **First FVG**.
ICT Turtle Soup Ultimate V2
**Purpose:**
An enhanced, multi-layer version of the Turtle Soup setup that includes built-in liquidity checks, OTE levels, structure validation, and customizable visual output.
**Best Used With:**
- Use as an **entry signal generator** when other indicators (e.g., OBs, liquidity grabs) are aligned.
- Pair with **Macro Zones** for high-precision timing.
- Combine with **First FVG** to anticipate price rebalancing before explosive moves.
---
## 🧠 Workflow Example:
1. **Start with Macro Zones** to focus only on institutional trading windows.
2. Look for **Liquidity Grabs or Swing Sweeps** around key highs/lows.
3. Check for a **Turtle Soup Reversal** or **Order Block Reaction** near that level.
4. Confirm confluence with a **Fair Value Gap**.
5. Execute using the **OTE level** from the Liquidity Grabs + OB script.
---
Let me know which script you want to publish first — I’ll tailor its **individual TradingView description** and flag its ideal **“Best Used With” partners** to help users see the value in your ecosystem.

Price Change Sentiment Index [tradeviZion]Price Change Sentiment Index
A technical indicator that measures price changes relative to the day's range.
Indicator Overview
Normalizes price changes on a 0-100 scale
Uses a smoothing period for signal clarity
Shows potential overbought/oversold conditions
Inputs
Smoothing Period (default: 3)
Show Background Colors (on/off)
Overbought Level (default: 75)
Oversold Level (default: 25)
Reading the Indicator
Values above 75: Price change showing strong upward movement
Values below 25: Price change showing strong downward movement
Around 50: Neutral price movement
Technical Details
// Core calculation
changePct = (currClose - prevClose) / (high - low)
normalized = 50 + (changePct * 50)
smoothedNormalized = ta.sma(normalizedClamped, smoothingPeriod)
Usage Notes
Best used with other technical analysis tools
Adjustable smoothing period affects signal sensitivity
Background colors highlight extreme readings
Works on any timeframe
Settings Guide
Smoothing Period:
- Lower values (1-3): More responsive
- Higher values (5-10): Smoother output
Visual Settings: Toggle background colors
Levels: Adjust overbought/oversold thresholds
This indicator is a technical analysis tool. Please conduct your own research and testing before use.

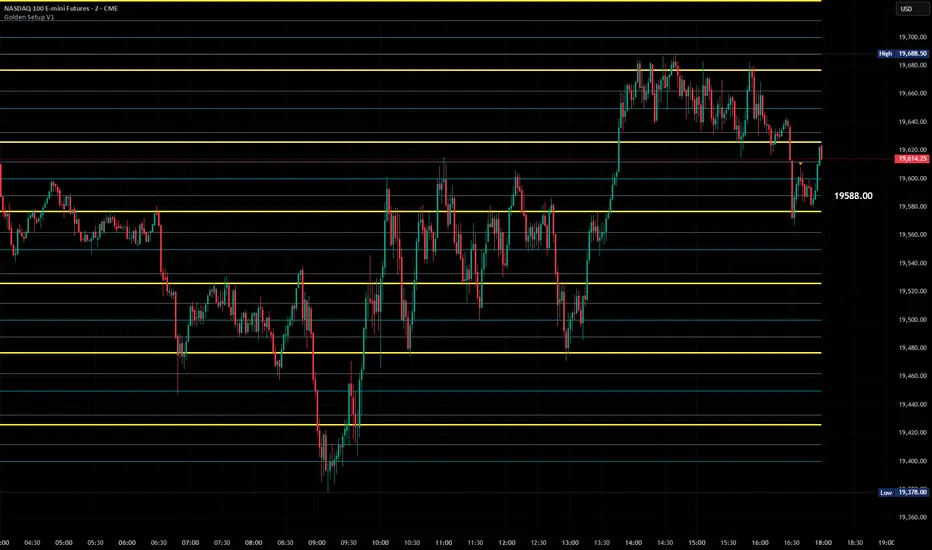
Golden Setup V1Golden Setup V1 is an overlay indicator that automates Tony Rago’s “Golden Setup” price-level framework. It divides the chart into fixed “blockSize” intervals (default 100 points) and plots a series of key horizontal levels within each block—levels at 00, 12, 26, 33, 50, 62, 77 and 88 offsets. These levels act as dynamic support and resistance grids that roll up or down as price moves between blocks.
Key Features
Customizable Offsets
Define eight offset levels corresponding to Rago’s Golden Setup:
00 (Round Number)
12 (Target 12)
26 (First “Golden” level)
33 (Target 33)
50 (Mid-block pivot)
62 (Target 62)
77 (Second “Golden” level)
88 (Target 88)
Multi-Block Coverage
Choose how many blocks above and below the current 100-point block you wish to display, so you always have levels drawn for the surrounding price range.
Golden-Only Filter
A handy toggle lets you show only the two “Golden” offsets (26 & 77), which many traders prioritize for high-probability bounce or breakout areas.
Dynamic Nearest-Level Label
Highlights the closest Golden Setup level (to the right edge of the chart) with a movable label, so you always know which level price is approaching.
Full Styling Control
Customize line colors, widths, block size, label fonts and opacity to suit your charting style.
How It Works
Block Calculation
On each bar, the indicator computes the “current block” by flooring (close / blockSize) and multiplying back by blockSize.
Level Offsets
It adds each of the eight user-defined offsets to that block base (and, if price has moved below the lowest offset, shifts the block down one interval).
Drawing
Each level is drawn as a horizontal line extending across the chart for as many blocks above/below as you select.
Nearest-Level Detection
Within the present block, it calculates which of the plotted levels is closest to price and displays that value on the right edge.
Usage Tips
Use the Golden-Only filter to declutter and focus solely on the 26 & 77 levels, which often act as strong intra-block pivot points.
Combine with volume or momentum indicators to confirm bounces at these levels.
Adjust blockSize (e.g. 50 or 200) if you wish to work in smaller or larger price increments.
⚠️ Disclaimer: This script is for educational and illustrative purposes only. Trading involves risk—always back-test and validate any strategy on a demo account before going live.
Williams R Zone Scalper v1.0[BullByte]Originality & Usefulness
Unlike standard Williams R cross-over scripts, this strategy layers five dynamic filters—moving-average trend, Supertrend, Choppiness Index, Bollinger Band Width, and volume validation —and presents a real-time dashboard with equity, PnL, filter status, and key indicator values. No other public Pine script combines these elements with toggleable filters and a custom dashboard. In backtests (BTC/USD (Binance), 5 min, 24 Mar 2025 → 28 Apr 2025), adding these filters turned a –2.09 % standalone Williams R into a +5.05 % net winner while cutting maximum drawdown in half.
---
What This Script Does
- Monitors Williams R (length 14) for overbought/oversold reversals.
- Applies up to five dynamic filters to confirm trend strength and volatility direction:
- Moving average (SMA/EMA/WMA/HMA)
- Supertrend line
- Choppiness Index (CI)
- Bollinger Band Width (BBW)
- Volume vs. its 50-period MA
- Plots blue arrows for Long entries (R crosses above –80 + all filters green) and red arrows for Short entries (R crosses below –20 + all filters green).
- Optionally sets dynamic ATR-based stop-loss (1.5×ATR) and take-profit (2×ATR).
- Shows a dashboard box with current position, equity, PnL, filter status, and real-time Williams R / MA/volume values.
---
Backtest Summary (BTC/USD(Binance), 5 min, 24 Mar 2025 → 28 Apr 2025)
• Total P&L : +50.70 USD (+5.05 %)
• Max Drawdown : 31.93 USD (3.11 %)
• Total Trades : 198
• Win Rate : 55.05 % (109/89)
• Profit Factor : 1.288
• Commission : 0.01 % per trade
• Slippage : 0 ticks
Even in choppy March–April, this multi-filter approach nets +5 % with a robust risk profile, compared to –2.09 % and higher drawdown for Williams R alone.
---
Williams R Alone vs. Multi-Filter Version
• Total P&L :
– Williams R alone → –20.83 USD (–2.09 %)
– Multi-Filter → +50.70 USD (+5.05 %)
• Max Drawdown :
– Williams R alone → 62.13 USD (6.00 %)
– Multi-Filter → 31.93 USD (3.11 %)
• Total Trades : 543 vs. 198
• Win Rate : 60.22 % vs. 55.05 %
• Profit Factor : 0.943 vs. 1.288
---
Inputs & What They Control
- wrLen (14): Williams R look-back
- maType (EMA): Trend filter type (SMA, EMA, WMA, HMA)
- maLen (20): Moving-average period
- useChop (true): Toggle Choppiness Index filter
- ciLen (12): CI look-back length
- chopThr (38.2): CI threshold (below = trending)
- useVol (true): Toggle volume-above-average filter
- volMaLen (50): Volume MA period
- useBBW (false): Toggle Bollinger Band Width filter
- bbwMaLen (50): BBW MA period
- useST (false): Toggle Supertrend filter
- stAtrLen (10): Supertrend ATR length
- stFactor (3.0): Supertrend multiplier
- useSL (false): Toggle ATR-based SL/TP
- atrLen (14): ATR period for SL/TP
- slMult (1.5): SL = slMult × ATR
- tpMult (2.0): TP = tpMult × ATR
---
How to Read the Chart
- Blue arrow (Long): Williams R crosses above –80 + all enabled filters green
- Red arrow (Short) : Williams R crosses below –20 + all filters green
- Dashboard box:
- Top : position and equity
- Next : cumulative PnL in USD & %
- Middle : green/white dots for each filter (green=passing, white=disabled)
- Bottom : Williams R, MA, and volume current values
---
Usage Tips
- Add the script : Indicators → My Scripts → Williams R Zone Scalper v1.0 → Add to BTC/USD chart on 5 min.
- Defaults : Optimized for BTC/USD.
- Forex majors : Raise `chopThr` to ~42.
- Stocks/high-beta : Enable `useBBW`.
- Enable SL/TP : Toggle `useSL`; stop-loss = 1.5×ATR, take-profit = 2×ATR apply automatically.
---
Common Questions
- * Why not trade every Williams R reversal?*
Raw Williams R whipsaws in sideways markets. Choppiness and volume filters reduce false entries.
- *Can I use on 1 min or 15 min?*
Yes—adjust ATR length or thresholds accordingly. Defaults target 5 min scalping.
- *What if all filters are on?*
Fewer arrows, higher-quality signals. Expect ~10 % boost in average win size.
---
Disclaimer & License
Trading carries risk of loss. Use this script “as is” under the Mozilla Public License 2.0 (mozilla.org). Always backtest, paper-trade, and adjust risk settings to your own profile.
---
Credits & References
- Pine Script v6, using TradingView’s built-in `ta.supertrend()`.
- TradingView House Rules: www.tradingview.com
Goodluck!
BullByte
