Search in scripts for "纳斯达克期货cfd"
ATR_XAUUSD-BITCOINT-US100_Daniel# ATR Daniel - Indicator Description
## 🇬🇧 ENGLISH VERSION
### ATR Daniel - Smart Trailing Stop Manager
**ATR Daniel** is an intelligent trailing stop indicator that automatically adapts to your trading style and the asset you're trading.
#### Key Features:
**🎯 3 Trading Modes:**
- **Swing Trading** - For position trading with wider stops
- **Intraday** - For day trading with balanced parameters
- **Scalping** - For quick trades with tight stops
**📊 Automatic Asset Detection:**
The indicator automatically recognizes 3 major assets and applies optimized parameters:
- **XAUUSD (Gold)** - Lower volatility settings
- **BTCUSDT (Bitcoin)** - Medium volatility settings
- **NAS100USD (Nasdaq 100)** - Higher volatility settings
**🔧 Flexible Configuration:**
- **Auto Mode**: Applies optimal parameters based on detected asset and selected trading mode
- **Manual Mode**: Customize ATR length and multiplier to your preferences
- **Customizable Colors**: Choose your own line color
- **ON/OFF Display**: Toggle line visibility as needed
**📈 Visual Display:**
- Dynamic trailing stop line that follows price action
- Color changes based on trend direction (bullish/bearish)
- Real-time info table showing:
- Current asset
- Trading mode
- ATR value
- Stop loss distance
- Recommended SL price
- Current trend direction
- Signal arrows at trend reversals (optional)
**💡 How It Works:**
The indicator uses ATR (Average True Range) to calculate dynamic stop loss levels that adapt to market volatility. The trailing stop follows the price in trending markets while protecting your position.
**Perfect for:**
- Traders who want automated stop loss management
- Multi-asset traders (Gold, Bitcoin, Nasdaq)
- All trading styles (Swing, Intraday, Scalping)
---

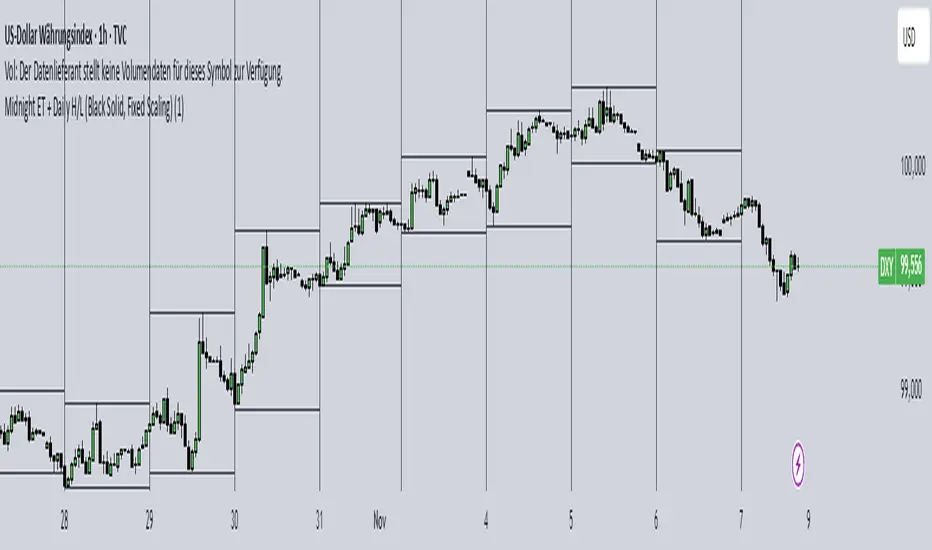
Midnight ET + Daily H/L True dayThis script divides each day from midnight EST to the next midnight opening price (True day). Full credits go to my mentor ICT for the idea behind the script
W%R Pullback+EMA Trend [TS_Indie]🔰 Core Concept of the Strategy
The main idea is “Trend-Following with Momentum Pullback.”
This means trading in the direction of the main trend (defined by EMA) while using Williams %R to identify pullback entries (buying the dip or selling the rally) where momentum returns to the trend direction.
📊 Indicators Used
1. EMA Fast – Defines the short-term trend.
2. EMA Slow – Defines the long-term trend (used as a trend filter).
3. Williams %R
• Overbought zone: above -20
• Oversold zone: below -80
⚙️ Entry Rules
🔹 Buy Setup
1. EMA Fast > EMA Slow → Uptrend condition.
2. Williams %R on the previous candle dropped below -80, and on the current candle, it crosses back above -80 → indicates momentum returning to the upside.
3. Current close is above EMA Fast.
4. Entry Buy at the close of the candle where %R crosses above -80.
🎯 Entry, Stop Loss, and Take Profit
1. Entry : At the candle close where the signal occurs.
2. Stop Loss : At the lowest low between the current and previous candles.
3. Take Profit : Calculated based on entry price and stop loss distance multiplied by the Risk/Reward Ratio.
🔹 Sell Setup
1. EMA Fast < EMA Slow → Downtrend condition.
2. Williams %R on the previous candle went above -20, and on the current candle, it crosses back below -20 → indicates renewed selling momentum.
3. Current price is below EMA Fast.
4. Entry Sell at the close of the candle where %R crosses below -20.
🎯 Entry, Stop Loss, and Take Profit
1. Entry : At the candle close where the signal occurs.
2. Stop Loss : At the highest high between the current and previous candles.
3. Take Profit : Calculated based on entry price and stop loss distance multiplied by the Risk/Reward Ratio.
⚙️ Optional Parameters
• Custom Risk/Reward Ratio for Take Profit.
• Option to add ATR buffer to Stop Loss.
• Adjustable EMA Fast period.
• Adjustable EMA Slow period.
• Adjustable Williams %R period.
• Option to enable Long only / Short only positions.
• Customizable Backtest start and end date.
• Customizable trading session time.
⏰ Alert Function
Alerts display:
• Entry price
• Stop Loss price
• Take Profit price
Guys, try adjusting the parameters yourselves!
I’ve been tweaking the settings for several days and managed to get great results on XAU/USD in the 5-minute timeframe.
I think this strategy is quite interesting and could potentially deliver good results on other instruments as well.
⚠️ Disclaimer
This indicator is designed for educational and research purposes only.
It does not guarantee profits and should not be considered financial advice.
Trading in financial markets involves significant risk, including the potential loss of capital.

Midnight ET + Daily H/L (vertical midnight + HL lines)This script provides midnight EST dividers for each day and marks each daily high and low during each True day. Credits go to my mentor ICT for the idea behind this script.

12M SMA Timing (HTF-safe, 100% equity)Buy when S&P500 closes above 12M moving average. Sell when it closes below it. Monthly only.

WaleedGhuman SMT/MSS/OF/ModelsAt the core of the WaleedGhuman SMT/MSS/OF/Models indicator lies a sophisticated Smart Money Technique (SMT) Divergence Engine that operates across specific distinct timeframes simultaneously. The result is a comprehensive market analysis tool that bridges the gap between macro market structure and micro price action, delivering institutional-grade divergence analysis in an accessible, visually intuitive format.

Elliott Wave Expert AdvisorElliott Wave Expert Advisor - Professional Wave Analysis Tool
OVERVIEW
--------
The Elliott Wave Expert Advisor is a comprehensive Pine Script indicator designed for TradingView that automates Elliott Wave analysis and generates high-probability trading signals. Built on Ralph Nelson Elliott's Wave Principle, this indicator identifies impulse wave patterns, validates them against strict Elliott Wave rules, and provides precise entry points with calculated risk management levels.
CORE FUNCTIONALITY
------------------
1. TREND DETECTION
- Dual Moving Average system (Fast/Slow MA)
- MACD confirmation for trend strength
- Automatic trend classification (Uptrend/Downtrend/Sideways)
- Only generates signals aligned with main trend
2. SWING POINT DETECTION
- Automatic pivot high/low identification
- Configurable sensitivity (lookback periods)
- Minimum swing size filtering to reduce noise
- ZigZag visualization connecting swing points
3. WAVE IDENTIFICATION
- 5-wave impulse pattern recognition (1-2-3-4-5)
- 3-wave corrective pattern detection (A-B-C)
- Wave labels displayed on chart
- Color-coded validation status (Blue = Valid, Orange = Pending)
4. ELLIOTT WAVE RULES VALIDATION
Strictly enforces three cardinal rules:
- Rule 1: Wave 2 never retraces more than 100% of Wave 1
- Rule 2: Wave 3 is never the shortest impulse wave
- Rule 3: Wave 4 never overlaps Wave 1 price territory
5. FIBONACCI ANALYSIS
- Automatic Fibonacci retracement calculations (23.6%, 38.2%, 50%, 61.8%, 78.6%)
- Fibonacci extension projections (100%, 161.8%, 261.8%)
- Wave 3 and Wave 5 target projections
- Fibonacci-based Take Profit levels
6. SIGNAL GENERATION
- Entry signals at Wave 2 completion (catch Wave 3)
- Entry signals at Wave 4 completion (catch Wave 5)
- Automatic Stop Loss placement below/above pivot points
- Multiple Take Profit targets (TP1 at 1.618 extension, TP2 at Wave 5 projection)
- Risk/Reward ratio calculation and filtering
- Minimum R:R threshold (default 1.5:1)
7. VISUAL ELEMENTS
- Pivot markers (H/L) showing swing highs and lows
- ZigZag lines connecting swing points
- Wave number labels (1-2-3-4-5) with validation colors
- Entry signal arrows (Green = BUY, Red = SELL)
- Stop Loss lines (Red dashed)
- Take Profit lines (Green dashed and dotted)
- Real-time status dashboard showing:
* Number of pivots detected
* Wave count progress (X/5)
* Pattern validation status
* Market trend direction
* Signal active status
* Helpful tips and guidance
OPTIMAL USAGE
-------------
• Timeframes: H1, H4, D1 (avoid M1-M5 due to noise)
• Markets: Forex majors (EUR/USD, GBP/USD), Gold (XAU/USD), Major Cryptocurrencies
• Market Conditions: Strong trending markets (avoid ranging/sideways conditions)
• Risk Management: Never risk more than 1-2% per trade
• Position Sizing: Based on calculated Stop Loss distance
CONFIGURATION PARAMETERS
------------------------
Trend Detection:
- MA Fast Period (default: 20)
- MA Slow Period (default: 50)
- MACD settings (12/26/9)
Swing Detection:
- Pivot Lookback Left/Right (default: 10/10, reduce to 5/5 for M15)
- Min Swing Size % (default: 0.1%, reduce to 0.05% for M15)
Wave Detection:
- Min Wave Size % (default: 0.5%, reduce to 0.2-0.3% for smaller timeframes)
Risk Management:
- SL Buffer % (default: 0.1%)
- TP1 Fibonacci Ratio (default: 1.618)
- Min Risk/Reward (default: 1.5)
Visualization:
- Toggle visibility for MAs, ZigZag, Wave Labels, Signals, SL/TP
- Customizable colors for all elements
- Optional trend background coloring
IMPORTANT NOTES
---------------
• Elliott Wave analysis is subjective - this indicator implements one specific interpretation
• Works best in trending markets; automatically suppresses signals in sideways conditions
• Signals are NOT repainting after pivot confirmation
• Not a "holy grail" - combine with other analysis and proper risk management
• Requires patience - quality setups are infrequent but high-probability
• Always backtest on historical data before live trading
ELLIOTT WAVE THEORY BACKGROUND
------------------------------
Elliott Wave Theory, developed by Ralph Nelson Elliott in the 1930s, proposes that market prices move in predictable wave patterns driven by investor psychology. An impulse wave consists of five sub-waves (three in the trend direction, two corrections), followed by a three-wave correction. This indicator automates the identification of these patterns and validates them against Elliott's original rules.
DISCLAIMER
----------
This indicator is for educational and informational purposes only. Past performance does not guarantee future results. Always conduct your own analysis and never trade with money you cannot afford to lose. The indicator provides signals based on technical analysis patterns and does not constitute financial advice.
VERSION
-------
v1.0 - Initial Release
Pine Script v5
Created: 2024
SUPPORT
-------
For detailed usage instructions, refer to the included documentation:
- usage_guide.md - Complete user manual with examples
- elliott_rules.md - Elliott Wave theory reference and implementation details

VWAP Kalman FilterOverview
This indicator applies Kalman filtering techniques to Volume Weighted Average Price (VWAP) calculations, providing a statistically optimized approach to VWAP analysis. The Kalman filter reduces noise while maintaining responsiveness to genuine price movements, addressing common VWAP limitations in volatile or low-volume conditions.
Technical Implementation
Kalman Filter Mathematics
The indicator implements a state-space model for VWAP estimation:
- Prediction Step: x̂(k|k-1) = x̂(k-1|k-1) + v(k-1)
- Update Step: x̂(k|k) = x̂(k|k-1) + K(k)
- Kalman Gain: K(k) = P(k|k-1) / (P(k|k-1) + R)
Where:
- x̂ = estimated VWAP state
- K = Kalman gain (adaptive weighting factor)
- P = error covariance
- R = measurement noise
- Q = process noise
- v = optional velocity component
Core Components
Dual VWAP System
- Standard VWAP: Traditional volume-weighted calculation
- Kalman-filtered VWAP: Noise-reduced estimation with optional velocity tracking
- Real-time divergence measurement between filtered and unfiltered values
Adaptive Filtering
- Process Noise (Q): Controls adaptation to price changes (0.001-1.0)
- Measurement Noise (R): Determines smoothing intensity (0.01-5.0)
- Optional velocity tracking for momentum-based filtering
Multi-Timeframe Anchoring
- Session, Weekly, Monthly, Quarterly, and Yearly anchor periods
- Automatic Kalman state reset on anchor changes
- Maintains VWAP integrity across timeframes
Features
Visual Components
- Dual VWAP Lines: Compare filtered vs. unfiltered in real-time
- Dynamic Bands: Three-level deviation bands (1σ, 2σ, 3σ)
- Trend Coloring: Automatic color adaptation based on price position
- Cloud Visualization: Highlights divergence between standard and Kalman VWAP
- Signal Markers: Crossover and band-touch indicators
Trading Signals
- VWAP crossover detection with Kalman filtering
- Band touch alerts at multiple standard deviation levels
- Velocity-based momentum confirmation (optional)
- Divergence warnings when filtered/unfiltered values separate
Information Display
- Real-time VWAP values (both standard and filtered)
- Trend direction indicator
- Velocity/momentum reading (when enabled)
- Divergence percentage calculation
- Anchor period display
Input Parameters
VWAP Settings
- Anchor Period: Choose calculation reset period
- Band Multipliers: Customize deviation band distances
- Display Options: Toggle standard VWAP and bands
Kalman Parameters
- Length: Base period for calculations (5-200)
- Process Noise (Q: Higher values increase responsiveness
- Measurement Noise (R): Higher values increase smoothing
- Velocity Tracking: Enable momentum-based filtering
Visual Controls
- Toggle filtered/unfiltered VWAP display
- Band visibility options
- Signal markers on/off
- Cloud fill between VWAPs
- Bar coloring by trend
Use Cases
Noise Reduction
Particularly effective during:
- Low volume periods (pre-market, lunch hours)
- Volatile market conditions
- Fast-moving markets where standard VWAP whipsaws
Trend Identification
- Cleaner trend signals with reduced false crosses
- Earlier trend detection through velocity component
- Confirmation through divergence analysis
Support/Resistance
- Filtered VWAP provides more stable S/R levels
- Bands adapt to filtered values for better zone identification
- Reduced false breakout signals
Technical Advantages
1. Optimal Estimation: Mathematically optimal under Gaussian noise assumptions
2. Adaptive Response: Self-adjusting to market conditions
3. Predictive Element: Velocity component provides forward-looking insight
4. Noise Immunity: Superior noise rejection vs. simple moving average smoothing
Limitations
- Assumes linear price dynamics
- Requires parameter optimization for different instruments
- May lag during sudden volatility regime changes
- Not suitable as standalone trading system
Mathematical Background
Based on control systems theory, the Kalman filter provides recursive Bayesian estimation originally developed for aerospace applications. This implementation adapts the algorithm specifically for financial time series, maintaining VWAP's volume-weighted properties while adding statistical filtering.
Comparison with Standard VWAP
Standard VWAP Issues Addressed:
- Choppy behavior in low volume
- Whipsaws around VWAP line
- Lag in trend identification
- Noise in deviation bands
Kalman VWAP Benefits:
- Smooth yet responsive line
- Fewer false signals
- Optional momentum tracking
- Statistically optimized filtering
Alert Conditions
The indicator includes several pre-configured alert conditions:
- Bullish/Bearish VWAP crosses
- Upper/Lower band touches
- High divergence warnings
- Velocity shifts (if enabled)
---
This open-source indicator is provided as-is for educational and trading purposes. No guarantees are made regarding trading performance. Users should conduct their own testing and validation before using in live trading.

Auto Fib Retracement-custom lines📈 Auto Fib Retracement (with Custom Line Thickness)
This indicator provides an automatic application of Fibonacci Retracement and Extension levels based on key Pivot points on the chart. It uses advanced logic to identify relevant momentum based on user-defined parameters, ensuring dynamic and accurate level drawing without the need for manual measurement.
Key Features of the Indicator ✨
Automatic Drawing: Fibonacci levels are automatically drawn based on the last significant Pivot swing detected by the indicator.
Fibonacci Retracement and Extension: Displays classic retracement levels (such as 0.382, 0.5, 0.618) and extensions (such as 1.272, 1.618, 2.618, etc.), with the option to individually toggle the visibility of each level.
Custom Line Width (New Feature): This is the key added functionality! For every Fibonacci level, an option has been included to individually adjust the line thickness (width). This allows traders to visually highlight (bold) critical support/resistance levels (like 0, 0.618, 1, etc.) to make them more noticeable on the chart.
Pivot Customization: Control the sensitivity of Pivot detection using the "Deviation" and "Depth" parameters.
Line Extension: Options to extend the Fibonacci lines to the left, right, or both sides.
Detail Display: Ability to show/hide Fibonacci values (levels) and prices on the labels.
⚙️ Input Parameters
This indicator offers complete control over how the Fibonacci levels are displayed:
Deviation: A multiplier that affects how much the price must deviate from the previous pivot for a new pivot to be formed. Increasing the value makes the indicator less sensitive; decreasing it makes it more sensitive.
Depth: The minimum number of bars considered when calculating the pivots.
Reverse: Option to reverse the drawing direction (from top to bottom or vice-versa).
Extend Left/Right: Controls the extension of the Fibonacci lines.
Level Settings (0, 0.236, 0.382, 0.5, 0.618, etc.):
Checkbox: Turn the display of each individual Fibonacci level on or off.
Value: Customize the Fibonacci value (e.g., you can change 0.618 to 0.65).
Color: Adjust the line color.
Line Width: Crucial option! Allows you to set the line thickness from 1 to 5. Use this to emphasize the most important levels.
Background Transparency: Adjust the transparency of the background fill between the Fibonacci levels.
How to Use It 💡
This tool is ideal for traders who use Fibonacci Retracement to determine potential areas of support and resistance, profit targets (extensions), and entry zones. Use the Custom Line Width option to visually set apart the key levels you believe have the most significant impact on the market (e.g., 0, 0.5, 0.618, and 1).

Pearson SL/TP📘 Description
Pearson SL/TP — Advanced Correlation-Based Strategy with Full Risk Management
The Pearson SL/TP indicator is an advanced market analysis tool that combines Pearson correlation, volatility-based stop/target levels, and dynamic signal strength evaluation.
It is designed for traders who want to visualize potential momentum shifts and risk/reward zones in a single, integrated chart.
🔍 Core Concept
This script measures the **Pearson correlation coefficient between recent price movements and time progression, highlighting potential trend exhaustion or momentum reversals when the correlation reaches extreme values.
* High positive correlation (near +1) → price moving steadily upward → possible overbought condition.
* High negative correlation (near -1) → price moving steadily downward → possible oversold condition.
When these extremes are reached, and confirmed by several internal filters, the script generates LONG or SHORT signals with fully calculated Stop Loss and Take Profit levels.
⚙️ Main Features
📈 Signal Generation
* Uses Pearson correlation as a primary indicator of trend intensity.
* Detects potential reversal zones when correlation crosses user-defined thresholds.
* Optional divergence confirmation enhances signal reliability.
💰 Risk Management
* Stop Loss (SL) and Take Profits (TP1 & TP2) automatically adapt to volatility using the ATR (Average True Range).
* Dynamic risk/reward ratios help assess trade quality.
* Adjustable multipliers let you fine-tune your risk parameters.
🧠 Signal Strength Analysis
Each signal is graded from Weak to Very Strong based on four factors:
1. Volume activity
2. Trend alignment
3. Pearson momentum
4. Correlation change intensity
🎨 Visualization
* Overbought / Oversold background zones
* Signal arrows (LONG / SHORT)
* SL / TP** price levels and labels
* Interactive dashboard** displaying:
* Current Pearson value
* Market state (Overbought / Oversold / Neutral)
* Signal strength
* Latest trade data (Entry, SL, TP1, TP2, Risk:Reward)
🔔 Alerts
Built-in alerts for:
* Confirmed LONG / SHORT signals
* Bullish / Bearish divergences
🧩 Customization
All major parameters — including **Pearson length, thresholds, ATR multipliers, and visual options — are fully customizable.
This allows you to adapt the indicator to any market, timeframe, or trading style.

Pivot Points High Low Multi Time Frame + AlertsThis script is a modified version of “Pivot Points High Low Multi Time Frame” for TradingView, enhanced with price alerts when the market reaches or crosses recent pivot levels.
What it does:
Detects Pivot Highs and Pivot Lows based on your chosen timeframe and bar settings.
Draws visual lines and labels at each pivot level for clear identification.
Keeps track of the latest pivot high and low values.
Triggers an alert condition when the price crosses either of those pivots.
Alert conditions included:
🔔 Price Crossed Pivot High — notifies when the price touches or moves above the last pivot high.
🔔 Price Crossed Pivot Low — notifies when the price touches or moves below the last pivot low.
How to use:
Add the script to your chart in TradingView.
Click the Alarm (🔔) icon → choose Add Alert.
Under Condition, select this indicator and pick one of the two alert types.
Choose your preferred alert frequency (Once per bar, Every time, etc.).
Tip: You can also visually see when alerts are triggered — small green and red triangles will appear above or below the bars where the price crosses a pivot.

Info de Vela 1m1-Minute Candle Info Dashboard (Real-Time)
Overview
This is a lightweight, real-time dashboard designed specifically for 1-minute (1m) scalping. It provides critical, non-lagging data about the current 1-minute candle, helping you make split-second decisions on stop-loss placement and risk assessment.The table updates on every tick without flickering or repainting.
Key Features (Real-Time Table)
The dashboard displays three key metrics about the current 1m candle:Time Remaining: A simple countdown timer showing the exact seconds remaining until the current candle closes (e.g., "00:34").Dist. to Extreme (Ticks): This is the core function for scalping. It calculates the distance (in ticks) from the current price to the furthest extreme of the candle (i.e., max(high - close, close - low)). This is ideal for traders who base their stop-loss on the current candle's range.Total Candle Range (Ticks): Displays the full high-to-low range of the current candle in ticks, giving you an instant read on volatility.
How to Use
This tool is designed to solve one problem: speed.Instead of manually measuring the distance for your stop-loss on every candle, you can instantly read the exact tick value from the table. This allows you to calculate your position size (lotage) much faster, which is essential in a fast-moving 1m environment.
REQUIREMENT:This indicator is designed to work ONLY on the 1-minute (1m) timeframe. It will display an error and show no data on any other chart.

Pivots 15m en 1mThis script is designed for scalpers and day traders who base their entries on low timeframes (like 1m) but reference liquidity levels from higher timeframes (HTF), in this case, 15m.Key Features:HTF Pivots on LTF: It calculates swing highs and swing lows (pivots) from the 15m chart and projects them as horizontal rays onto your 1m chart.Real-Time Mitigation: The rays (representing pending liquidity) are automatically deleted on the 1m candle as soon as the price mitigates (touches or breaks) that level. This allows you to clearly see which levels have already been tested and which have not.Configurable Pivot Strength: Includes an input to define the "Pivot Strength," allowing you to adjust how many candles on each side are needed to confirm a swing point (e.g., a value of 1 creates 3-bar pivots, a value of 2 creates 5-bar pivots, etc.).Info Table: Displays a real-time table with vital information from the current 1m candle:Time remaining until the candle closes.Total range of the candle in ticks.How to Use:This indicator must be loaded exclusively on a 1-minute (1m) chart.Adjust the "Pivot Strength" in the settings according to your strategy (a value of 1 or 2 is recommended).

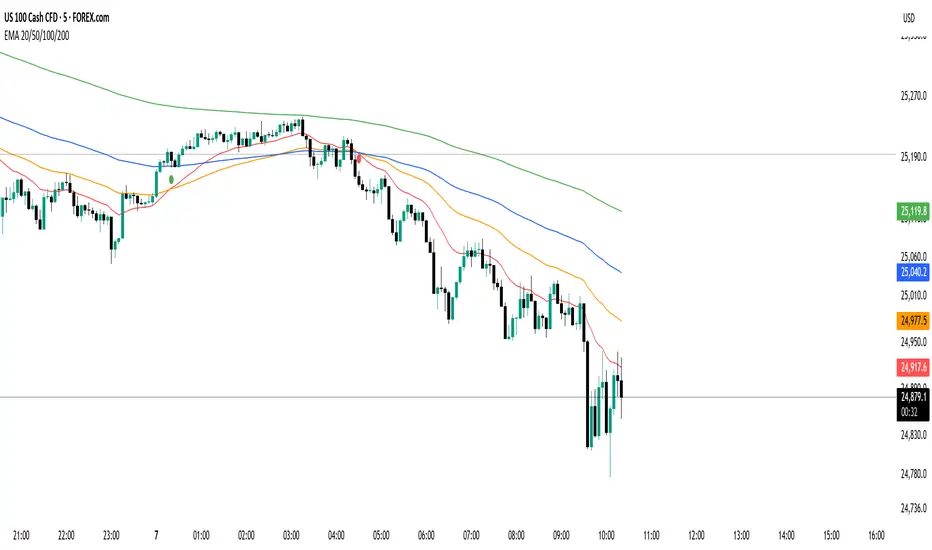
EMA 20/50/100/200 Trader IkkaEMA 20/50/100/200 📊 + Crossover Alerts 🔔 Trader Ikka
This indicator plots four key Exponential Moving Averages (EMA 20, 50, 100, and 200) to help identify trends.
It also detects and marks bullish 🟢 and bearish 🔴 crossovers between the EMA 20 and EMA 50, signaling potential trend reversals or continuations.
✨ Features:
📊 Plots EMA 20, 50, 100, and 200 with color-coded lines
🟢🔴 Highlights bullish and bearish crossovers between EMA 20 & EMA 50
🔔 Built-in alert conditions for automated notifications
⚡ Useful for identifying momentum shifts and entry/exit zones
Traderei SessionsTraderei Sessions shows the previous daily H/L + previous weekly H + L, daily open from the current day, the H/L from Asia/London/NY Session, including the 50% Level for Premium or Discount Price.
VPOC for each Session. VPOC do not work on FX ! only Crypto + Gold !
2 EMAs and 1 SMA, + 1 additional EMA/SMA.
default settings for EMA 20/50, SMA 200
all lines, labels can be toggled
KKTT V9Description for Publication
Order Flow + Opening Range Trend Dashboard Combo
This indicator combines Cumulative Volume Delta (CVD) momentum, Opening Range breakout levels, and a Multi-Timeframe Trend Dashboard to provide a complete intraday market view.
Features:
CVD Momentum (Order Flow):
Detects real buying/selling pressure by tracking cumulative delta between bullish and bearish candles.
Buy signal → when CVD crosses above its EMA, price above EMA200, and volume above average.
Sell signal → when CVD crosses below its EMA, price below EMA200, and volume above average.
Opening Range Levels:
Automatically marks the key session opening price, upper breakout (Buy Line), and lower breakout (Sell Line).
Helps identify potential breakout zones for major sessions (e.g., Asia, Europe, US).
Trend Dashboard:
Displays the trend status for multiple timeframes (D1, H4, H1, H15).
Green → Uptrend
Red → Downtrend
Orange → Sideways
Use this dashboard to align intraday signals with higher-timeframe trends.
Usage Tips:
Prioritize buy signals when higher-timeframe trends are bullish.
Prioritize sell signals when higher-timeframe trends are bearish.
Combine with support/resistance zones for better confirmation.
This script provides a clear visualization of order flow strength, market structure, and session volatility — ideal for traders who want to capture directional moves with strong momentum confirmation.

Hindenburg OmenThe Hindenburg Omen highlights periods of internal market stress — when both new 52-week highs and new lows expand while the NYSE remains in an uptrend.
This condition often precedes major corrections or volatility spikes by revealing divergence beneath the surface of an advancing market.
The indicator triggers when four classic breadth rules align: elevated highs and lows, a positive trend, a negative McClellan Oscillator, and a highs-to-lows ratio under 2:1.
Use it on broad indices (NYSE, S&P 500) as an early-warning context tool, NOT a standalone sell signal.

Quantura - Average Intraday Candle VolumeIntroduction
“Quantura – Average Intraday Candle Volume” is a quantitative visualization tool that calculates and displays the average traded volume for each intraday time position based on a user-defined historical lookback period. It allows traders to analyze recurring intraday volume patterns, identify high-activity sessions, and detect liquidity shifts throughout the trading day.
Originality & Value
This indicator goes beyond standard volume averages by normalizing and aligning volume data according to the time of day. Instead of simply smoothing recent bars, it builds an intraday volume profile based on historical daily averages, enabling users to understand when during the day volume typically peaks or drops.
Its originality and usefulness come from:
Converting standard volume data into time-aligned intraday averages.
Visualization of historical intraday liquidity behavior, not just total daily volume.
Dynamic scaling using normalization and transparency to emphasize active and quiet periods.
Optional day-separator lines for precise intraday structure recognition.
Gradient-based coloring for better visual interpretation of volume intensity.
Functionality & Core Logic
The indicator divides each day into discrete intraday time positions (based on chart timeframe).
For each position, it stores and updates historical volume values across the selected number of days.
It calculates an average volume per time position by aggregating all stored values and dividing them by the number of valid days.
The result is plotted as a continuous histogram showing typical intraday volume distribution.
The bar colors and transparency dynamically reflect the relative intensity of volume at each point in the day.
Parameters & Customization
Number of Days for Averaging: Defines how many past days are included in the volume average calculation (default: 365).
UTC Offset: Allows synchronization of intraday cycles with local or exchange time zones.
Base Color: Sets the main color for plotted volume columns.
Color Mode: Choose between “Gradient” (transparency dynamically adjusts by intensity) or “Normal” (fixed opacity).
Day Line: Toggles dashed vertical lines marking the start of each trading day.
Visualization & Display
Volume is plotted as a series of histogram bars, each representing the average volume for a specific intraday time position.
A gradient color mode enhances readability by fading lower-intensity areas and highlighting high-volume regions.
Optional day-separator lines visually segment historical sessions for easy reference.
Works seamlessly across all chart timeframes that divide the 24-hour day into regular bar intervals.
Use Cases
Identify when trading activity typically peaks (e.g., session opens, news windows, or overlapping markets).
Compare current intraday volume to historical averages for early anomaly detection.
Enhance algorithmic or discretionary strategies that depend on volume-timing alignment.
Combine with volatility or price structure indicators to confirm market activity zones.
Evaluate session consistency across different time zones using the UTC offset parameter.
Limitations & Recommendations
The indicator requires intraday data (below 1D resolution) to function properly.
Volume behavior may vary across brokers and assets; adjust averaging period accordingly.
Does not predict price movement — it provides volume-based context for analysis.
Works best when combined with structure or momentum-based indicators.
Markets & Timeframes
Compatible with all intraday markets — including crypto, Forex, equities, and futures — and all intraday timeframes (from 1 minute to 4 hours). It is particularly valuable for analyzing assets with continuous 24-hour trading activity.
Author & Access
Developed 100% by Quantura. Published as a Open-source script indicator. Access is free.
Important
This description complies with TradingView’s Script Publishing and House Rules. It provides a clear explanation of the indicator’s originality, logic, and purpose, without any unrealistic performance or predictive claims.

chart Pattern & Candle sticks Strategy# **XAUUSD Pattern & Candle Strategy - Complete Description**
## **Overview**
This Pine Script indicator is a comprehensive multi-factor trading system specifically designed for **XAUUSD (Gold) scalping and swing trading**. It combines classical technical analysis methods including candlestick patterns, chart patterns, moving averages, and volume analysis to generate high-probability buy/sell signals with automatic stop-loss and take-profit levels.
***
## **Core Components**
### **1. Moving Average System (Triple MA)**
**Purpose:** Identifies trend direction and momentum
- **Fast MA (20-period)** - Short-term price action
- **Medium MA (50-period)** - Intermediate trend
- **Slow MA (200-period)** - Long-term trend direction
**How it works:**
- **Bullish alignment**: MA20 > MA50 > MA200 (all pointing up)
- **Bearish alignment**: MA20 < MA50 < MA200 (all pointing down)
- **Crossover signals**: When Fast MA crosses Medium MA, it triggers buy/sell signals
- **Choice of SMA or EMA**: Adjustable based on preference
**Visual indicators:**
- Blue line = Fast MA
- Orange line = Medium MA
- Light red line = Slow MA
- Green background tint = Bullish trend
- Red background tint = Bearish trend
---
### **2. Candlestick Pattern Recognition (13 Patterns)**
**Purpose:** Identifies reversal and continuation signals based on price action
#### **Bullish Patterns (Signal potential upward moves):**
1. **Hammer** 🔨
- Long lower wick (2x body size)
- Small body at top
- Indicates rejection of lower prices (buyers stepping in)
- Best at support levels
2. **Inverted Hammer**
- Long upper wick
- Small body at bottom
- Shows buying pressure despite initial selling
3. **Bullish Engulfing** 📈
- Green candle completely engulfs previous red candle
- Strong reversal signal
- Body must be 1.2x larger than previous
4. **Morning Star** ⭐
- 3-candle pattern
- Red candle → Small indecision candle → Large green candle
- Powerful reversal at bottoms
5. **Piercing Line** ⚡
- Green candle closes above 50% of previous red candle
- Indicates strong buying interest
6. **Bullish Marubozu**
- Almost no wicks (95% body)
- Very strong bullish momentum
- Body must be 1.3x average size
#### **Bearish Patterns (Signal potential downward moves):**
7. **Shooting Star** 💫
- Long upper wick
- Small body at bottom
- Indicates rejection of higher prices (sellers in control)
- Best at resistance levels
8. **Hanging Man**
- Similar to hammer but appears at top
- Warning of potential reversal down
9. **Bearish Engulfing** 📉
- Red candle completely engulfs previous green candle
- Strong reversal signal
10. **Evening Star** 🌙
- 3-candle pattern (opposite of Morning Star)
- Green → Small → Large red candle
- Powerful top reversal
11. **Dark Cloud Cover** ☁️
- Red candle closes below 50% of previous green candle
- Indicates strong selling pressure
12. **Bearish Marubozu**
- Almost no wicks, pure red body
- Very strong bearish momentum
#### **Neutral Pattern:**
13. **Doji**
- Open and close nearly equal (tiny body)
- Indicates indecision
- Often precedes major moves
**Detection Logic:**
- Compares body size, wick ratios, and position relative to previous candles
- Uses 14-period average body size as reference
- All patterns validated against volume confirmation
***
### **3. Chart Pattern Recognition**
**Purpose:** Identifies major support/resistance and reversal patterns
#### **Patterns Detected:**
**Double Bottom** 📊 (Bullish)
- Two lows at approximately same level
- Indicates strong support
- Breakout above neckline triggers buy signal
- Most reliable at major support zones
**Double Top** 📊 (Bearish)
- Two highs at approximately same level
- Indicates strong resistance
- Breakdown below neckline triggers sell signal
- Most reliable at major resistance zones
**Support & Resistance Levels**
- Automatically plots recent pivot highs (resistance)
- Automatically plots recent pivot lows (support)
- Uses 3-bar strength for validation
- Levels shown as dashed horizontal lines
**Price Action Patterns**
- **Uptrend detection**: Higher highs + higher lows
- **Downtrend detection**: Lower highs + lower lows
- Confirms overall market structure
***
### **4. Volume Analysis**
**Purpose:** Confirms signal strength and filters false signals
**Metrics tracked:**
- **Volume MA (20-period)**: Baseline average volume
- **High volume threshold**: 1.5x the volume average
- **Volume increase**: Current volume > previous 2 bars
**How it's used:**
- All buy/sell signals **require volume confirmation**
- High volume = institutional participation
- Low volume signals are filtered out
- Prevents whipsaw trades during quiet periods
**Visual indicator:**
- Dashboard shows "High" volume in orange when active
- "Normal" shown in gray during low volume
***
### **5. Signal Generation Logic**
**BUY SIGNALS triggered when ANY of these occur:**
1. **Candlestick + Volume**
- Bullish candle pattern detected
- High volume confirmation
- Price above Fast MA
2. **MA Crossover + Volume**
- Fast MA crosses above Medium MA
- High volume confirmation
3. **Double Bottom Breakout**
- Price breaks above support level
- Volume confirmation present
4. **Trend Continuation**
- Uptrend structure intact (higher highs/lows)
- All MAs in bullish alignment
- Price above Fast MA
- Volume confirmation
**SELL SIGNALS triggered when ANY of these occur:**
1. **Candlestick + Volume**
- Bearish candle pattern detected
- High volume confirmation
- Price below Fast MA
2. **MA Crossunder + Volume**
- Fast MA crosses below Medium MA
- High volume confirmation
3. **Double Top Breakdown**
- Price breaks below resistance level
- Volume confirmation present
4. **Trend Continuation**
- Downtrend structure intact (lower highs/lows)
- All MAs in bearish alignment
- Price below Fast MA
- Volume confirmation
***
### **6. Risk Management System**
**Automatic Stop Loss Calculation:**
- Based on ATR (Average True Range) - 14 periods
- **Formula**: Entry price ± (ATR × SL Multiplier)
- **Default multiplier**: 1.5 (adjustable)
- Adapts to market volatility automatically
**Automatic Take Profit Calculation:**
- **Formula**: Entry price ± (ATR × TP Multiplier)
- **Default multiplier**: 2.5 (adjustable)
- **Default Risk:Reward ratio**: 1:1.67
- Higher TP multiplier = more aggressive targets
**Position Management:**
- Tracks ONE position at a time (no pyramiding)
- Automatically closes position when:
- Stop loss is hit
- Take profit is reached
- Opposite MA crossover occurs
- Prevents revenge trading and over-leveraging
**Visual Representation:**
- **Red horizontal line** = Stop Loss level
- **Green horizontal line** = Take Profit level
- Lines remain on chart while position is active
- Automatically disappear when position closes
***
### **7. Visual Elements**
**On-Chart Displays:**
1. **Moving Average Lines**
- Fast MA (Blue, thick)
- Medium MA (Orange, thick)
- Slow MA (Red, thin)
2. **Support/Resistance**
- Green crosses = Support levels
- Red crosses = Resistance levels
3. **Buy/Sell Arrows**
- Large GREEN "BUY" label below bars
- Large RED "SELL" label above bars
4. **Pattern Labels** (Small markers)
- "Hammer", "Bull Engulf", "Morning Star" (green, below bars)
- "Shooting Star", "Bear Engulf", "Evening Star" (red, above bars)
- "Double Bottom" / "Double Top" (blue/orange)
5. **Signal Detail Labels** (Medium size)
- Shows signal reason (e.g., "Bullish Candle", "MA Cross Up")
- Displays Entry, SL, and TP prices
- Color-coded (green for long, red for short)
6. **Background Coloring**
- Light green tint = Bullish MA alignment
- Light red tint = Bearish MA alignment
***
### **8. Information Dashboard**
**Top-right corner table showing:**
| Metric | Description |
|--------|-------------|
| **Position** | Current trade status (LONG/SHORT/None) |
| **MA Trend** | Overall trend direction (Bullish/Bearish/Neutral) |
| **Volume** | Current volume status (High/Normal) |
| **Pattern** | Last detected candlestick pattern |
| **ATR** | Current volatility measurement |
**Purpose:**
- Quick at-a-glance market assessment
- Real-time position tracking
- No need to check multiple indicators
***
### **9. Alert System**
**Complete alert coverage for:**
✅ **Entry Alerts**
- "Buy Signal" - Triggers when buy conditions met
- "Sell Signal" - Triggers when sell conditions met
✅ **Exit Alerts**
- "Long TP Hit" - Take profit reached on long position
- "Long SL Hit" - Stop loss triggered on long position
- "Short TP Hit" - Take profit reached on short position
- "Short SL Hit" - Stop loss triggered on short position
**How to use:**
1. Click "Create Alert" button
2. Select desired alert from dropdown
3. Set notification method (popup, email, SMS, webhook)
4. Never miss a trade opportunity
***
## **Recommended Settings**
### **For Scalping (Quick trades):**
- **Timeframe**: 5-minute
- **Fast MA**: 9
- **Medium MA**: 21
- **Slow MA**: 50
- **SL Multiplier**: 1.0
- **TP Multiplier**: 2.0
- **Volume Threshold**: 1.5x
### **For Swing Trading (Longer holds):**
- **Timeframe**: 1-hour or 4-hour
- **Fast MA**: 20
- **Medium MA**: 50
- **Slow MA**: 200
- **SL Multiplier**: 2.0
- **TP Multiplier**: 3.0
- **Volume Threshold**: 1.3x
### **Best Trading Hours for XAUUSD:**
- **Asian Session**: 00:00 - 08:00 GMT (lower volatility)
- **London Session**: 08:00 - 16:00 GMT (high volatility) ⭐
- **New York Session**: 13:00 - 21:00 GMT (highest volume) ⭐
- **London-NY Overlap**: 13:00 - 16:00 GMT (BEST for scalping) 🔥
***
## **How to Use This Strategy**
### **Step 1: Setup**
1. Open TradingView
2. Load XAUUSD chart
3. Select timeframe (5m, 15m, 1H, or 4H)
4. Add indicator from Pine Editor
5. Adjust settings based on your trading style
### **Step 2: Wait for Signals**
- Watch for GREEN "BUY" or RED "SELL" labels
- Check the signal reason in the detail label
- Verify dashboard shows favorable conditions
- Confirm volume is "High" (not required but preferred)
### **Step 3: Enter Trade**
- Enter at market or limit order near signal price
- Note the displayed Entry, SL, and TP prices
- Set your broker's SL/TP to match indicator levels
### **Step 4: Manage Position**
- Watch for SL/TP lines on chart
- Monitor dashboard for trend changes
- Exit manually if opposite MA crossover occurs
- Let SL/TP do their job (don't move them!)
### **Step 5: Review & Learn**
- Track win rate over 20+ trades
- Adjust multipliers if needed
- Note which patterns work best for you
- Refine entry timing
***
## **Key Advantages**
✅ **Multi-confirmation approach** - Reduces false signals significantly
✅ **Automatic risk management** - No manual calculation needed
✅ **Adapts to volatility** - ATR-based SL/TP adjusts to market conditions
✅ **Volume filtered** - Ensures institutional participation
✅ **Visual clarity** - Easy to understand at a glance
✅ **Complete alert system** - Never miss opportunities
✅ **Pattern education** - Learn patterns as they appear
✅ **Works on all timeframes** - Scalping to swing trading
***
## **Limitations & Considerations**
⚠️ **Not a holy grail** - No strategy wins 100% of trades
⚠️ **Requires practice** - Demo trade first to understand signals
⚠️ **Market conditions matter** - Works best in trending or volatile markets
⚠️ **News events** - Avoid trading during major economic releases
⚠️ **Slippage on 5m** - Fast markets may have execution delays
⚠️ **Pattern subjectivity** - Some patterns may trigger differently than expected
***
## **Risk Management Rules**
1. **Never risk more than 1-2% per trade**
2. **Maximum 3 positions per day** (avoid overtrading)
3. **Don't trade during major news** (NFP, FOMC, etc.)
4. **Use proper position sizing** (0.01 lot per $100 for micro accounts)
5. **Keep trade journal** (track patterns, win rate, mistakes)
6. **Stop trading after 3 consecutive losses** (psychological reset)
7. **Don't move stop loss further away** (accept losses)
8. **Take partial profits** at 1:1 R:R if desired
***
## **Expected Performance**
**Realistic expectations:**
- **Win rate**: 50-65% (depending on market conditions and timeframe)
- **Risk:Reward**: 1:1.67 default (adjustable to 1:2 or 1:3)
- **Signals per day**: 3-8 on 5m, 1-3 on 1H
- **Best months**: High volatility periods (news events, economic uncertainty)
- **Drawdowns**: Expect 3-5 losing trades in a row occasionally
***
## **Customization Options**
All inputs are adjustable in settings panel:
**Moving Averages:**
- Type (SMA or EMA)
- All three period lengths
**Volume:**
- Volume MA length
- High volume multiplier threshold
**Chart Patterns:**
- Pattern strength (bars for pivot detection)
- Show/hide pattern labels
**Risk Management:**
- ATR period
- Stop loss multiplier
- Take profit multiplier
**Display:**
- Toggle pattern labels
- Customize colors (in code)
***
## **Conclusion**
This is a **professional-grade, multi-factor trading system** that combines the best of classical technical analysis with modern risk management. It's designed to give clear, actionable signals while automatically handling the complex calculations of stop loss and take profit levels.
**Best suited for traders who:**
- Understand basic technical analysis
- Can follow rules consistently
- Prefer systematic approach over gut feeling
- Want visual confirmation before entering trades
- Value proper risk management
**Start with demo trading** for at least 20-30 trades to understand how the signals work in different market conditions. Once comfortable and profitable on demo, transition to live trading with minimal risk per trade.
Happy trading! 📈🎯

XAUUSD Best Strategy - Buy/Sell SignalsThe best strategy to trade XAUUSD (gold) often depends on your trading style and market conditions, but several high-probability approaches are recommended by top traders and industry experts for both scalping and swing trading.
Trend-Following Using EMAs
Use a combination of 9-period and 21-period Exponential Moving Averages (EMA) on the 5-minute or 15-minute chart.
Enter long when the 9 EMA crosses above the 21 EMA, especially when overall trend aligns with higher timeframes (such as H1 or H4).
Confirm entries with an RSI value above 50 for buys (or below 50 for sells).
Set stop loss just below the latest swing low for long positions.
Ideal for fast-moving, trending sessions (London and New York overlap).

PDH PDL Open ClosePDH/PDL/Open/Close Levels Indicator
Overview
This Pine Script indicator plots the Previous Day High (PDH), Previous Day Low (PDL), Previous Day Open (PDO), and Previous Day Close (PDC) levels on your chart. It's designed for traders who rely on key daily levels to identify potential support, resistance, and intraday reference points. The indicator supports multiple timeframes, allowing you to visualize these levels from higher timeframes (e.g., weekly or monthly) directly on lower timeframe charts.
Built with Pine Script v6, it's lightweight, customizable, and overlays seamlessly on any symbol. Lines extend slightly into the future for better visibility, and labels provide clear identification with price values.
Key Features
- Multi-Timeframe Support: Choose from predefined timeframes (5m to 1M) via the input settings to fetch and plot levels from the selected period.
- Clean Visualization:
- PDH and PDL: Solid black lines for high/low levels.
- PDO: Dotted blue line for the opening price.
- PDC: Dotted red line for the closing price.
- Dynamic Labels: Automatically placed at the end of each line, showing the timeframe and exact price (e.g., "1D High: 150.25").
- Efficient Updates: Lines and labels update in real-time without cluttering the chart—old elements are automatically cleaned up.
- Extension Handling: Lines extend 2 bars ahead by default, adjustable if needed via code modifications.
How to Use
1. Add to Chart**: Copy the script into TradingView's Pine Editor, save, and add it to your chart.
2. Customize Timeframe: In the indicator settings, select your desired timeframe (default: 1D). This pulls levels from the previous period of that timeframe.
3. Interpret Levels:
- Use PDH/PDL as potential resistance/support zones.
- PDO/PDC can highlight session biases (e.g., gap fills or continuation patterns).
- Ideal for day trading, swing setups, or aligning with higher timeframe context.
4. Best Practices: Works on any market (stocks, forex, crypto). Combine with volume or momentum indicators for confluence.
Settings
- Timeframe: Dropdown with options: 5m, 10m, 15m, 30m, 45m, 1H, 2H, 3H, 4H, 1D, 1W, 1M.
- No other inputs for simplicity—colors, styles, and extensions are hardcoded for a clean default look. Edit the script to tweak (e.g., line colors or extension length).

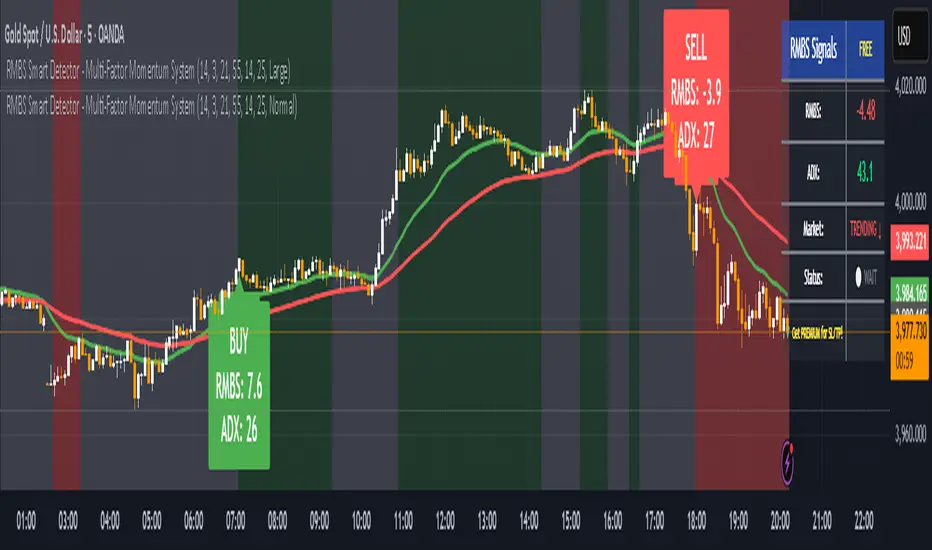
RMBS Smart Detector - Multi-Factor Momentum System v2# RMBS Smart Detector - Multi-Factor Momentum System
## Overview
RMBS (Smart Detector - Multi-Factor Momentum System) is a proprietary scoring method developed by Ario, combining normalized RSI and Bollinger band positioning into a single composite metric.
---
## Core Methodology
### Buy/Sell Logic
Marker (green or red )appear when **all four filters** pass:
**1. RMBS Score (Momentum Strength)**
From the formula Bellow
Combined Range: -10 (extreme bearish) to +10 (extreme bullish)
Signal Thresholds:
• BUY: Score > +3.0
• SELL: Score < -3.0
2. EMA Trend Filter
BUY: EMA(21) > EMA(55) → Uptrend confirmed
SELL: EMA(21) < EMA(55) → Downtrend confirmed
3. ADX Strength Filter
Minimum ADX: 25 (adjustable 20-30)
ADX > 25: Trending market → Signal allowed
ADX < 25: Range-bound → Signal blocked
4. Alternating Logic
Prevents signal spam by requiring alternation:
✓ BUY → SELL → BUY (allowed)
✗ BUY → BUY → BUY (blocked)
________________________________________
Mathematical Foundation
RMBS Formula: scoring method developed by Ario
RMBS = (RSI – 50) / 10 + ((BB_pos – 50) / 10)
where:
• RSI = Relative Strength Index (close, L)
• BB_pos = (Close – (SMA – 2 σ)) / ((SMA + 2 σ) – (SMA – 2 σ)) × 100
• σ = standard deviation of close over lookback L
• SMA = simple moving average of close over lookback L
• L = rmbs_length (period setting)
This produces a normalized composite score around zero:
• Positive → bullish momentum and upper band dominance
• Negative → bearish momentum and lower band pressure
• Near 0 → neutral or transitional zone
Input Parameters
ADX Threshold (default: 25)
• Lower (20-23): More signals, less filtering
• Higher (28-30): Fewer signals, stronger trends
• Recommended: 25 for balanced filtering
Signal Thresholds
• BUY: +3.0 (adjustable)
• SELL: -3.0 (adjustable)
Visual Options
• Marker colors
• Background highlights
• Alert settings
________________________________________
Usage Guidelines
How to Interpret
• 🟢 Green Marker: All conditions met for Bull condition
• 🔴 Red Marker: All conditions met for Bear condition
• No Marker: Waiting for confirmation
________________________________________
Important Disclaimers
⚠️ Educational Purpose Only
• This tool demonstrates multi-factor technical analysis concepts
• Not financial advice or trade recommendations
• No guarantee of profitability
⚠️ Known Limitations
• Less effective in ranging/choppy markets
• Requires proper risk management (stop-loss, position sizing)
• Should be combined with fundamental analysis
⚠️ Risk Warning
Trading involves substantial risk of loss. Past performance does not indicate future results. Always conduct your own research and consult professionals before trading.
________________________________________
Open Source
Full Pine Script code available for educational study and modification. Feedback and improvement suggestions welcome.
“All logic is presented for research and educational visualization.”