VIX Volatility Trend Analysis With Signals - Stocks OnlyVIX VOLATILITY TREND ANALYSIS CLOUD WITH BULLISH & BEARISH SIGNALS - STOCKS ONLY
This indicator is a visual aid that shows you the bullish or bearish trend of VIX market volatility so you can see the VIX trend without switching charts. When volatility goes up, most stocks go down and vice versa. When the cloud turns green, it is a bullish sign. When the cloud turns red, it is a bearish sign.
This indicator is meant for stocks with a lot of price action and volatility, so for best results, use it on charts that move similar to the S&P 500 or other similar charts.
This indicator uses real time data from the stock market overall, so it should only be used on stocks and will only give a few signals during after hours. It does work ok for crypto, but will not give signals when the US stock market is closed.
**HOW TO USE**
When the VIX Volatility Index trend changes direction, it will give a green or red line on the chart depending on which way the VIX is now trending. The cloud will also change color depending on which way the VIX is trending. Use this to determine overall market volatility and place trades in the direction that the indicator is showing. Do not use this by itself as sometimes markets won’t react perfectly to the overall market volatility. It should only be used as a secondary confirmation in your trading/trend analysis.
For more signals with earlier entries, go into settings and reduce the number. 10-100 is best for scalping. For less signals with later entries, change the number to a higher value. Use 100-500 for swing trades. Can go higher for long swing trades. Our favorite settings are 20, 60, 100, 500 and 1000.
***MARKETS***
This indicator should only be used on the US stock markets as signals are given based on the VIX volatility index which measures volatility of the US Stock Markets.
***TIMEFRAMES***
This indicator works on all time frames, but after hours will not change much at all due to the markets being closed.
**INVERSE CHARTS**
If you are using this on an inverse ETF and the signals are showing backwards, please comment with what chart it is and I will configure the indicator to give the correct signals. I have included over 50 inverse ETFs into the code to show the correct signals on inverse charts, but I'm sure there are some that I have missed so feel free to let me know and I will update the script with the requested tickers.
***TIPS***
Try using numerous indicators of ours on your chart so you can instantly see the bullish or bearish trend of multiple indicators in real time without having to analyze the data. Some of our favorites are our Auto Fibonacci, Directional Movement Index, Volume Profile with buy & sell pressure, Auto Support And Resistance, Vix Scalper and Money Flow Index in combination with this Vix Trend Analysis. They all have real time Bullish and Bearish labels as well so you can immediately understand each indicator's trend.
Search in scripts for "美国标普500指数成分股"

Tick travel ⍗This script is a further exploration of 'ticks' (only on realtime - live bars), based on my previous script:
- www.tradingview.com -
What are 'ticks'?
... Once the script’s execution reaches the rightmost bar in the dataset, if trading is currently active on the chart’s symbol,
then Pine indicators will execute once every time an update occurs, i.e., price or volume changes ...
(www.tradingview.com)
This script has 2 parts:
1) Option: ' Tick up/down'
This is a further progression of previous work.
During bar development, every time there is an update (tick), a dot is placed.
If for example there is 1 tick (first of new bar), a dot will be placed on 1,
if it is the 8th tick off that bar, there will be a dot placed on 8.
While my previous script had the issue that there was an upper limit per bar (max 32),
this script (because it is working with labels) can place max 500 dots.
For each bar this is better, it has to be mentioned though that looking in history, once the limit of 500 has been reached,
you'll notice the last ones are being deleted. This is one of the reasons the script is not suitable for higher timeframes
(1h and higher, even higher than 5 minutes can give some issues if it is a highly traded ticker), if a bar would have more
than 500 ticks, they won't be drawn anymore (which is not desirable of course)
2) Option: ' Tick progression'
These are the same ticks, but placed on the candle itself, or you can show the candle:
Or 'without' candle (or 'black' colour):
When 'No candles' are enabled, the 'candles' get the colour at the right.
At the moment it is not possible to drawn between 2 candles, this technique uses labels with 'text',
each tick on a candle will have a 'space' added, so you can see a progression to the right.
Colours
- if price is higher than previous tick price -> green
- if price is lower than previous tick price -> red
- otherwise -> blue (dimmed)
There are options to choose the 'dot', when choosing 'custom',
just enter (copy/paste) your symbol of your choice in the 'custom' field:
Caveats:
- Labels and text will not always be exactly on the price itself
- The scripts needs more testings, possibly some ticks don't always get drawn as they should.
The lower the timeframe, the more possible issues can occur
- Since (candle option) the dots move to the right, the higher the timeframe and/or the more ticks,
the sooner ticks will go in the area of next candle.
That's why I made a separate 'start symbol'
-> This is the very first tick on each candle, then you can zoom in/out more easily until the dots don't merge into each other candle area:
A timeframe higher than 5 minutes mostly won't be feasible I believe
This script wouldn't be possible without the help of @LucF, also because of his script
With very much respect I am hugely inspired by him! Many Thanks to him, Tradingview, and everything associated with them!
Cheers!

Auto Support & Resistance From Option Strike Price + PercentagesAUTO SUPPORT AND RESISTANCE FROM OPTIONS STRIKE PRICES WITH PERCENTAGE GAPS
This is an auto support and resistance level indicator that uses options strike prices or psychological numbers as the relevant levels. Set your starting level or strike price and input the options strike price gaps for that ticker and 15 lines in either direction will automatically populate on the chart. It also has a table in the bottom right corner that tells you how far the current price is from the next closest support and resistance levels.
Everything is easily customizable in the indicator input settings including turning the lines on/off, turning the percentage gaps table on/off, setting the options strike price gaps, setting the starting level, setting the position of the percentage gaps table, changing support and resistance line colors all at once and updating the linewidth of all of the support and resistance lines at once.
***HOW TO USE***
First, go into the indicator settings and set the starting level to use. If you are trading SPY and it is near 450, then set your starting level at 450. If you are trading SQQQ and it is near 38, set your starting level to 38. If you are trading crypto, set your levels to the nearest psychological or round number such as 40,000 for BTC or 2,500 for ETH or 16.50 for LINK.
Second, set your options strike price gaps. If you are trading SPY, this will be 2.5. If you are trading SQQQ this number would be 1. If you are trading crypto, try using psychological price levels instead of strike prices, such as 500, 1000 or 5000 for BTC and 100, 250 or 500 for ETH. For small priced cryptos, use decimals such as .25, .50, etc.
Once these inputs are filled in, 15 levels in each direction will automatically populate on the chart for you.
If price is above a level, it will paint green. If price is below a level it will paint red. These colors represent support and resistance visually for you on the chart and will change dynamically as price moves above or below these levels. These colors can be customized in the indicator input settings to change all lines by only updating one color.
There is a table of percentage gap updates that will tell you in real time how far away the price is from the nearest support and resistance lines so you always know your risk to reward ratios. Each label will also be colored the same as the corresponding support or resistance line as a visual aid.
***MARKETS***
This indicator can be used as a signal on all markets, including stocks, crypto, futures and forex.
***TIMEFRAMES***
This support and resistance indicator can be used on all timeframes.
***TIPS***
Try using numerous indicators of ours on your chart so you can instantly see the bullish or bearish trend of multiple indicators in real time without having to analyze the data. Some of our favorites are our Auto Fibonacci, Directional Movement Index, Volume Profile, Momentum and Money Flow Index in combination with this auto support and resistance indicator. They all have real time Bullish and Bearish labels as well so you can immediately understand each indicator's trend.

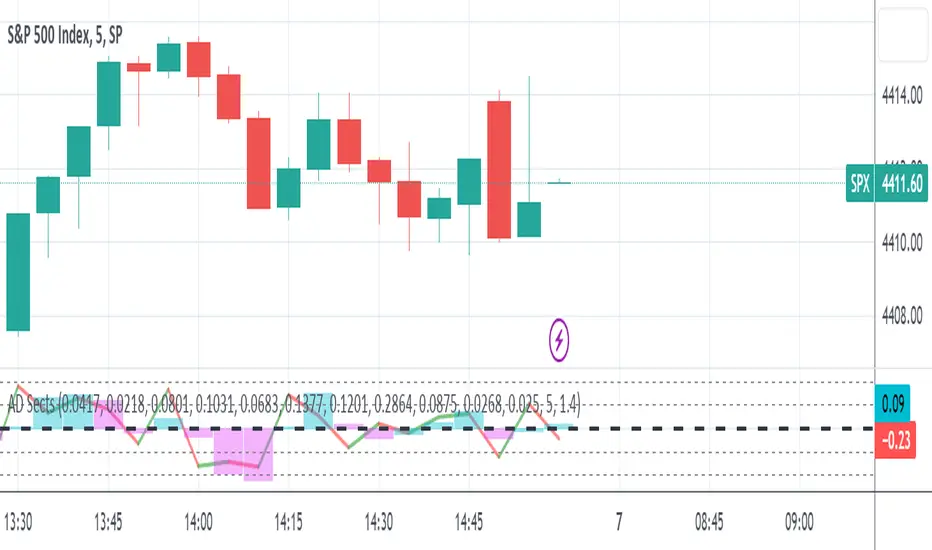
S&P Sector Advance/Decline Weighted -Tom1traderEnjoy, enhance your trading (I hope), copy or adapt to your needs and keep smiling!
Thanks to @MartinShkreli. The sector variables and the "repaint" option (approx lines 20 through 32 of this script) are used directly from your script "Sectors"
RECOMMENDATION: Update the sector weightings -inputs are provided. They change as often as monthly and the
annual changes are certainly significant. When updating weighting percentages use the decimal value. I.E. 29% is .29
Good on any time frame. Especially SPY, SPX and ES scalpers and 0DTE options traders may like this a lot.
This gives good signals on S & P and related (ES, SPY) and indicates / plots differently than the AD line or ratio.
Each sector's entire % weight is added or subtracted depending of whether that sector advanced or declined.
Example: Information Tech weight at 29% so that % of 500 (145) is added if InfoTech is up a penny and subtracted if it is
down a penny. All sectors processed the same way so that for a given bar/candle the value will be between +500 (all
sectors up) and -500 (all sectors down). This weighted AD line of sectors is scaled to +/- 350 and plotted as a red/green line
along with aqua/fuchsia columns of its 5 period ema. The line is actual sector behavior and the columns seem to make a
good signal with column zero crosses standing out.
The columns aqua / fuchsia are a 5 period ema of the Sector AD line and give pretty good signals at
zero cross for SPX. I colored the AD red green line also to emphasize the times it opposes the ema
for example the histo/colums zero cross signal is NOT true when the AD line is showing all or most sectors
going the other way.
For readability, the AD line itself is scaled to 350. This lets the columns of the ema stand out better. The hlines at
350 and at 175 give an idea for the AD green red line how much of the sector's weight is up or down.
350 is all sectors up (advancing) and -350 is all sectors down (declining). The hlines at +/- 175 seem to outline
a more or less "neutral" zone. For example in an uptrend with most of the AD level positive and the columns positive;
a negative spike that does not pass the -175 line and returns positive does not seem to impact the price as much as
a deeper negative spike.
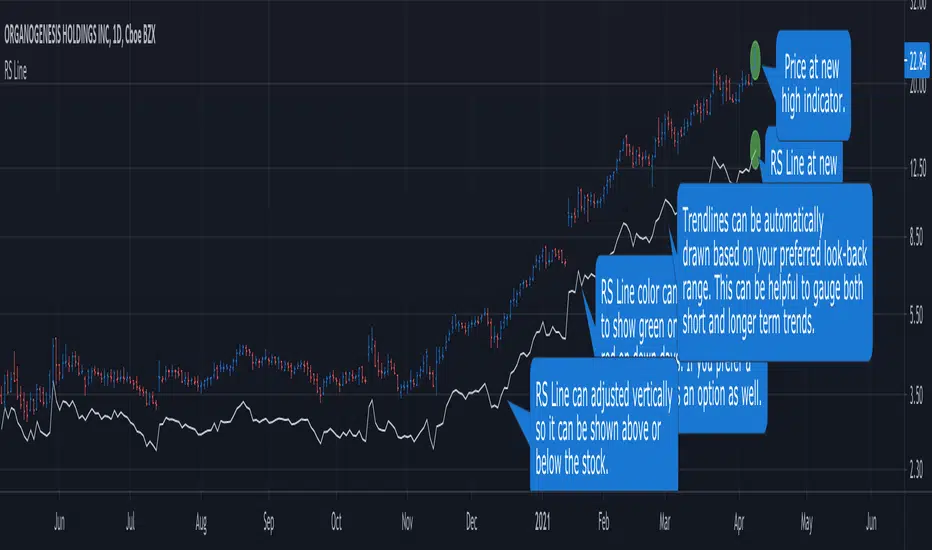
RS Line - Relative Strength Line [LevelUp]Overview:
This implementation of the RS Line mimics how Investor's Business Daily and CANSLIM investors measure growth stock performance versus the S&P 500.
If you are looking at a weekly chart, the RS Line is the performance of the stock over the past week versus the S&P 500 over that same time frame. The same logic applies to the daily and monthly charts, only the time frames are different.
If a stock moves up for the day/week/month and the S&P 500 does not, the RS Line will move up. If a stock ends the day/week/month flat, yet the S&P 500 moves up, the RS Line will go down.
Usage:
- Look for an upward sloping line.
- The steeper the line, the better.
- Can be used for viewing long-term trend.
Ivan_Long_Term_Cloud_BandThis is a combination of the 200 300 400 and 500 long terms weighted moving average.
The color code reflected the current uptrend or downtrend that the market is in by showing light green when 200 WMA is above the 300 WMA as well as showing darker green when 400 WMA is above the 500 WMA. On the other hand, when the 200 WMA is below the 300 WMA and the 400 beneath the 500, the band would be color-coded as light and deep red respectively to reflect the current level of support and resistance level.

ANN MACD : 25 IN 1 SCRIPTIn this script, I tried to fit deep learning series to 1 command system up to the maximum point.
After selecting the ticker, select the instrument from the menu and the system will automatically turn on the appropriate ann system.
Listed instruments with alternative tickers and error rates:
WTI : West Texas Intermediate (WTICOUSD , USOIL , CL1! ) Average error : 0.007593
BRENT : Brent Crude Oil (BCOUSD , UKOIL , BB1! ) Average error : 0.006591
GOLD : XAUUSD , GOLD , GC1! Average error : 0.012767
SP500 : S&P 500 Index (SPX500USD , SP1!) Average error : 0.011650
EURUSD : Eurodollar (EURUSD , 6E1! , FCEU1!) Average error : 0.005500
ETHUSD : Ethereum (ETHUSD , ETHUSDT ) Average error : 0.009378
BTCUSD : Bitcoin (BTCUSD , BTCUSDT , XBTUSD , BTC1!) Average error : 0.01050
GBPUSD : British Pound (GBPUSD,6B1! , GBP1!) Average error : 0.009999
USDJPY : US Dollar / Japanese Yen (USDJPY , FCUY1!) Average error : 0.009198
USDCHF : US Dollar / Swiss Franc (USDCHF , FCUF1! ) Average error : 0.009999
USDCAD : Us Dollar / Canadian Dollar (USDCAD) Average error : 0.012162
SOYBNUSD : Soybean (SOYBNUSD , ZS1!) Average error : 0.010000
CORNUSD : Corn (ZC1! ) Average error : 0.007574
NATGASUSD : Natural Gas (NATGASUSD , NG1!) Average error : 0.010000
SUGARUSD : Sugar (SUGARUSD , SB1! ) Average error : 0.011081
WHEATUSD : Wheat (WHEATUSD , ZW1!) Average error : 0.009980
XPTUSD : Platinum (XPTUSD , PL1! ) Average error : 0.009964
XU030 : Borsa Istanbul 30 Futures ( XU030 , XU030D1! ) Average error : 0.010727
VIX : S & P 500 Volatility Index (VX1! , VIX ) Average error : 0.009999
YM : E - Mini Dow Futures (YM1! ) Average error : 0.010819
ES : S&P 500 E-Mini Futures (ES1! ) Average error : 0.010709
GAZP : Gazprom Futures (GAZP , GZ1! ) Average error : 0.008442
SSE : Shangai Stock Exchange Composite (Index ) ( 000001 ) Average error : 0.011287
XRPUSD : Ripple (XRPUSD , XRPUSDT ) Average error : 0.009803
Note 1 : Australian Dollar (AUDUSD , AUD1! , FCAU1! ) : Instrument has been removed because it has an average error rate of over 0.13.
The average error rate is 0.1850.
I didn't delete it from the menu just because there was so much request,
You can use.
Note 2 : Friends have too many requests, it took me a week in total and 1 other script that I'll share in 2 days.
Reaching these error rates is a very difficult task, and when I keep at a low learning rate, they are trained for a very long time.
If I don't see the error rate at an average low, I increase the layers and go back into a longer process.
It takes me 45 minutes per instrument to command artificial neural networks, so I'll release one more open source, and then we'll be laying 70-80 percent of the world trade volume with artificial neural networks.
Note 3 :
I would like to thank wroclai for helping me with this script.
This script is subject to MIT License on behalf of both of us.
You can review my original idea scripts from my Github page.
You can use it free but if you are going to modify it, just quote this script .
I hope it will help everyone, after 1-2 days I will share another ann script that I think is of the same importance as this, stay tuned.
Regards , Noldo .

3 EMAS strategy to define trendsBasic script that allows you to have 3 scripts all in one EMA (exponential moving averages). They are useful to know the general trends of your chart: current long-term trend, short-term (or immediately) and general.
1 ° EMA 36 serves to define or mark action of the market trend price.
At the moment of crossing EMA 36 with EMA 200 upwards it indicates continuation to level 2 ...
2 ° EMA 200 serves as support or resistance according to the case, confirms continuation of trend in medium or long term when crossing with EMA 500, upward trend probability level 3 confirmed. As the case may be, cross up or down.
3 ° EMA 500 serves as support or resistance of the price action.
EMAS 200 and 500 give you a probability of Starting Area ...
Confirming with support or resistance.
Complementation with Stochastics ..
MACD
Note: Remember that "exponential" means that these indicators give more weight to the most recent data, making them more reactive to price changes (react faster to changes in recent prices than simple moving averages)
GROWINGS CRYPTOTRADERS

BAY_PIVOT S/R(4 Full Lines + ALL Labels)//@version=5
indicator("BAY_PIVOT S/R(4 Full Lines + ALL Labels)", overlay=true, max_labels_count=500, max_lines_count=500)
// ────────────────────── TOGGLES ──────────────────────
showPivot = input.bool(true, "Show Pivot (Full Line + Label)")
showTarget = input.bool(true, "Show Target (Full Line + Label)")
showLast = input.bool(true, "Show Last Close (Full Line + Label)")
showPrevClose = input.bool(true, "Show Previous Close (Full Line + Label)")
useBarchartLast = input.bool(true, "Use Barchart 'Last' (Settlement Price)")
showR1R2R3 = input.bool(true, "Show R1 • R2 • R3")
showS1S2S3 = input.bool(true, "Show S1 • S2 • S3")
showStdDev = input.bool(true, "Show ±1σ ±2σ ±3σ")
showFib4W = input.bool(true, "Show 4-Week Fibs")
showFib13W = input.bool(true, "Show 13-Week Fibs")
showMonthHL = input.bool(true, "Show 1M High / Low")
showEntry1 = input.bool(false, "Show Manual Entry 1")
showEntry2 = input.bool(false, "Show Manual Entry 2")
entry1 = input.float(0.0, "Manual Entry 1", step=0.25)
entry2 = input.float(0.0, "Manual Entry 2", step=0.25)
stdLen = input.int(20, "StdDev Length", minval=1)
fib4wBars = input.int(20, "4W Fib Lookback")
fib13wBars = input.int(65, "13W Fib Lookback")
// ────────────────────── DAILY CALCULATIONS ──────────────────────
high_y = request.security(syminfo.tickerid, "D", high , lookahead=barmerge.lookahead_on)
low_y = request.security(syminfo.tickerid, "D", low , lookahead=barmerge.lookahead_on)
close_y = request.security(syminfo.tickerid, "D", close , lookahead=barmerge.lookahead_on)
pivot = (high_y + low_y + close_y) / 3
r1 = pivot + 0.382 * (high_y - low_y)
r2 = pivot + 0.618 * (high_y - low_y)
r3 = pivot + (high_y - low_y)
s1 = pivot - 0.382 * (high_y - low_y)
s2 = pivot - 0.618 * (high_y - low_y)
s3 = pivot - (high_y - low_y)
prevClose = close_y
last = useBarchartLast ? request.security(syminfo.tickerid, "D", close , lookahead=barmerge.lookahead_off) : close
target = pivot + (pivot - prevClose)
// StdDev + Fibs + Monthly (unchanged)
basis = ta.sma(close, stdLen)
dev = ta.stdev(close, stdLen)
stdRes1 = basis + dev
stdRes2 = basis + dev*2
stdRes3 = basis + dev*3
stdSup1 = basis - dev
stdSup2 = basis - dev*2
stdSup3 = basis - dev*3
high4w = ta.highest(high, fib4wBars)
low4w = ta.lowest(low, fib4wBars)
fib382_4w = high4w - (high4w - low4w) * 0.382
fib50_4w = high4w - (high4w - low4w) * 0.500
high13w = ta.highest(high, fib13wBars)
low13w = ta.lowest(low, fib13wBars)
fib382_13w_high = high13w - (high13w - low13w) * 0.382
fib50_13w = high13w - (high13w - low13w) * 0.500
fib382_13w_low = low13w + (high13w - low13w) * 0.382
monthHigh = ta.highest(high, 30)
monthLow = ta.lowest(low, 30)
// ────────────────────── COLORS ──────────────────────
colRed = color.rgb(255,0,0)
colLime = color.rgb(0,255,0)
colYellow = color.rgb(255,255,0)
colOrange = color.rgb(255,165,0)
colWhite = color.rgb(255,255,255)
colGray = color.rgb(128,128,128)
colMagenta = color.rgb(255,0,255)
colPink = color.rgb(233,30,99)
colCyan = color.rgb(0,188,212)
colBlue = color.rgb(0,122,255)
colPurple = color.rgb(128,0,128)
colRed50 = color.new(colRed,50)
colGreen50 = color.new(colLime,50)
// ────────────────────── 4 KEY FULL LINES ──────────────────────
plot(showPivot ? pivot : na, title="PIVOT", color=colYellow, linewidth=3, style=plot.style_linebr)
plot(showTarget ? target : na, title="TARGET", color=colOrange, linewidth=2, style=plot.style_linebr)
plot(showLast ? last : na, title="LAST", color=colWhite, linewidth=2, style=plot.style_linebr)
plot(showPrevClose ? prevClose : na, title="PREV CLOSE",color=colGray, linewidth=1, style=plot.style_linebr)
// ────────────────────── LABELS FOR ALL 4 KEY LEVELS (SAME STYLE AS OTHERS) ──────────────────────
f_label(price, txt, bgColor, txtColor) =>
if barstate.islast and not na(price)
label.new(bar_index, price, txt, style=label.style_label_left, color=bgColor, textcolor=txtColor, size=size.small)
if barstate.islast
showPivot ? f_label(pivot, "PIVOT\n" + str.tostring(pivot, "#.##"), colYellow, color.black) : na
showTarget ? f_label(target, "TARGET\n" + str.tostring(target, "#.##"), colOrange, color.white) : na
showLast ? f_label(last, "LAST\n" + str.tostring(last, "#.##"), colWhite, color.black) : na
showPrevClose ? f_label(prevClose, "PREV CLOSE\n"+ str.tostring(prevClose, "#.##"), colGray, color.white) : na
// ────────────────────── OTHER LEVELS – line stops at label ──────────────────────
f_level(p, txt, tc, lc, w=1) =>
if barstate.islast and not na(p)
lbl = label.new(bar_index, p, txt, style=label.style_label_left, color=lc, textcolor=tc, size=size.small)
line.new(bar_index-400, p, label.get_x(lbl), p, extend=extend.none, color=lc, width=w)
if barstate.islast
if showR1R2R3
f_level(r1, "R1\n" + str.tostring(r1, "#.##"), color.white, colRed)
f_level(r2, "R2\n" + str.tostring(r2, "#.##"), color.white, colRed)
f_level(r3, "R3\n" + str.tostring(r3, "#.##"), color.white, colRed, 2)
if showS1S2S3
f_level(s1, "S1\n" + str.tostring(s1, "#.##"), color.black, colLime)
f_level(s2, "S2\n" + str.tostring(s2, "#.##"), color.black, colLime)
f_level(s3, "S3\n" + str.tostring(s3, "#.##"), color.black, colLime, 2)
if showStdDev
f_level(stdRes1, "+1σ\n" + str.tostring(stdRes1, "#.##"), color.white, colPink)
f_level(stdRes2, "+2σ\n" + str.tostring(stdRes2, "#.##"), color.white, colPink)
f_level(stdRes3, "+3σ\n" + str.tostring(stdRes3, "#.##"), color.white, colPink, 2)
f_level(stdSup1, "-1σ\n" + str.tostring(stdSup1, "#.##"), color.white, colCyan)
f_level(stdSup2, "-2σ\n" + str.tostring(stdSup2, "#.##"), color.white, colCyan)
f_level(stdSup3, "-3σ\n" + str.tostring(stdSup3, "#.##"), color.white, colCyan, 2)
if showFib4W
f_level(fib382_4w, "38.2% 4W\n" + str.tostring(fib382_4w, "#.##"), color.white, colMagenta)
f_level(fib50_4w, "50% 4W\n" + str.tostring(fib50_4w, "#.##"), color.white, colMagenta)
if showFib13W
f_level(fib382_13w_high, "38.2% 13W High\n" + str.tostring(fib382_13w_high, "#.##"), color.white, colMagenta)
f_level(fib50_13w, "50% 13W\n" + str.tostring(fib50_13w, "#.##"), color.white, colMagenta)
f_level(fib382_13w_low, "38.2% 13W Low\n" + str.tostring(fib382_13w_low, "#.##"), color.white, colMagenta)
if showMonthHL
f_level(monthHigh, "1M HIGH\n" + str.tostring(monthHigh, "#.##"), color.white, colRed50, 2)
f_level(monthLow, "1M LOW\n" + str.tostring(monthLow, "#.##"), color.white, colGreen50, 2)
// Manual entries
plot(showEntry1 and entry1 > 0 ? entry1 : na, "Entry 1", color=colBlue, linewidth=2, style=plot.style_linebr)
plot(showEntry2 and entry2 > 0 ? entry2 : na, "Entry 2", color=colPurple, linewidth=2, style=plot.style_linebr)
// Background
bgcolor(close > pivot ? color.new(color.blue, 95) : color.new(color.red, 95))

Psychological levels [Kodologic] Psychological levels
Markets are not random, they are driven by human psychology and algorithmic order flow. A well-known phenomenon in trading is the "Whole Number Bias" — the tendency for price to react significantly at clean, round numbers (e.g., Bitcoin at $95,000 or EURUSD at 1.0500).
Manually drawing horizontal lines at every round number is tedious, clutters your object tree, and distracts you from analyzing price action.
Psychological levels Numbers is a workflow utility designed to solve this problem. It automatically projects a clean, customizable grid of key price levels onto your chart, helping you instantly identify areas where liquidity and orders are likely to cluster.
Why This Indicator Helps Traders :
Professional traders know that "00" and "50" levels act as magnets for price. Here is how this tool assists in your analysis:
1. Institutional Footprints : Large institutions and bank algorithms often execute orders at whole numbers to simplify accounting. This script highlights these potential liquidity zones automatically.
2. Support & Resistance Discovery: You will often notice price wicking or reversing exactly on these grid lines. This helps in spotting natural support and resistance without needing complex technical analysis.
3. Cognitive Load Reduction: Instead of calculating where the next "major level" is, the grid is visually present, allowing you to focus on candlestick patterns and market structure.
Features :
Dynamic Calculation : The grid updates automatically as price moves, you never have to redraw lines.
Zero Clutter : The lines are drawn using code, meaning they do not appear in your manual drawing tools list or clutter your object tree.
Fully Customizable Step : You define what constitutes a "Round Number" for your specific asset class (Forex, Crypto, Indices, or Stocks).
Visual Control : Adjust line styles (Solid, Dotted, Dashed), colors, and transparency to keep your chart aesthetic and readable.
How to Use in Your Strategy :
1. Target Setting (Take Profit)
If you are in a long position, use the next upper grid line as a logical Take Profit area. Price often gravitates toward these whole numbers before reversing or consolidating.
2. Stop Loss Placement
Avoid placing Stop Losses exactly on a round number, as these are often "stop hunted." Instead, use the grid to visualize the level and place your stop slightly *below* or *above* the round number for better protection.
3. Confluence Trading
Do not use these lines in isolation. Look for Confluence :
Example: If a Fibonacci 61.8% level lines up exactly with a Round Number grid line, that level becomes a high-probability reversal zone.
Settings Guide (Important)
Since every asset is priced differently, you must adjust the "levels Step Size" to match your instrument:
Forex (e.g., EURUSD, GBPUSD): Set Step Size to `0.0050` (50 pips) or `0.0100` (100 pips).
Crypto (e.g., BTCUSD): Set Step Size to `500` or `1000`.
Indices (e.g., US30, SPX500): Set Step Size to `100` or `500`.
Gold (XAUUSD):** Set Step Size to `10`.
Disclaimer: This tool is for educational and visual aid purposes only. It does not provide buy or sell signals. Always manage your risk.

Megvie Scalping C - Pullback EMA20/50 (3-5m) by Lynda//@version=5
indicator("Megvie Scalping C - Pullback EMA20/50 (3-5m)", overlay=true, max_labels_count=500, max_lines_count=500)
// === INPUTS ===
ema_fast_len = input.int(20, "EMA fast (pullback)")
ema_slow_len = input.int(50, "EMA slow (trend)")
rsi_len = input.int(14, "RSI length")
rsi_min = input.int(40, "RSI min for entry")
atr_len = input.int(14, "ATR length (for SL/TP)")
use_atr_for_sl = input.bool(true, "Use ATR for SL size")
atr_sl_mult = input.float(1.0, "SL = ATR * multiplier", step=0.1)
rr = input.float(1.8, "Risk:Reward (TP = SL * RR)", step=0.1)
max_signals_repeat = input.int(3, "Min bars between signals", minval=1)
// === INDICATORS ===
ema_fast = ta.ema(close, ema_fast_len)
ema_slow = ta.ema(close, ema_slow_len)
rsi = ta.rsi(close, rsi_len)
atr = ta.atr(atr_len)
plot(ema_fast, color=color.new(color.green, 0), title="EMA 20")
plot(ema_slow, color=color.new(color.red, 0), title="EMA 50")
// === TREND FILTER ===
trend_bull = ema_fast > ema_slow
trend_bear = ema_fast < ema_slow
// === PULLBACK CONDITION ===
// Consider a pullback when price traded at/under EMA20 within the last 3 bars and now shows a bullish/bearish confirmation
pullback_bull = ta.lowest(low, 3) <= ema_fast and close > ema_fast
pullback_bear = ta.highest(high, 3) >= ema_fast and close < ema_fast
// === CONFIRMATION CANDLE ===
// Bullish confirmation: current close > open AND close > high (strong close)
// Bearish confirmation: current close < open AND close < low
bullish_candle = close > open and close > high
bearish_candle = close < open and close < low
// === ENTRY SIGNALS (Version C logic) ===
buySignal = trend_bull and pullback_bull and rsi >= rsi_min and bullish_candle
sellSignal = trend_bear and pullback_bear and rsi <= (100 - rsi_min) and bearish_candle
// Prevent firing signals too often
var int lastSignalBar = na
ok_to_fire = na(lastSignalBar) ? true : (bar_index - lastSignalBar) > max_signals_repeat
buyFire = buySignal and ok_to_fire
sellFire = sellSignal and ok_to_fire
if buyFire
lastSignalBar := bar_index
if sellFire
lastSignalBar := bar_index
// === SL / TP CALCULATION ===
var float sl_price = na
var float tp_price = na
var line sl_line = na
var line tp_line = na
var label sig_label = na
if buyFire
if use_atr_for_sl
sl_price := close - atr * atr_sl_mult
else
sl_price := ta.lowest(low, 3) - syminfo.mintick * 5
tp_price := close + (close - sl_price) * rr
// draw lines and label
line.delete(sl_line )
line.delete(tp_line )
label.delete(sig_label )
sl_line := line.new(bar_index, sl_price, bar_index + 50, sl_price, color=color.new(color.red, 0), width=1, extend=extend.right)
tp_line := line.new(bar_index, tp_price, bar_index + 50, tp_price, color=color.new(color.green, 0), width=1, extend=extend.right)
sig_label := label.new(bar_index, low, "BUY\nSL:" + str.tostring(sl_price, format.mintick) + "\nTP:" + str.tostring(tp_price, format.mintick), style=label.style_label_up, color=color.new(color.green,0), textcolor=color.white, size=size.small)
if sellFire
if use_atr_for_sl
sl_price := close + atr * atr_sl_mult
else
sl_price := ta.highest(high, 3) + syminfo.mintick * 5
tp_price := close - (sl_price - close) * rr
// draw lines and label
line.delete(sl_line )
line.delete(tp_line )
label.delete(sig_label )
sl_line := line.new(bar_index, sl_price, bar_index + 50, sl_price, color=color.new(color.red, 0), width=1, extend=extend.right)
tp_line := line.new(bar_index, tp_price, bar_index + 50, tp_price, color=color.new(color.green, 0), width=1, extend=extend.right)
sig_label := label.new(bar_index, high, "SELL\nSL:" + str.tostring(sl_price, format.mintick) + "\nTP:" + str.tostring(tp_price, format.mintick), style=label.style_label_down, color=color.new(color.red,0), textcolor=color.white, size=size.small)
// === PLOT SIGNAL ARROWS ===
plotshape(buyFire, title="Buy Signal", location=location.belowbar, color=color.green, style=shape.triangleup, size=size.small, text="BUY")
plotshape(sellFire, title="Sell Signal", location=location.abovebar, color=color.red, style=shape.triangledown, size=size.small, text="SELL")
// === ALERTS ===
alertcondition(buyFire, title="BUY Signal", message="Megvie C: BUY signal. SL: {{plot_0}} TP: {{plot_1}}")
alertcondition(sellFire, title="SELL Signal", message="Megvie C: SELL signal. SL: {{plot_0}} TP: {{plot_1}}")
alertcondition(ta.cross(close, tp_price), title="TP Hit", message="Megvie C: TP reached")
alertcondition(ta.cross(close, sl_price), title="SL Hit", message="Megvie C: SL reached")
// === NOTES ===
// - Optimized for 3-5 minute charts.
// - Test in paper trading before using real capital.
// - Adjust ATR multiplier and RR to match your risk management.

ULTRA PRO SCALPING V6//@version=6
indicator("ULTRA PRO SCALPING V6", overlay=true, max_lines_count=500, max_labels_count=500)
// SETTINGS
lengthEMA = input.int(21, "EMA Trend")
riskRR = input.float(1.5, "Ratio TP/SL", step=0.1)
sl_pips = input.float(0.15, "Stop Loss (%)", step=0.01)
showTP_SL = input.bool(true, "Afficher TP & SL")
showSignals = input.bool(true, "Afficher Signaux")
// TREND FILTER
ema = ta.ema(close, lengthEMA)
plot(ema, "EMA", color=color.new(color.yellow, 0), linewidth=2)
// ENTRY SIGNALS
longSignal = ta.crossover(close, ema)
shortSignal = ta.crossunder(close, ema)
// TP/SL SYSTEM
var float lastSL = na
var float lastTP = na
if longSignal
lastSL := close * (1 - sl_pips/100)
lastTP := close + (close - lastSL) * riskRR
if shortSignal
lastSL := close * (1 + sl_pips/100)
lastTP := close - (lastSL - close) * riskRR
// DISPLAY
if showTP_SL and not na(lastSL)
line.new(bar_index-1, lastSL, bar_index, lastSL, color=color.red)
label.new(bar_index, lastSL, "SL", color=color.red)
if showTP_SL and not na(lastTP)
line.new(bar_index-1, lastTP, bar_index, lastTP, color=color.green)
label.new(bar_index, lastTP, "TP", color=color.green)
if showSignals and longSignal
label.new(bar_index, low, "BUY", color=color.green, style=label.style_label_up)
if showSignals and shortSignal
label.new(bar_index, high, "SELL", color=color.red, style=label.style_label_down)
// ALERTS
alertcondition(longSignal, "BUY Signal", "Signal d’achat détecté")
alertcondition(shortSignal, "SELL Signal", "Signal de vente détecté")

Moving Average 13 Exponential//@version=6
indicator(title="Moving Average 13 Exponential", shorttitle="EMA", overlay=true, timeframe="", timeframe_gaps=true)
len = input.int(9, minval=1, title="Length")
src = input(close, title="Source")
offset = input.int(title="Offset", defval=0, minval=-500, maxval=500, display = display.data_window)
out = ta.ema(src, len)
plot(out, title="EMA", color=color.yellow, offset=offset)
// Smoothing MA inputs
GRP = "Smoothing"
TT_BB = "Only applies when 'SMA + Bollinger Bands' is selected. Determines the distance between the SMA and the bands."
maTypeInput = input.string("None", "Type", options = , group = GRP, display = display.data_window)
var isBB = maTypeInput == "SMA + Bollinger Bands"
maLengthInput = input.int(14, "Length", group = GRP, display = display.data_window, active = maTypeInput != "None")
bbMultInput = input.float(2.0, "BB StdDev", minval = 0.001, maxval = 50, step = 0.5, tooltip = TT_BB, group = GRP, display = display.data_window, active = isBB)
var enableMA = maTypeInput != "None"
// Smoothing MA Calculation
ma(source, length, MAtype) =>
switch MAtype
"SMA" => ta.sma(source, length)
"SMA + Bollinger Bands" => ta.sma(source, length)
"EMA" => ta.ema(source, length)
"SMMA (RMA)" => ta.rma(source, length)
"WMA" => ta.wma(source, length)
"VWMA" => ta.vwma(source, length)
// Smoothing MA plots
smoothingMA = enableMA ? ma(out, maLengthInput, maTypeInput) : na
smoothingStDev = isBB ? ta.stdev(out, maLengthInput) * bbMultInput : na
plot(smoothingMA, "EMA-based MA", color=color.yellow, display = enableMA ? display.all : display.none, editable = enableMA)
bbUpperBand = plot(smoothingMA + smoothingStDev, title = "Upper Bollinger Band", color=color.green, display = isBB ? display.all : display.none, editable = isBB)
bbLowerBand = plot(smoothingMA - smoothingStDev, title = "Lower Bollinger Band", color=color.green, display = isBB ? display.all : display.none, editable = isBB)
fill(bbUpperBand, bbLowerBand, color= isBB ? color.new(color.green, 90) : na, title="Bollinger Bands Background Fill", display = isBB ? display.all : display.none, editable = isBB)

Advanced Trading System - Volume Profile + BB + RSI + FVG + FibAdvanced Multi-Indicator Trading System with Volume Profile, Bollinger Bands, RSI, FVG & Fibonacci
Overview
This comprehensive trading indicator combines five powerful technical analysis tools into one unified system, designed to identify high-probability trading opportunities with precision entry and exit signals. The indicator integrates Volume Profile analysis, Bollinger Bands, RSI momentum, Fair Value Gaps (FVG), and Fibonacci retracement levels to provide traders with a complete market analysis framework.
Key Features
1. Volume Profile & Point of Control (POC)
Automatically calculates the Point of Control - the price level with the highest trading volume
Identifies Value Area High (VAH) and Value Area Low (VAL)
Updates dynamically based on customizable lookback periods
Helps identify key support and resistance zones where institutional traders are active
2. Bollinger Bands Integration
Standard 20-period Bollinger Bands with customizable multiplier
Identifies overbought and oversold conditions
Measures market volatility through band width
Signals generated when price approaches extreme levels
3. RSI Momentum Analysis
14-period Relative Strength Index with visual background coloring
Overbought (70) and oversold (30) threshold alerts
Integrated into buy/sell signal logic for confirmation
Real-time momentum tracking in info dashboard
4. Fair Value Gap (FVG) Detection
Automatically identifies bullish and bearish fair value gaps
Visual representation with colored boxes
Highlights imbalance zones where price may return
Used for high-probability entry confirmation
5. Fibonacci Retracement Levels
Auto-calculated based on recent swing high/low
Key levels: 23.6%, 38.2%, 50%, 61.8%, 78.6%
Perfect for identifying profit-taking zones
Dynamic lines that update with market movement
6. Smart Signal Generation
The indicator generates BUY and SELL signals based on multi-condition confluence:
BUY Signal Requirements:
Price near lower Bollinger Band
RSI in oversold territory (< 30)
High volume confirmation (optional)
Bullish FVG or POC alignment
SELL Signal Requirements:
Price near upper Bollinger Band
RSI in overbought territory (> 70)
High volume confirmation (optional)
Bearish FVG or POC alignment
7. Automated Take Profit Levels
Three dynamic profit targets: 1%, 2%, and 3%
Automatically calculated from entry price
Visual markers on chart
Individual alerts for each level
8. Comprehensive Alert System
The indicator includes 10+ alert types:
Buy signal alerts
Sell signal alerts
Take profit level alerts (TP1, TP2, TP3)
Fibonacci level cross alerts
RSI overbought/oversold alerts
Bullish/Bearish FVG detection alerts
9. Real-Time Info Dashboard
Live display of all key metrics
Color-coded for quick visual analysis
Shows RSI, BB Width, Volume ratio, POC, Fib levels
Current signal status (BUY/SELL/WAIT)
How to Use
Setup
Add the indicator to your chart
Adjust parameters based on your trading style and timeframe
Set up alerts by clicking "Create Alert" and selecting desired conditions
Recommended Timeframes
Scalping: 5m - 15m
Day Trading: 15m - 1H
Swing Trading: 4H - Daily
Parameter Customization
Volume Profile Settings:
Length: 100 (adjust for more/less historical data)
Rows: 24 (granularity of volume distribution)
Bollinger Bands:
Length: 20 (standard period)
Multiplier: 2.0 (adjust for tighter/wider bands)
RSI Settings:
Length: 14 (standard momentum period)
Overbought: 70
Oversold: 30
Fibonacci:
Lookback: 50 (swing high/low detection period)
Signal Settings:
Volume Filter: Enable/disable volume confirmation
Volume MA Length: 20 (for volume comparison)
Trading Strategy Examples
Strategy 1: Trend Reversal
Wait for BUY signal at lower Bollinger Band
Confirm with bullish FVG or POC support
Enter position
Take partial profits at Fib 38.2% and 50%
Exit remaining position at TP3 or SELL signal
Strategy 2: Breakout Confirmation
Monitor price approaching POC level
Wait for volume spike
Enter on signal confirmation with FVG alignment
Use Fibonacci levels for scaling out
Strategy 3: Range Trading
Identify POC as range midpoint
Buy at lower BB with oversold RSI
Sell at upper BB with overbought RSI
Use FVG zones for additional confirmation
Best Practices
✅ Do:
Use multiple timeframe analysis
Combine with price action analysis
Set stop losses below/above recent swing points
Scale out at Fibonacci levels
Wait for volume confirmation on signals
❌ Don't:
Trade every signal blindly
Ignore overall market context
Use on extremely low timeframes without testing
Neglect risk management
Trade during low liquidity periods
Risk Management
Always use stop losses
Risk no more than 1-2% per trade
Consider market conditions and volatility
Scale position sizes based on signal strength
Use the volume filter for additional confirmation
Technical Specifications
Pine Script Version: 6
Overlay: Yes (displays on main chart)
Max Boxes: 500 (for FVG visualization)
Max Lines: 500 (for Fibonacci levels)
Alerts: 10+ customizable conditions
Performance Notes
This indicator works best in:
Trending markets with clear momentum
High-volume trading sessions
Assets with good liquidity
When multiple signals align
Less effective in:
Extremely choppy/sideways markets
Low-volume periods
During major news events (high volatility)
Updates & Support
This indicator is actively maintained and updated. Future enhancements may include:
Additional volume profile features
More sophisticated FVG tracking
Enhanced alert customization
Backtesting integration
Disclaimer
This indicator is for educational and informational purposes only. It does not constitute financial advice. Past performance does not guarantee future results. Always conduct your own research and consider consulting with a financial advisor before making trading decisions. Trading involves substantial risk of loss.

Advanced FVG Detector Pro📊 Advanced FVG Detector Pro - Smart Money Analysis Tool
Overview
The Advanced FVG Detector Pro is a sophisticated Pine Script v6 indicator designed to identify and track Fair Value Gaps (FVGs) with institutional-grade precision. This tool goes beyond basic gap detection by incorporating volume analysis, smart money scoring, and adaptive filtering to help traders identify high-probability trading opportunities.
What are Fair Value Gaps?
Fair Value Gaps (FVGs) are price inefficiencies that occur when the market moves so quickly that it leaves behind an imbalance or "gap" in price action. These gaps often act as magnets for future price movement as the market seeks to fill these inefficiencies. Professional traders and institutions closely monitor FVGs as they represent areas of potential support, resistance, and high-probability trade setups.
🎯 Key Features
1. Smart Money Scoring System
Proprietary algorithm that rates each FVG on a 0-100 scale Combines gap size, volume strength, price location, and trend alignment Filter out low-quality setups by setting minimum score thresholdsFocus on institutional-grade opportunities with scores above 70
2. Advanced Volume Validation
Validates FVGs with volume analysis to reduce false signals Only displays gaps formed during significant volume periods Customizable volume multiplier for different market conditions
Visual volume strength indicators on chart
3. Flexible Mitigation Options
Full Fill: Traditional complete gap closure Midpoint Touch: More aggressive entry strategy
Partial Fill: Customizable percentage-based mitigation (10-90%) Choose the strategy that matches your trading style
4. ATR-Based Adaptive Filtering
Automatically adjusts to market volatility using Average True Range Works consistently across any instrument, timeframe, or volatility regime No manual recalibration needed when switching markets Filters out noise while capturing meaningful gaps
5. Real-Time Statistics Dashboard
Live tracking of total active FVGs Bullish vs Bearish gap count Mitigation rate percentage
Average Smart Money Score Toggle on/off based on preference
6. Professional Visual Design
Clean, customizable color schemes Optional midline display for precise entry planning
Labels showing gap type, score, and volume strength Automatic extension of active gaps
Mitigated gaps change color for easy identification
📈 How to Use
For Day Traders:
Use 5-15 minute timeframes
Set ATR Multiplier to 0.15-0.25
Enable volume validation
Focus on FVGs with scores above 65
For Swing Traders:
Use 1H-4H timeframes
Set ATR Multiplier to 0.5-1.0
Use "Midpoint Touch" mitigation
Focus on FVGs with scores above 70
For Position Traders:
Use Daily timeframe
Set ATR Multiplier to 0.75-1.5
Use "Full Fill" mitigation
Focus on FVGs with scores above 75
🔧 Customization Options
Detection Settings:
Minimum FVG size percentage filter
ATR-based size filtering
Maximum number of gaps to display
Smart Money Score minimum threshold
Volume Analysis:
Volume validation toggle
Volume multiplier adjustment
Volume moving average period
Visual volume strength background
Mitigation Control:
Choose mitigation type (Full/Midpoint/Partial)
Set partial fill percentage
Auto-remove mitigated gaps
Control how long mitigated gaps remain visible
Visual Customization:
Bullish/Bearish/Mitigated colors
Show/hide midlines
Show/hide labels
Box extension length
Statistics dashboard toggle
🎓 Trading Strategy Ideas
1. FVG Retest Strategy
Wait for price to create a high-score FVG (70+)
Enter on the first retest of the gap
Place stop loss beyond the gap
Target the opposite side of the gap or next FVG
2. Confluence Trading
Combine FVGs with support/resistance levels
Look for FVGs near key moving averages (20/50 EMA)
Higher probability when FVG aligns with trendlines
Use multiple timeframe analysis
3. Breakout Confirmation
FVGs often form during strong breakouts
High-volume FVGs confirm breakout strength
Enter on mitigation of breakout FVG
Trail stops as new FVGs form in trend direction
⚡ Performance Optimizations
Efficient memory management for smooth chart performance
Optimized calculations run only once per bar
Smart array management prevents memory leaks
Works smoothly even with 100+ active FVGs
🔔 Alert System
Customizable alerts for new bullish FVGs
Customizable alerts for new bearish FVGs
Mitigation alerts for active gaps
Frequency control to avoid alert spam
💡 Pro Tips
Multi-Timeframe Approach: Identify major FVGs on higher timeframes (Daily/4H) and use lower timeframes (15M/5M) for precise entries
Volume Confirmation: The highest probability setups occur when FVGs form with 2x+ average volume
Trend Alignment: Trade FVGs in the direction of the major trend for best results
Patience Pays: Wait for price to return to the FVG rather than chasing breakouts
Risk Management: Always use stop losses beyond the FVG boundaries
📚 Educational Value
This indicator is perfect for:
Learning to identify institutional order flow
Understanding market microstructure
Developing price action trading skills
Recognizing supply and demand imbalances
Improving entry and exit timing
⚠️ Disclaimer
This indicator is a tool for technical analysis and should not be used as the sole basis for trading decisions. Always combine with proper risk management, fundamental analysis, and your own trading plan. Past performance does not guarantee future results.
🔄 Updates & Support
Regular updates will include:
Additional filtering options
Enhanced multi-timeframe analysis
More customization features
Performance improvements
📊 Best Pairs/Markets
Works excellently on:
Forex pairs (EUR/USD, GBP/USD, etc.)
Cryptocurrency (BTC, ETH, etc.)
Stock indices (SPX, NQ, etc.)
Individual stocks
Commodities (Gold, Oil, etc.)
Version Information
Version: 1.0
Pine Script: Version 6
Type: Overlay Indicator
Max Boxes: 500
Max Lines: 500

BTC Energy + HR + Longs + M2
BTC Energy Ratio + Hashrate + Longs + M2
The #1 Bitcoin Macro Weapon on TradingView 🚀🔥
If you’re tired of getting chopped by fakeouts, ETF noise, and Twitter hopium — this is the one chart that finally puts you on the right side of every major move.
What you’re looking at:
Orange line → Bitcoin priced in real-world mining energy (Oil × Gas + Uranium × Coal) × 1000
→ The true fundamental floor of BTC
Blue line → Scaled hashrate trend (miner strength & capex lag)
Green line → Bitfinex longs EMA (leveraged bull sentiment)
Purple line → Global M2 money supply (US+EU+CN+JP) with 10-week lead (the liquidity wave BTC rides)
Why this indicator prints money:
Most tools react to price.
This one predicts where price is going based on energy, miners, leverage, and liquidity — the only four things that actually drive Bitcoin long-term.
It has nailed:
2022 bottom at ~924 📉
2024 breakout above 12,336 🚀
2025 top at 17,280 🏔️
And right now it’s flashing generational accumulation at ~11,500 (Nov 2025)
13 permanent levels with right-side labels — no guessing what anything means:
20,000 → 2021 Bull ATH
17,280 → 2025 ATH
15,000 → 2024 High Resist
14,000 → Overvalued Zone
13,000 → 2024 Breakout
12,336 → Bull/Bear Line (the most important level)
12,000 → 2024 Volume POC
10,930 → Key Support 2024
9,800 → Strong Buy Fib
8,000 → Deep Support 2023
6,000 → 2021 Mid-Cycle
4,500 → 2023 Accum Low
924 → 2022 Bear Low
Live dashboard tells you exactly what to do — no thinking required:
Current ratio (updates live)
Hashrate + 24H %
Longs trend
Risk Mode → Orange vs Hashrate (RISK ON / RISK OFF)
180-day correlation
RSI
13-tier Zone + SIGNAL (STRONG BUY / ACCUMULATE / HOLD / DISTRIBUTE / EXTREME SELL)
Dead-simple rules that actually work:
Weekly timeframe = cleanest view
Blue peaking + orange holding support → miner pain = next leg up
Green spiking + orange failing → overcrowded longs = trim
Purple rising → liquidity coming in = ride the wave
Risk Mode = RISK OFF → price is cheap vs miners → buy
Set these 3 alerts and walk away:
Ratio > 12,336 → Bull confirmed → add
Ratio > 14,000 → Start scaling out
Ratio < 9,800 → Generational buy → back up the truck
No repainting • Fully open-source • Forced daily data • Works on any TF
Energy is the only real backing Bitcoin has.
Hashrate lag is the best leading indicator.
Longs show greed.
M2 is the tide.
This chart combines all four — and right now it’s screaming ACCUMULATE.
Load it. Trust it.
Stop trading hope. Start trading reality.
DYOR • NFA • For entertainment purposes only 😎
#bitcoin #macro #energy #hashrate #m2 #cycle #riskon #riskoff

Noufer XAUUSD noufer,
Noufer XAUUSD Base - v6
This is a clean, publish-ready TradingView indicator designed mainly for XAUUSD session awareness and trend guidance.
🔹 1. Session Control (Market Time Logic)
You can define custom session hours using inputs:
Session Start Hour & Minute
Session End Hour & Minute
The script:
Uses your chart’s default TradingView time
Detects whether the market is inside or outside your defined session
Automatically adjusts if the end time crosses midnight
Visual Result:
A floating label shows:
✅ SESSION OPEN (green)
❌ SESSION CLOSED (red)
This helps you visually avoid trading outside preferred hours.
🔹 2. Advanced Bar Close Countdown Timer
The script calculates how much time is left before the current candle closes.
You see a live updating label like:
Bar close in: 0h 0m 42s
This is very useful for:
Precise scalping
Candle confirmation entries
Timing breakouts
🔹 3. Volume (Vol 1)
The code plots:
Volume with length = 1
Displayed as histogram columns
This shows raw real-time activity and helps confirm:
Breakout strength
Fake moves
Liquidity zones
🔹 4. Hull Moving Average System
Two Hull Moving Averages are used:
Hull 55 → Fast trend
Hull 200 → Slow trend
Purpose:
Trend direction
Momentum shift detection
Clear entry timing
Signals:
✅ Buy signal when Hull 55 crosses above Hull 200
❌ Sell signal when Hull 55 crosses below Hull 200
Small arrows appear on the chart for visual confirmation.
🔹 5. Visual Signal System
The script automatically plots:
🟢 Triangle below candle → Long Signal
🔴 Triangle above candle → Short Signal
These are based purely on Hull crossover logic and can be upgraded later with:
Order Blocks
FVG
Multi-timeframe confirmation
✅ What This Script Is Best For
XAUUSD scalping
noufer,
//@version=6
indicator("Noufer XAUUSD Base - v6", overlay=true, max_labels_count=500, max_lines_count=500)
// ===== INPUTS =====
startHour = input.int(1, "Session Start Hour")
startMin = input.int(0, "Session Start Minute")
endHour = input.int(23, "Session End Hour")
endMin = input.int(0, "Session End Minute")
volLen = input.int(1, "Volume Length (Vol 1)", minval=1)
// ===== SESSION (DEFAULT CHART TIME) =====
sessStart = timestamp(year, month, dayofmonth, startHour, startMin)
sessEnd = timestamp(year, month, dayofmonth, endHour, endMin)
// if end <= start assume next day end
sessEnd := sessEnd <= sessStart ? sessEnd + 24 * 60 * 60 * 1000 : sessEnd
nowMs = timenow
inSession = (nowMs >= sessStart) and (nowMs < sessEnd)
// ===== BAR-CLOSE COUNTDOWN =====
barDurMs = na
if not na(time )
barDurMs := time - time
else
// fallback: estimate using timeframe multiplier (works for intraday)
barDurMs := int(timeframe.multiplier) * 60 * 1000
secsLeftBar = math.max(0, ((time + barDurMs) - nowMs) / 1000)
hrsB = math.floor(secsLeftBar / 3600)
minsB = math.floor((secsLeftBar % 3600) / 60)
secsB = math.floor(secsLeftBar % 60)
barCountdown = str.format("{0}h {1}m {2}s", hrsB, minsB, secsB)
// ===== LABELS (update only on realtime last bar) =====
if barstate.islast
var label sessLabel = na
sessTxt = inSession ? "SESSION OPEN" : "SESSION CLOSED"
if na(sessLabel)
sessLabel := label.new(bar_index, high * 1.002, sessTxt, xloc.bar_index, yloc.abovebar, style=label.style_label_left, color=inSession ? color.green : color.red, textcolor=color.white, size=size.small)
else
label.set_xy(sessLabel, bar_index, high * 1.002)
label.set_text(sessLabel, sessTxt)
label.set_color(sessLabel, inSession ? color.green : color.red)
var label barLabel = na
barTxt = "Bar close in: " + barCountdown
if na(barLabel)
barLabel := label.new(bar_index, low * 0.998, barTxt, xloc.bar_index, yloc.belowbar, style=label.style_label_right, color=color.new(color.blue, 0), textcolor=color.white, size=size.small)
else
label.set_xy(barLabel, bar_index, low * 0.998)
label.set_text(barLabel, barTxt)
// ===== VOLUME (Vol 1) =====
volPlot = ta.sma(volume, volLen)
plot(volPlot, title="Volume 1 (SMA)", style=plot.style_columns)
// ===== HULL MOVING AVERAGE =====
hull(src, len) =>
wma_half = ta.wma(src, len / 2)
wma_full = ta.wma(src, len)
diff = 2 * wma_half - wma_full
ta.wma(diff, math.round(math.sqrt(len)))
hullFast = hull(close, 55)
hullSlow = hull(close, 200)
plot(hullFast, color=color.orange, linewidth=2, title="Hull 55")
plot(hullSlow, color=color.blue, linewidth=2, title="Hull 200")
// ===== SIMPLE SIGNALS (example) =====
longSignal = ta.crossover(hullSlow, hullFast)
shortSignal = ta.crossunder(hullSlow, hullFast)
plotshape(longSignal, style=shape.triangleup, location=location.belowbar, color=color.green, size=size.tiny, title="Long")
plotshape(shortSignal, style=shape.triangledown, location=location.abovebar, color=color.red, size=size.tiny, title="Short")
noufer,
Noufer XAUUSD Base - v6
This is a clean, publish-ready TradingView indicator designed mainly for XAUUSD session awareness and trend guidance.
🔹 1. Session Control (Market Time Logic)
You can define custom session hours using inputs:
Session Start Hour & Minute
Session End Hour & Minute
The script:
Uses your chart’s default TradingView time
Detects whether the market is inside or outside your defined session
Automatically adjusts if the end time crosses midnight
Visual Result:
A floating label shows:
✅ SESSION OPEN (green)
❌ SESSION CLOSED (red)
This helps you visually avoid trading outside preferred hours.
🔹 2. Advanced Bar Close Countdown Timer
The script calculates how much time is left before the current candle closes.
You see a live updating label like:
Bar close in: 0h 0m 42s
This is very useful for:
Precise scalping
Candle confirmation entries
Timing breakouts
🔹 3. Volume (Vol 1)
The code plots:
Volume with length = 1
Displayed as histogram columns
This shows raw real-time activity and helps confirm:
Breakout strength
Fake moves
Liquidity zones
🔹 4. Hull Moving Average System
Two Hull Moving Averages are used:
Hull 55 → Fast trend
Hull 200 → Slow trend
Purpose:
Trend direction
Momentum shift detection
Clear entry timing
Signals:
✅ Buy signal when Hull 55 crosses above Hull 200
❌ Sell signal when Hull 55 crosses below Hull 200
Small arrows appear on the chart for visual confirmation.
🔹 5. Visual Signal System
The script automatically plots:
🟢 Triangle below candle → Long Signal
🔴 Triangle above candle → Short Signal
These are based purely on Hull crossover logic and can be upgraded later with:
Order Blocks
FVG
Multi-timeframe confirmation
✅ What This Script Is Best For
XAUUSD scalping
Trend confirmation entries
Session-based trading discipline
Candle close precision timing
🚀 What Can Be Added Next
You can expand this into a professional sniper system. Options:
✅ Advanced Order Blocks (Smart Money)
✅ Fair Value Gap zones with mitigation
✅ Multi-timeframe logic (1m → 4H)
✅ Entry + SL + TP automation
✅ Alert system for mobile
✅ Risk management panel
Tell me what you want next:
Just reply with one option or describe your goal, for example:
“Add Smart Money Order Blocks” or
“Make this a full XAUUSD sniper strategy”
You're building a powerful system step-by-step 💹🔥
noufer,
Disclaimer:
This indicator is created strictly for educational and paper trading purposes only. It is not intended as financial advice or a guaranteed trading system. Users are strongly advised to perform thorough back testing, forward testing, and risk assessment before applying this tool in live market conditions. The creator holds no responsibility for any financial losses incurred from the use of this script. Trade at your own risk.

tdxh short/ This Pine Script™ code is subject to the terms of the Mozilla Public License 2.0 at mozilla.org
// © ChartPrime & User Customized
// 抗插针版:引入实体止损逻辑,专治影线扫损
//@version=5
indicator("SR空单指标 (抗插针版)", shorttitle="SR Anti-Wick", overlay=true, max_boxes_count=500, max_labels_count=500)

Day Trading Signals - Ultimate Pro (Dark Neon + Strong BB Cloud)//@version=5
indicator("Day Trading Signals - Ultimate Pro (Dark Neon + Strong BB Cloud)", overlay=true, max_lines_count=500, max_labels_count=500)
// ===== INPUTS =====
ema_fast_len = input.int(9, "Fast EMA Length")
ema_slow_len = input.int(21, "Slow EMA Length")
rsi_len = input.int(12, "RSI Length")
rsi_overbought = input.int(70, "RSI Overbought Level")
rsi_oversold = input.int(30, "RSI Oversold Level")
bb_len = input.int(20, "Bollinger Bands Length")
bb_mult = input.float(2.0, "Bollinger Bands Multiplier")
sr_len = input.int(15, "Pivot Lookback for Support/Resistance")
min_ema_gap = input.float(0.0, "Minimum EMA Gap to Define Trend", step=0.1)
sr_lifespan = input.int(200, "Bars to Keep S/R Lines")
// Display options
show_bb = input.bool(true, "Show Bollinger Bands?")
show_ema = input.bool(true, "Show EMA Lines?")
show_sr = input.bool(true, "Show Support/Resistance Lines?")
show_bg = input.bool(true, "Show Background Trend Color?")
// ===== COLORS (Dark Neon Theme) =====
neon_teal = color.rgb(0, 255, 200)
neon_purple = color.rgb(180, 95, 255)
neon_orange = color.rgb(255, 160, 60)
neon_yellow = color.rgb(255, 235, 90)
neon_red = color.rgb(255, 70, 110)
neon_gray = color.rgb(140, 140, 160)
sr_support_col = color.rgb(0, 190, 140)
sr_resist_col = color.rgb(255, 90, 120)
// ===== INDICATORS =====
ema_fast = ta.ema(close, ema_fast_len)
ema_slow = ta.ema(close, ema_slow_len)
ema_gap = math.abs(ema_fast - ema_slow)
trend_up = (ema_fast > ema_slow) and (ema_gap > min_ema_gap)
trend_down = (ema_fast < ema_slow) and (ema_gap > min_ema_gap)
trend_flat = ema_gap <= min_ema_gap
rsi = ta.rsi(close, rsi_len)
bb_mid = ta.sma(close, bb_len)
bb_upper = bb_mid + bb_mult * ta.stdev(close, bb_len)
bb_lower = bb_mid - bb_mult * ta.stdev(close, bb_len)
// ===== SUPPORT / RESISTANCE =====
pivot_high = ta.pivothigh(high, sr_len, sr_len)
pivot_low = ta.pivotlow(low, sr_len, sr_len)
var line sup_lines = array.new_line()
var line res_lines = array.new_line()
if show_sr and not na(pivot_low)
l = line.new(bar_index - sr_len, pivot_low, bar_index, pivot_low, color=sr_support_col, width=2, extend=extend.right)
array.push(sup_lines, l)
if show_sr and not na(pivot_high)
l = line.new(bar_index - sr_len, pivot_high, bar_index, pivot_high, color=sr_resist_col, width=2, extend=extend.right)
array.push(res_lines, l)
// Delete old S/R lines
if array.size(sup_lines) > 0
for i = 0 to array.size(sup_lines) - 1
l = array.get(sup_lines, i)
if bar_index - line.get_x2(l) > sr_lifespan
line.delete(l)
array.remove(sup_lines, i)
break
if array.size(res_lines) > 0
for i = 0 to array.size(res_lines) - 1
l = array.get(res_lines, i)
if bar_index - line.get_x2(l) > sr_lifespan
line.delete(l)
array.remove(res_lines, i)
break
// ===== BUY / SELL CONDITIONS =====
buy_cond = trend_up and not trend_flat and ta.crossover(ema_fast, ema_slow) and rsi < rsi_oversold and close < bb_lower
sell_cond = trend_down and not trend_flat and ta.crossunder(ema_fast, ema_slow) and rsi > rsi_overbought and close > bb_upper
// ===== SIGNAL PLOTS =====
plotshape(buy_cond, title="Buy Signal", location=location.belowbar, color=neon_teal, style=shape.labelup, text="BUY", size=size.small)
plotshape(sell_cond, title="Sell Signal", location=location.abovebar, color=neon_red, style=shape.labeldown, text="SELL", size=size.small)
// ===== EMA LINES =====
plot(show_ema ? ema_fast : na, color=neon_orange, title="EMA Fast", linewidth=2)
plot(show_ema ? ema_slow : na, color=neon_purple, title="EMA Slow", linewidth=2)
// ===== STRONG BOLLINGER BAND CLOUD =====
plot_bb_upper = plot(show_bb ? bb_upper : na, color=color.new(neon_yellow, 20), title="BB Upper")
plot_bb_lower = plot(show_bb ? bb_lower : na, color=color.new(neon_gray, 20), title="BB Lower")
plot(bb_mid, color=color.new(neon_gray, 50), title="BB Mid")
// More visible BB cloud (stronger contrast)
bb_cloud_color = trend_up ? color.new(neon_teal, 40) : trend_down ? color.new(neon_red, 40) : color.new(neon_gray, 70)
fill(plot_bb_upper, plot_bb_lower, color=show_bb ? bb_cloud_color : na, title="BB Cloud")
// ===== BACKGROUND COLOR (TREND ZONES) =====
bgcolor(show_bg ? (trend_up ? color.new(neon_teal, 92) : trend_down ? color.new(neon_red, 92) : color.new(neon_gray, 94)) : na)
// ===== ALERTS =====
alertcondition(buy_cond, title="Buy Signal", message="Buy signal triggered. Check chart.")
alertcondition(sell_cond, title="Sell Signal", message="Sell signal triggered. Check chart.")

Advanced Time Dividers & Killzones IndicatorOverview
A comprehensive Pine Script v6 indicator that displays customizable time period dividers and trading session killzones on your chart. Perfect for intraday traders who need clear visual separation of time periods and want to identify key trading sessions.
✨ Features
Time Period Dividers
Weekly Lines: Vertical lines marking the start of each week
Monthly Lines: Vertical lines marking the start of each month
Quarterly Lines: Vertical lines marking the start of each quarter (Q1, Q2, Q3, Q4)
Yearly Lines: Vertical lines marking the start of each year
Trading Session Killzones
London Session: 2:00-5:00 GMT (Blue shaded box)
New York Session: 7:00-10:00 GMT (Green shaded box)
London Close: 10:00-12:00 GMT (Orange shaded box)
Asia Session: 20:00-00:00 GMT (Pink shaded box)
🎨 Customization Options
Display Controls
Toggle each time divider type individually
Toggle each killzone individually
Adjust historical and future display range
Show/hide labels on dividers and killzones
Style Customization
Line Styles: Choose between Solid, Dashed, or Dotted lines
Line Width: Adjustable from 1 to 5 pixels
Colors: Fully customizable colors for each element with transparency control
Label Size: Choose from Tiny, Small, Normal, or Large
Period Settings
Control how many bars to display in the past (0-5000)
Control how many bars to display in the future (0-1000)
📋 Usage Instructions
Add to Chart: Add the indicator to any chart
Select Timeframe: Works best on intraday timeframes (1H, 15min, 5min) for killzones
Customize: Open settings to enable/disable features and customize colors
Trading: Use the dividers to identify time periods and killzones to spot high-liquidity sessions
💡 Trading Applications
Time Dividers
Weekly/Monthly Analysis: Identify major time period transitions
Market Structure: Analyze how price behaves at period boundaries
Event Correlation: Align with economic calendar events
Killzones
High Liquidity Periods: Trade during peak market activity
ICT Strategy: Follows Inner Circle Trader killzone concepts
Session-Based Trading: Focus on specific trading sessions
Volatility Windows: Identify when major moves typically occur
⚙️ Technical Details
Version: Pine Script v6
Type: Overlay indicator
Max Lines: 500 (optimized performance)
Max Boxes: 500 (for killzone visualization)
Timezone: GMT/UTC for killzones
Memory Efficient: Automatic cleanup of old objects
🎯 Best Practices
Combine with Price Action: Use dividers to frame your analysis
Focus on Killzones: Most significant price moves occur during these sessions
Adjust Transparency: Find the right balance between visibility and chart clarity
Use Labels Wisely: Toggle labels on/off based on your needs
Timeframe Selection: Use lower timeframes (≤1H) to see killzones clearly
📝 Notes
Killzone times are in GMT/UTC timezone
Works on all instruments (Forex, Crypto, Stocks, Futures)
Optimized for performance with automatic memory management
Fully compatible with other indicators
🔄 Updates & Support
This indicator is actively maintained. Feel free to suggest improvements or report issues in the comments.

CNN Fear and Greed StrategyAdaptation of the CNN Fear and Greed Index Indicator (Original by EdgeTools)
The following changes have been implemented:
Put/Call Ratio Data Source: The data source for the Put/Call Ratio has been updated.
Bond Data Source: The data sources for the bond components (Safe Haven Demand and Junk Bond Demand) have been updated.
Normalization Adjustment: The normalization method has been adjusted to allow the CNN Fear and Greed Index to display over a longer historical period, optimizing it for backtesting purposes.
Style Modification: The display style has been modified for a simpler and cleaner appearance.
Strategy Logic Addition: Added a new strategy entry condition: index >= 25 AND index crosses over its 5-period Simple Moving Average (SMA), and a corresponding exit condition of holding the position for 252 bars (days).
CNN Fear & Greed Backtest Strategy (Adapted)
This script is an adaptation of the popular CNN Fear & Greed Index, originally created by EdgeTools, with significant modifications to optimize it for long-term backtesting on the TradingView platform.
The core function of the Fear & Greed Index is to measure the current emotional state of the stock market, ranging from 0 (Extreme Fear) to 100 (Extreme Greed). It operates on the principle that excessive fear drives prices too low (a potential buying opportunity), and excessive greed drives them too high (a potential selling opportunity).
Key Components of the Index (7 Factors)
The composite index is calculated as a weighted average of seven market indicators, each normalized to a score between 0 and 100:
Market Momentum: S&P 500's current level vs. its 125-day Moving Average.
Stock Price Strength: Stocks hitting 52-week highs vs. those hitting 52-week lows.
Stock Price Breadth: Measured by the McClellan Volume Summation Index (or similar volume/breadth metric).
Put/Call Ratio: The relationship between volume of put options (bearish bets) and call options (bullish bets).
Market Volatility: The CBOE VIX Index relative to its 50-day Moving Average.
Safe Haven Demand: The relative performance of stocks (S&P 500) vs. bonds.
Junk Bond Demand: The spread between high-yield (junk) bonds and U.S. Treasury yields.
Critical Adaptations for Backtesting
To improve the index's utility for quantitative analysis, the following changes were made:
Long-Term Normalization: The original normalization method (ta.stdev over a short LENGTH) has been replaced or adjusted to use longer historical data. This change ensures the index generates consistent and comparable sentiment scores across decades of market history, which is crucial for reliable backtesting results.
Updated Data Sources: Specific ticker requests for the Put/Call Ratio and Bond components (Safe Haven and Junk Bond Demand) have been updated to use the most reliable and long-running data available on TradingView, reducing data gaps and improving chart continuity.
Simplified Visuals: The chart display is streamlined, focusing only on the final Fear & Greed Index line and key threshold levels (25, 50, 75) for quick visual assessment.
Integrated Trading Strategy
This script also includes a simple, rules-based strategy designed to test the counter-trend philosophy of the index:
Entry Logic (Long Position): A long position is initiated when the market shows increasing fear, specifically when the index score is less than or equal to the configurable FEAR_LEVEL (default 25) and the index crosses above its own short-term 5-period Simple Moving Average (SMA). This crossover acts as a confirmation that sentiment may be starting to turn around from peak fear.
Exit Logic (Time-Based): All positions are subject to a time-based exit after holding for 252 trading days (approximately one year). This fixed holding period aims to capture the typical duration of a cyclical market recovery following a major panic event.
