Trend Type Indicator by BobRivera990Usage:
The purpose of this indicator is to programmatically determine the type of price trend using technical analysis tools.
You can do a quick check on the asset’s higher and lower time frames. For example, if you are trading on an H1 chart, you can check the m5 chart to ensure that the trend is in the same direction and similarly check the H4 chart to ensure that the higher time frame price is also moving in the same direction.
If multiple time frame charts confirm a similar trend, then it is considered a very strong trend and ideal for Trend trading.
Remarks:
By default, the last status is related to 8 periods before the latest closing price.
Related definitions:
The three basic types of trends are up, down, and sideways.
1. Uptrend
An uptrend describes the price movement of a financial asset when the overall direction is upward. The uptrend is composed of higher swing lows and higher swing highs.
Some market participants ("long" trend traders) only choose to trade during uptrends.
2. Downtrend
A downtrend refers to the price action of a security that moves lower in price as it fluctuates over time.
The downtrend is composed of lower swing lows and lower swing highs.
3. Sideways
A sideways trend is the horizontal price movement that occurs when the forces of supply and demand are nearly equal. This typically occurs during a period of consolidation before the price continues a prior trend or reverses into a new trend.
How it works:
Step 1: Sideways Trend Detection
In this step we want to distinguish the sideways trend from uptrend and downtrend. For this purpose, we use two common technical analysis tools: ATR and ADX
1. Average True Range (ATR)
The average true range (ATR) is a technical analysis indicator that measures market volatility.
We also use a 20-period moving average of the ATR.
When the ATR is below the average of its last 20-periods, it means that the rate of price volatility has decreased and we conclude that the current trend is sideways
2. Average Directional Index (ADX)
The average directional index (ADX) is a technical analysis indicator used by some traders to determine the strength of a trend.
The trend has strength when ADX is above 25.
So when the ADX is less than or equal to 25, there is no strong trend, and we conclude that the current type of trend is sideways.
Step 2: Detect uptrend from downtrend
If it turns out that the current price trend is not sideways, then it is either uptrend or downtrend.
For this purpose, we use plus and minus directional Indicators (+ DI & -DI).
A general interpretation would be that during a strong trend, when +DI is higher than -DI, it is an uptrend. When -DI is higher than +DI, it is a downtrend.
Parameters:
"Use ATR …" ________________________// Use Average True Range (ATR) to detect Sideways Movements
"ATR Length"_______________________ // length of the Average True Range (ATR) used to detect Sideways Movements
"ATR Moving Average Type" ___________// Type of the moving average of the ATR used to detect Sideways Movements
"ATR MA Length" ____________________// length of the moving average of the ATR used to detect Sideways Movements
"Use ADX ..."_______________________ // Use Average Directional Index (ADX) to detect Sideways Movements
"ADX Smoothing”____________________// length of the Average Directional Index (ADX) used to detect Sideways Movements
"DI Length"_________________________// length of the Plus and Minus Directional Indicators (+DI & -DI) used to determine the direction of the trend
"ADX Limit" ________________________// A level of ADX used as the boundary between Trend Market and Sideways Market
"Smoothing Factor"__________________// Factor used for smoothing the oscillator
"Lag"______________________________// lag used to match indicator and chart
Resources:
www.investopedia.com
Search in scripts for "美联储9月降息25个基点"

MA Crossover Strategy with MA Turning Point Exits + ADX filterThis strategy is based upon @rthomson's MA Crossover Strategy with MA Turning Point Exits.
I just added an ability to filter out entries when ADX < 20. In fact you have a choice to set this ADX threshold value.
In a sideways market, the MA crossovers end up in yielding entry trades with losses. ADX value around 20 to 25 indicates a sideway market. By introducing ADX threshold, we are trying to prevent potential loss making entries.

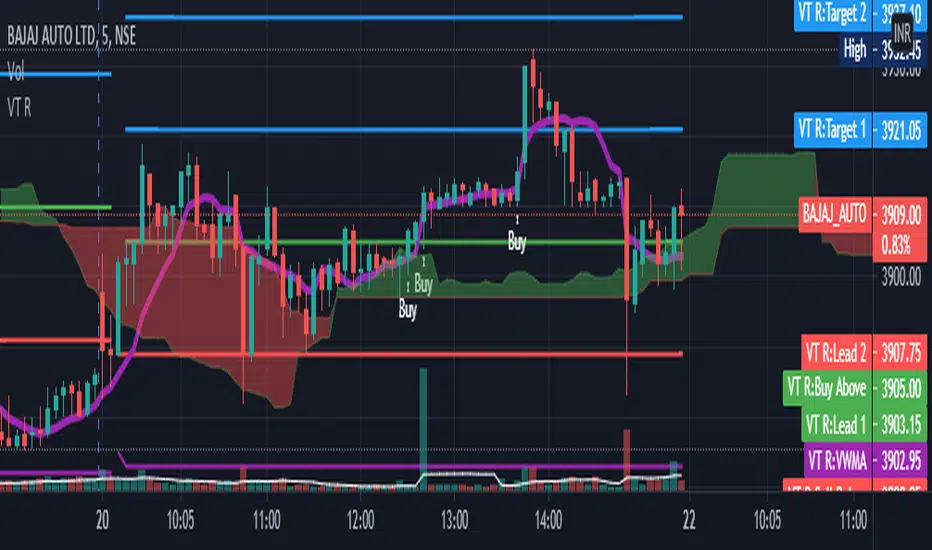
VT R Cloudsettings for the VT R Indicator
VT R TIme (Minues) = 10
Session Time = 09:25 - 09:35
Show VT R Ticked
Show VWMA Ticked
VWMA Period = 10
Long Trade Rules
1. Close ABove buy above
2. trade above ma
3. volume > ma (volume Settings Given Below)
4. sl below sell below
Short Trade Rules
1. close below sell below
2. trade below ma
3. volume > ma (volume Settings Given Below)
4. sl above buy above
Volume Indicator has to be added manually i suggest to use the default Volume Indicator
Settings for the Volume Indicator
Lookback = 10
ShowMA Ticked
LengthMA = 10
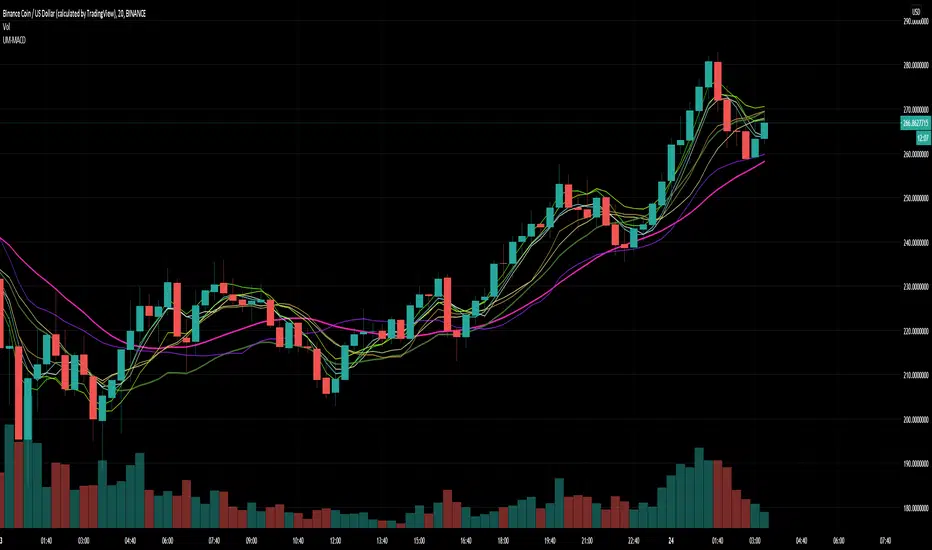
EMA RainbowBased on Ripsters EMA clouds, this :
adds an 6 section EMA rainbow to act as DYNAMIC support and resistance levels, that you never have to set manually
splits the 5-12 cloud into 2 parts, as opposed to using a 8-9 centerline. More visually pleasing and intuitive to use
When 300 cloud and 25 cloud are both bullish or bearish - look to take positions in that direction
Use 5 cloud to find pullbacks for entry points
When cloud is moving away (diverging) from other clouds - momentum is increasing
When cloud is increasing in diameter (expanding) - momentum is increasing
When cloud is moving towards other clouds (converging) - momentum is increasing
When cloud is decreasing in diameter (contracting) - momentum is increasing

RedK Trader Pressure Index (TPX v1.0) Quick Summary
---------------------
The RedK Trader Pressure Index (REDK_TPX) analyzes the changes in price bars to give the trader a clear visual insight that represents the ongoing fight between the bulls (buyers) and bears (sellers) in the market - to determine who is in control of the price action, which in turn can be helpful in a trader’s decision about how the price action may be unfolding, what type of trade and positions to take (or to close) and when is the ideal time to action.
How the TPX calculation works
---------------------------------------
The TPX uses a simple logic and that’s one of the things I like about it – there is no complex calculation or magic stuff - and the core idea makes sense to me, as well as being one of the ways I needed to analyze my price charts.
The underlying assumption is that the buyers and sellers are competing for control of the market at all time.
- if there’s more buyers than sellers in the market, and if the buyers’ (or bull) pressure is stronger (than the sellers’), they will be able pull the “price range” up – and that means that on the price chart we can expect to see an increase in value in both the “high” and the “low” of the next price bar.
- Similarly, if there’s more sellers than buyers in the market, and if the sellers’ (or bear) pressure is stronger (than the buyers’), they will be able push the “price range” down – on the price chart we can expect to see a decrease in value in both the “high” and the “low” of the next price bar.
So, we will use the change in high and low price, between 2 consecutive price bars, as a proxy for the bull and bear “pressures” – a (weighted) moving average of these “pressure” values are then calculated along with the “Net Pressure” – the final results are plotted.
The importance of the "Control Level"
-----------------------------------------------
As in similar price-action based indicators, there’s a certain threshold or “control level”, above which, the pressure becomes “dominant”
when the bull or bear pressure is above that threshold, they will dominate and control the price move – this level can be found around the 25 or 30. I have included the ability to plot and adjust that control level in the TPX’s settings – and I also show some examples in the chart above (weekly chart for MSFT)
The code is commented and the chart is annotated to explain how to “read” the TPX – and how to interpret the values on the price chart
Using the Trader Pressure Index (TPX) in trading
------------------------------------------------------------
TPX can be valuable in showing well-supported (up or down) price moves that may lead to a strong trend that we can ride (when the pressure value is above the control level) - see exampled above
TPX is also valuable in showing when there’s “lack of interest” from the buyers or the sellers (or both) – which is great in exploring chub or no-trade zones - so basically when to avoid trading.
As usual, it's always recommended to use these types of "price action insight" indicators in conjunction with other trend and momentum indicators (moving averages, MACD..etc), so the insight we gain from them can be properly placed within the broader "context" - and to receive additional confimtion signals to support the trading decision.
I will come back later to post something about how the TPX differs from my recently-posted Strength of Movement (SoM) because they wok completely differently but can be used together with great synergy – and also how the TPX compares to the classic DMI/ADX which uses a similar concept.
Please feel free to integrate in your trading – hope you find this useful - comments and feedback are always welcome

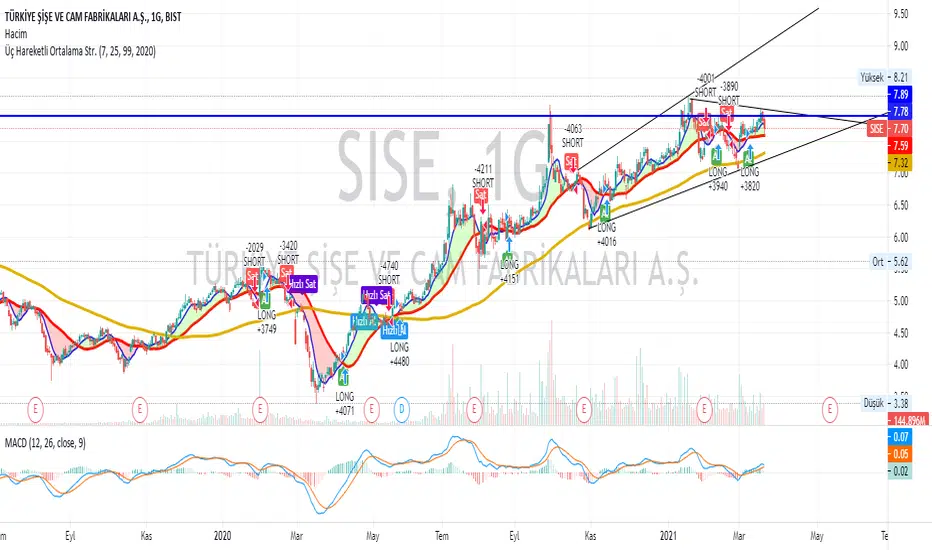
Three moving average strategies
If the short term (Default 7) moving average cuts the medium term (default 25) moving average, BUY. Conversely, it generates the SELL signal. If the long term (Default 99) moving average cuts its short term moving average, Quick SELL. Conversely, it can be interpreted as Fast SELL. You can change the moving average and the number of days as you wish, and you can trade in the short or long term. I hope it was useful.
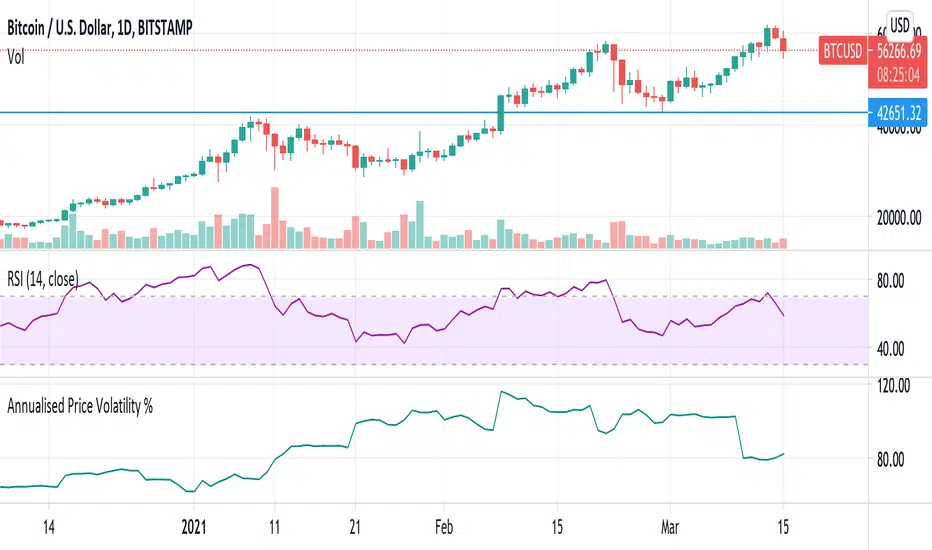
Annualised Price Volatility % CRYPTO dailiesThis is the correct annualisation for crypto currencies (continually traded). It is the rolling 1m vol using 30 days (instead of 25) and an annualisation factor of sqrt(365) not sqrt(252).
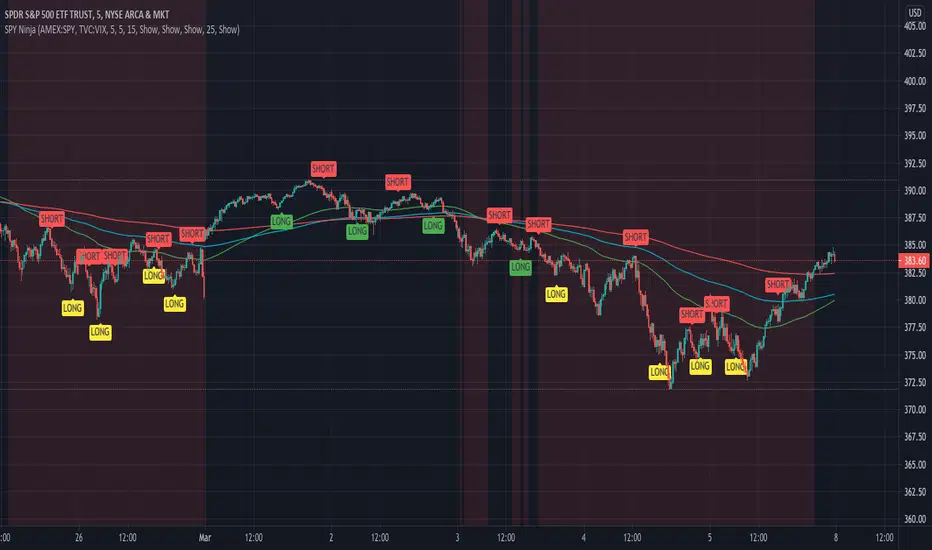
SPY Ninja
SPY Ninja correlates the true strength index exponential moving averages of SPY and VIX together. In doing so we can determine the start of trend shifts via SPY / VIX convergence in addition to crossover, with potential market entries and exits represented by the LONG and SELL signals.
SMMA 50,100, and 200 have been added to chart due to the historic SPY market reactivity to these moving averages. They often act as natural support and resistance levels with SPY, and when coinciding LONG and SHORT signals appear touching any of these levels, it adds an extra layer of confidence for traders' decisions. Also, by highlighting the areas on our SPY chart (red background areas) that represent a VIX threshold higher than 25, we can bring attention to areas with potentially higher volatility immediately so that traders know to proceed with caution.
SPY Ninja works harmoniously with the SPY Ninja Oscillator; Ninja provides the signals highlighting risky VIX areas of concern, while the Ninja Oscillator adds an additional 3 levels of potential confirmation for your trade decisions.
Ultimate Multi-MACD - Early Warnings + Main TrendThis is a set of a bunch of moving averages. Unique, huh? Right. Awesome. Dope.
So, what's cool about this set, is its usability as not just one MACD, but a pair of MACDs specifically tuned to keep you hard. Some of you probably notice already just looking at the available MAs and lengths - there are some common pairs here. But what do you get when you combine all these common pairs that share bases? You get both short and long term plays out of it. The thing MACDs aren't supposed to do. I imagine it would be hard to make a backtestable/bottable script version of this, because the main thing is you have to use your gut a little bit in determing when to take a short term play and when to keep to the long term plays.
In this set, you get 3 TEMAs, 2 VWMAs, 2 SMAs, and 2 ALMAs. Yeah. That's almost TOO phat. I know. Whatever.
The two purple/pink lines are your 25 VWMA and 50 ALMA slow lines. These will be your main slow lines. They're usually close but move around a decent bit and if you want you could make buys and sales using the Alma crossing above the VWMA as a buy and sell crossing under.
Then you have a THIRD potential slow line on your dark green 50 TEMA. You generally use either the 13 or 21 TEMA crossing up as buy and down as sell. The signal TEMAs are bright green 13 and yellow 21.
Next you have all your Fast signal MAs! A peachy 10 VWMA, 13 green TEMA, 21 yellow TEMA, 10 teal/bright blue ALMA and last but not least, two pale SMAs at 5 and 10. The 5 could even be used as a signal against the 10 if you really want. There are countless options for buy and sell signals. Hide and show the ones that work the best on the chart you're trading on. Different ones will work different times. Why not see which ones are working BEST out of all the best ones, though?
Please leave other MA pairs that you would like added in future versions. If I do make a future version with more pairs I will very likely set default to hide some
Enjoy.
RSI-Last-3-ExtremaThis script indicates when the current Relative Strength Index of the last 8 closes is beyond a level from center oscillation which signals the equity is likely to reverse course. When it is the lowest RSI reading of the prior 3 readings and below 25, a green vertical bar will appear signaling a potential BUY point. Likewise, the highest reading of the prior 3 RSI readings and above 75 will signal a vertical red bar or SELL signal. The bar has to have a final close price for the signal to be active. Reversal could take a few more bars to occur depending on the timeframe and equity symbol.
You will be able to find many charts that have this signal perfectly finding the top or bottom of a significant trend.
It successfully indicates profitable reversal around 80% of the time. So far, It is 85% accurate or better in determining downtrend start points on the Daily, 120, 60, 30 Minute charts according to the study of more than 10,000 occurrences. It is 86% accurate on the 30 Minute chart.
This is another tool I use in finding or confirming potential price action. Hope you find it useful.
To add this, favorite the script by clicking "Add to your Favorite Indicators" at the top of the code portion below. On your top tool bar is an "fx" button with a downward arrow to the right of it. Click on the downward arrow/caret and scroll down to "RSI-Last-3-Extrema". Click on this title and it should add to the bottom of your current chart. If you do not see BUY (green vertical bars) or SELL (red vertical bars) right away, try other charts and timeframes.
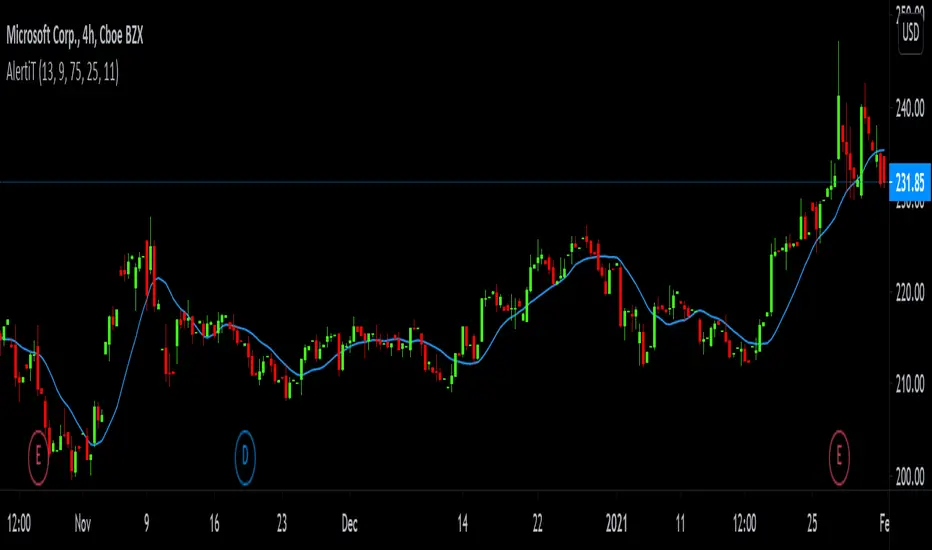
AlertiTI can't be glued to all charts on all tickers all the time. I have a life you know, lol.
So in the spirit of getting fresh air, running errands, working and having fun with family & friends, I setup this AlertiT script.
Three indicators: RSI, SMA and Momentum are used in this script alert.
The alert will be triggered if any of the indicators crosses a specified input.
The message will contain the name of the indicator and its current value.
The default is 13 SMA, 9 RSI +75:-25 and 11 Momentum.
I provided an input in the dialogue box so the variables can be adjusted to suit your needs.
Source is open, high, low, close.
Do your own due diligence, your risk is 100% your responsibility. You win some or you learn some. Consider being charitable with some of your profit to help humankind. Small incremental steps work : If you double a penny a day for a month it = $5,368,709. Good luck and happy trading friends...
*3x lucky 7s of trading*
7pt Trading compass:
Price action, entry/exit
Volume average/direction
Trend, patterns, momentum
Newsworthy current events
Revenue
Earnings
Balance sheet
7 Common mistakes:
+5% portfolio trades, risk management
Beware of analysts motives
Emotions & Opinions
FOMO : bad timing
Lack of planning & discipline
Forgetting restraint
Obdurate repetitive errors, no adaptation
7 Important tools:
Trading View app!, Brokerage UI
Accurate indicators & settings
Wide screen monitor/s
Trading log (pencil & graph paper)
Big organized desk
Reading books, playing chess
Sorted watch-list
Checkout my indicators:
Fibonacci VIP - volume
Fibonacci MA7 - price
pi RSI - trend momentum
TTC - trend channel
AlertiT - notification
www.tradingview.com
Double EMA CROSS
Double EMA CROSS (DEC)
Useful for identifying and receiving alerts about uptrends and downtrends.
This script uses two Exponential Moving Averages (EMAs) to find price uptrends and downtrends.
An Exponential Moving Average ( EMA ) is a type of moving average that places a greater weight and significance on the most recent data points.
The script produces uptrend and downtrend signals based on crossovers and divergences between the two EMAs,
the user will be able to spot a trend change (when the EMAs crossover) and to determine the strength of the current trend (when the EMAs diverge).
It is also posible to get alerts for uptrends and downtrends on the web and mobile app with sound and pop-ups as well as via email.
The optimal time to enter and exit the market can be concluded from this trend changes.
The user can set their own EMAs, by default they are set to 25 and 75 periods for medium and long term respectively.
When the medium term EMA crosses below the long term EMA the asset is in a downtrend and the price will decline, and when the
medium term EMA crosses above the long term EMA the asset is in an uptrend and price will increase.
This scripts plots the following indicators and signals on the chart to help the user to identify trends:
1.- Medium and long term EMAs as lines overlaid on the price chart.
2.- Up green triangles above bars when the price is on an uptrend and down red triangles below bars when the price is on a downtrend.
3.- Arrows with text to indicate the start of an uptrend or downtrend.
The user can enable and disable the indicators and signals as well as set colors and shapes to their liking.
This script also lets the user create alerts for uptrends and downtrends. To create a new alert using this script follow this instructions:
1.- Once you added this script to your chart, go to the alerts panel (right on web or bottom tool bar on the mobile app) and add a new alert (alarm clock icon with a plus sign).
2.- A modal window will open. On the “Condition” dropdown menu select “DEC”.
3.- On the next dropdown menu (right below the “Condition” one) you can select.
4.- Lastly you can set all the normal alert options and create the alert.

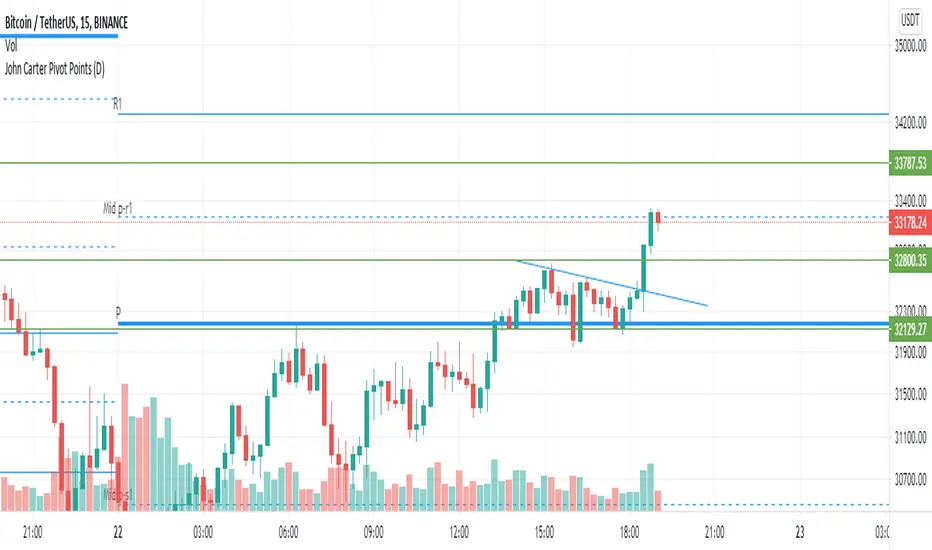
John Carter Pivot Points
This script is based on John Carter Mastering The Trade book. Pivot calculation is based on the previous day high, low, and close.
What Are the Trading Rules for Pivot Buys on Trending Days?
Sells are reversed.
1. Each day I update the appropriate pivot levels on the charts to reflect the previous day’s action. On Mondays, I also
update the weekly pivots, and on the first trading day of a new month, I update the monthly pivots.
2. The first pivot play is done in conjunction with the gap, if there is one. If there is a gap down, then I buy a decline into
the closest pivot level. If there isn’t a playable gap (more than 10 YM points or 1 ES point), then I will wait until
9:45 a.m. eastern to initiate the first play.
3. If the volume on the five-minute ES chart is more than 25,000 contracts, then I’ll wait for the markets to penetrate a
pivot level and move up at least a quarter of the way to the next pivot level. Once this happens, I will then set up a
bid to buy the first retracement back to the violated pivot level.
4. I enter my trades with limit orders only. I place orders “just in front of” the pivot. For the YM, I use 3 points; for the
ES, 0.25 point; for the NQ, 0.50 point; for the TF, 0.20 point; and for individual stocks, 5 cents. For example, if I’m
trading the YM and the pivot level is 10,000, then I would buy a decline to 10,003 and short a rally to 9997
.Sometimes the pivot will be an odd number, such as 1117.38 on the ES. In this case, I always round in the direction of
the trade. So, if I’m bidding for a long, I will round 1117.38 to 1117.50, and my bid will be 1117.75. If I’m offering a
short, I will round 1117.38 down to 1117.25 and place my offer at 1117.00. My stops and targets, then, would be “just
in front of” these appropriate long and short levels.
5. Once filled, I place an order to close the first half at the next pivot level and the second half at the pivot level after
that, using the same “just in front of” parameters.
6. I place a stop at 20 points for the YM, 2 points for the ES, 4 points for the NQ, and 1.50 points for the Russell. For
stocks, I will use a stop based roughly on the price of the stock. If the stock is under $10 a share, I will use a stop of
20 cents. If it is between $10 and $20, I will use a stop of 30 cents; if it is between $20 and $30, I will use a stop of
40 cents, and so on, adding another 10 cents for each $10 increment in price. (A $75 stock would have an 80-cent
stop, for example.)
7. If the first target is hit, I will then move up the stop to my entry-level pivot, minus the “just in front of” fractions
discussed in rule 3. For example, if I get in a YM long at 10,003 and the pivot is at 10,000, then my new stop would
be 9997 once the first target is hit.
8. If I am in a trade at the market close and neither my stop nor my target has been hit, I will close out my position “at the
market” at 4:10 p.m. eastern for futures, and at 3:58 p.m. eastern for stocks.
9. I don’t initiate any new positions after 3:30 p.m. eastern, but I will manage existing positions into the close.
10. The markets rarely have a sustained move above R3 or below S3. If I trade to those levels, I will always fade the
move.
11. After two losers in a row, I’m done with pivots for the day.
What Are the Trading Rules for Pivot Buys on Choppy Days?
Once again, sells are the same, just reversed. The rules for choppy days are identical except for the targets. On choppy days, I
just focus on the YM and the ES. My first target is mechanical: 10 points for the YM and 1 point for the ES on half of my
position. Once this is hit, I will trail up my stop in the same way I would for a trending trade. The second target becomes the
“just in front of” level for the actual next pivot level
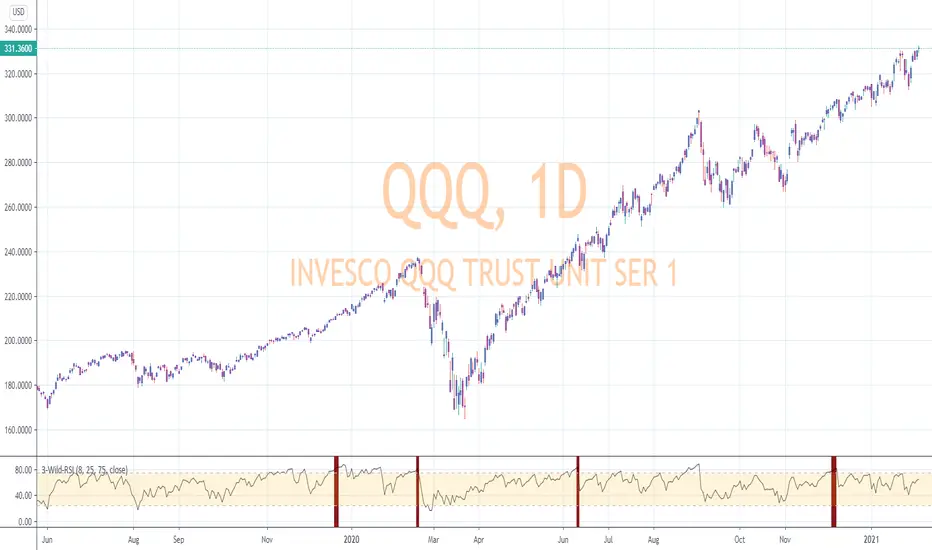
Recession IndicatorThis script attempts to predict recessions four quarters ahead.
According to the New York Fed, "The yield curve—specifically, the spread between the interest rates on the ten-year Treasury
note and the three-month Treasury bill—is a valuable forecasting tool. It is simple to use
and significantly outperforms other financial and macroeconomic indicators in predicting
recessions two to six quarters ahead."
The paper offers Estimated Recession Probabilities Using the Yield Curve Spread:
Four Quarters Ahead
Recession Probability Value of Spread
(Percent) (Percentage Points)
5 1.21
10 0.76
15 0.46
20 0.22
25 0.02
30 -0.17
40 -0.50
50 -0.82
60 -1.13
70 -1.46
80 -1.85
90 -2.40
"Note: The yield curve spread is defined as the spread between the
interest rates on the ten-year Treasury note and the three-month
Treasury bill."
You can choose at which Recession Probability (percent) you want to display the signal (default value is 25%), as well as choose if you want to only display the signal at inversion (default) or at all times when the yield curve is inverted.
To use, just select your current timeframe from the menu.
Includes an option for repainting -- default value is true, meaning the script will repaint the current bar.
False = Not Repainting = Value for the current bar is not repainted, but all past values are offset by 1 bar.
True = Repainting = Value for the current bar is repainted, but all past values are correct and not offset by 1 bar.
In both cases, all of the historical values are correct, it is just a matter of whether you prefer the current bar to be realistically painted and the historical bars offset by 1, or the current bar to be repainted and the historical data to match their respective price bars.
As explained by TradingView,`f_security()` is for coders who want to offer their users a repainting/no-repainting version of the HTF data.

MrBS:Directional Movement Index [Trend Friend]I started this project with the goal of making a DMI/ADX that was easy to read at a glance. Its since become a little more then just colouring the slopes. The majority of the time, the best returns come from trending markets (THE TREND IS YOUR FRIEND... until the end) and I hope this helps people become good friends with the trends.
----- Features
- A function to change the values used for calculation from real OHLC and Heikin Ashi. This allows us to look at different chart types but see the specific ADX we choose. Originally HA values were used for calculation since it is easier to see trend on HA charts. However when testing it was not as effective as the ADX calculated from the real values on normal charts. So the default function was flipped and real OHLC values are used as default.
- Two ADX plots so we can see two different smoothness's. With a smoothing of 2, a slight slow down in PA can cause a negative slope but the smoother ADX will stay trending unless its a major change. 2nd ADX is slightly transparent.
- There is an EMA of the main ADX that can be used as a exit signal filter. If the ADX starts going down but has not crossed the EMA we would stay in a trade.
- Plots (excluding EMA) are coloured based on positive or negative slopes.
- Fibonacci numbers have been used to create different trend levels, instead of the standard 25, 50, 100.
- Alerts for every useful situation to help save time and not have to manually enter levels or crosses each time.
- In the code there are 8 EMAs and 3 ADXs but it was too much so they have been slashed out, but are fully functional if you choose to activate and use them. To reactivate the 3rd ADX delete slashes on lines 50, 65, 78, 92-95, 165. The slashed out EMAs are much more obvious and easy to reactivate.
Colours:
ADX going up = Green
ADX going down = Red
DMI+ going up = Bright Aqua
DMI+ going down = Turquoise / Dark Aqua
DMI- going up = Bright Purple
DMI- going down = Dark Purple
EMA = White (50% transparent)
If there is anything that would be useful, let me know and I will add it in. I've already got some improvements/changes planned and some of my notes can be found in the code.
There is also a strategy to go with this indicator that will be uploaded very soon.

MA ICHI BB [Rogulabo]3 indicators in 1.
Included Indicators are:
- MA 5,25,50,100,200
- Ichimoku
- Bollinger Band
These can be used to determine changes in trends when:
- MA's collide, trajectories shift, or certain levels are reached.
- Ichimoku cloud is above or below the candles.
- Bollinger Band's width changes, or range is broken.
Reasons for 3 in 1 assembly:
This indicator is intended to be used by students, and followers of Dan Takahashi
(a prominent educator of investing in Japan who is also a user of TradingView) .
Those who wants to use and learn with the same setup as Dan, would greatly benefit from this since,
the complex setting up process which can be a pain for beginners can be skipped with a simple click.
Every stylistic choice of color and placement were made to make it similar to the chart used by Dan.
Simple customizations are available such as:
- Changing color
- Changing the values
- Hide/show controls
Notes:
This is intended to be used alongside “CC RSI” for the complete the setup.
Any questions, please refer to:
@rogulabo
==
高橋ダンさんが使用されてるチャートと同様のセットアップの為にご活用ください。
複数のインジケータをグループにしておりますので、無料版を使われてる方は効率よく使っていただけると思います。
また、“CC RSI ”どいうタイトルのインジケータも同時に公開しておりますので、セットアップを完成させたい方はこちらもご活用ください。
以下のインジケータを含みます。
・MA線
・一目均等表
・ボリンジャーバンド
カスタマイズされたい方はご自由に値を変更ください。
ご質問は @rogulabo までよろしくお願いいたします。

CSPDMost Advanced & Accurate CandleStick Pattern Detector
Looking All Over of All Markets for All Important Powerful Reversal | Corrective Patterns (25 type)
Filtering the Results with Optional Features like Oscillator, Bollinger Bands, Volume Confirmation, Prior and Following Candles Confirmation which are Fully Customizable.
With this you can detect:
Hammer | Shooting star
Inverted Hammer | Hanging
Long legged Doji | Dragonfly Doji | Gravestone Doji
Bullish tweezers | Bearish tweezers
Bullish inside bar | Bearish inside bar
Bullish three line strike | Bearish three line strike
Bullish engulfing | Bearish engulfing
Piercing line | Dark cloud cover
Bullish abandoned baby | Bearish abandoned baby
Morning star | Evening star
Three white soldiers | Three black crows
*Bullish kayo | *Bearish kayo
Features:
Prior and Following candles Confirmation
You can set prior and following candle as basic prerequisites for marking candles as pattern to make sure you are at the top or bottom of the trend.
Volume confirmation
You can active volume increasing confirmation for some of pattern with adjustable increase % relative to prior candle | candles.
Oscillator Confirmation
Active oscillator confirmation. Select your approved oscillator from list (Stochastic, RSI, StochRSI, MFI, StochMFI) then enter desired value for marking candles as bullish | bearish pattern.
Bollinger Bands Confirmation
Active BB confirmation. Configure your Bollinger Bands. Now only see the patterns which reached or crossed from Bands. Also you can enable BB clod to have your BB indicator at the same time.
Adjustable Flexibility and Precision
You can set tolerance% for Osc and BB Confirmation - each one separately - for more control.
Self-adaptability
The properties of markets change over time, for example the amplitude of fluctuations and the intensity of movements. The script is designed in such a way that you can examine the price history as a benchmark for changes in market properties to adopt determinants. Also you can control those manually.
Self-regulatory
The user has the ability to change input factors depending on their point of view.
Behind the pattern recognition algorithms, there are relationships and similarities in their appearance that cause them to be influenced by each other. Simultaneously with changing the determining factors of each pattern by you, script automatically adjusts other details in accordance with your changes.
Alerts
You can set for type of pattern or each one of pattern have been detected.
Fully Costumizable
All of these options can be change and adjust.
Note 1.
The patterns are based on extensive study of reference and famous sources and the experience of me and my friends in trading and analysis with price action methods.
Note 2.
Due to the Pine limitations in the number of outputs | plots for each script, our attempt has been made to select the best and most important patterns.
Note 3.
So far, many scripts have been written in this field, but our experience with all of them and even the build in version was not satisfactory, and this was the initial motivation for making the script.
We strive to improve progress and elimination of shortcomings and we will continue to make this better.
Note 4.
Through personal experience and based on the principles of market and candlestick psychology, we discovered a new type of pattern and named it as Kayo.
kayo is a two candle pattern which formed when:
1.We have a pivot point with prior candles as left bars and following candles as right bar. Pivot candle called as second candle.
2.In a bullish kayo, first candle must closed descending and second candle must closed as ascending. For bearish kayo vise versa.
3.In a bullish kayo, second candle's lower wick must be longer then upper wick.
4. A pattern marked as kayo when its conditions do not correspond to any of the other patterns(include the confirmation that user added), ie it has the last naming priority over the other patterns.
Note 5.
When you active confirmation options for patterns like hammer, engulf and etc which they conditions are like kayo in some extent, if they can't pass the confirmation steps, they can be marked as kayo pattern.
Note 6.
If you active volume confirmation for Three white soldiers | Three black crows, the confirmation get passed if the volume of forth or third candle increased as value as entered relative to volume EMA3 of 3 candles.
Note 7.
In a bullish pattern all highs of following candles MUST be higher than prior highs and all lows of following candles MUST be higher than prior lows. For bearish patterns vise versa.
This type of confirmation depends on High and Low NOT close!
Gift to price action lovers!
Support us with your like and comments. let us know your experience, points and idea to make this better together.

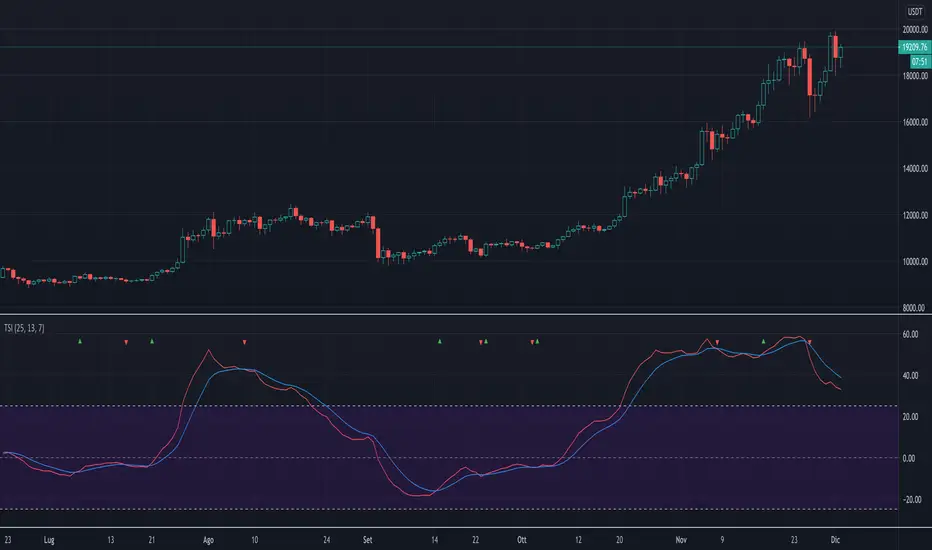
True Strength IndexThe script implements a custom version of TSI (True Strength Index). This index may be useful for determining overbought and oversold conditions, indicating potential trend direction changes via centerline or signal line crossovers, and warning of trend weakness through divergence.
The script highlights when TSI line crosses the signal line with a colored triangle, that is
when the TSI line crosses above the signal line from below, that may warrant buying, a green triangle that's pointing up is drawned;
when the TSI line crosses below the signal line from above, that may warrant selling, a red triangle that's pointing down is drawned.
Note: Signal line crossovers occur frequently, so should be utilized only in conjunction with other signals from the TSI.
The script is very easy to use and it is possible to change the following parameters:
EMA smoothing period for momentum (default value is 25)
EMA smoothing period for smoothed momentum (default value is 13)
Signal line period (default value is 7)
The type of signal line: EMA or SMA (default value is EMA)
Show or not the TSI line
Show or not the signal line
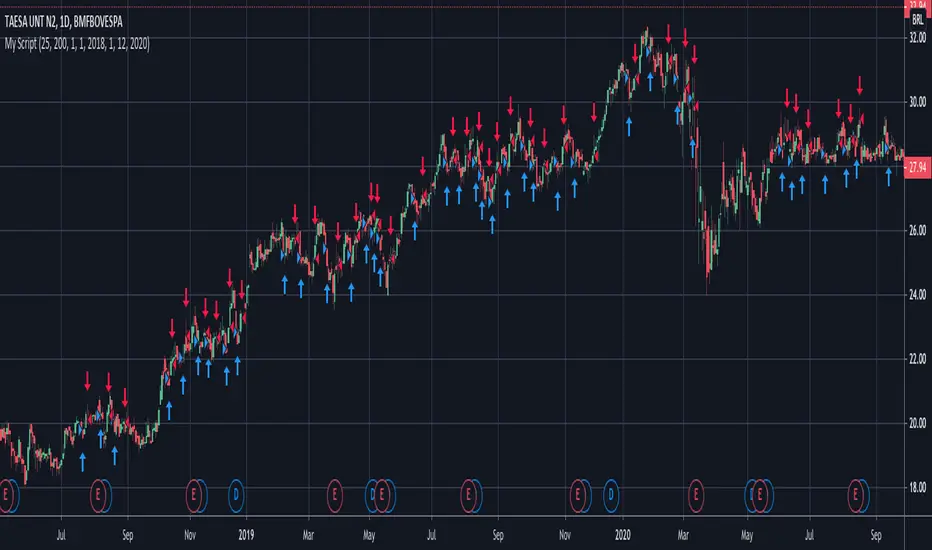
IFR2 - RSI2When the price is over the EMA and RSI 2 is less then 25 so an open order is going to be made and the strike is the high of the antepenultimate price
Crypto EMA+MA+MACS by hobbeLeThis is an indicator that includes several EMAs and MAs (Used in Cryptotrading).
In addition, the Golden and Death Cross are also displayed.
Used MAs
MA 7 - Orange Line
MA 21 - Yellow Line
MA 25 - Grey Line
MA 99 - Blue Line
MA 200 - Green Line
Used EMAs
EMA 200 - Grey Dotted Line
EMA 222 - Pink Dotted Line
Golden Cross
Crossover MA25 + MA200
Death Cross
Crossunder MA25 + MA200
What is a Moving Average (MA) ?
A moving average (MA) is a widely used indicator in technical analysis that helps smooth out price action by filtering out the “noise” from random short-term price fluctuations.
Moving average is a trend-following, or lagging, indicator because it is based on past prices. The most common applications of moving averages are:
to identify the trend direction
to determine support and resistance levels
The two basic and commonly used moving averages are the simple moving average ( SMA ), which is the arithmetic average of a security over a defined number of time periods, and the exponential moving average ( EMA ), which gives greater weight to more recent prices.
What is a Golden Cross?
The golden cross is a candlestick pattern that is a bullish signal in which a relatively short-term moving average crosses above a long-term moving average. The golden cross is a bullish breakout pattern formed from a crossover involving a security's short-term moving average (such as the 15-day moving average) breaking above its long-term moving average (such as the 50-day moving average) or resistance level. As long-term indicators carry more weight, the golden cross indicates a bull market on the horizon and is reinforced by high trading volumes.
What Is a Death Cross?
The death cross is a technical chart pattern indicating the potential for a major selloff. The death cross appears on a chart when a stock’s short-term moving average crosses below its long-term moving average.
Source; Investopedia

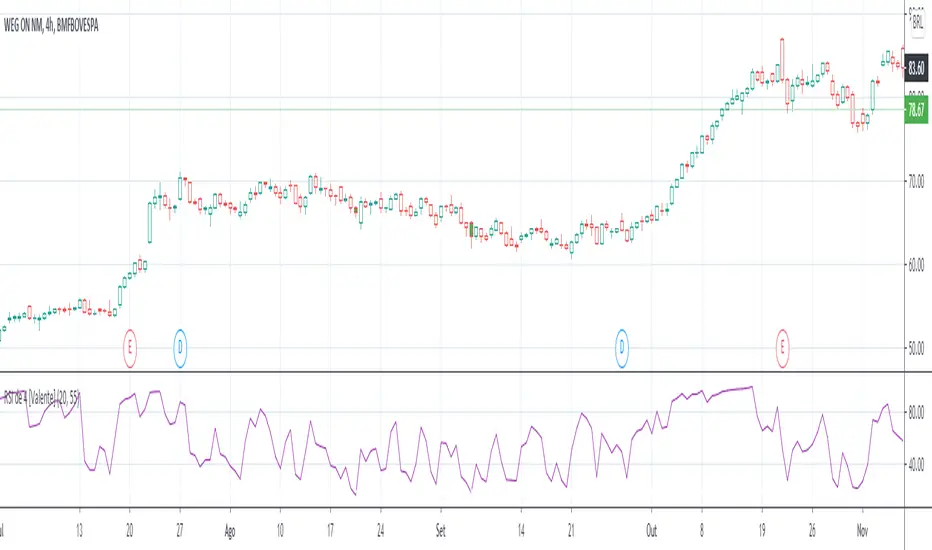
RSI de 4 [Valente]Study RSI 4 (RSI 25) from connors strategy. It will fill the candle color with green on buy signals and red on end positions base on RSI4 study.
Aligned Moving Average FilterThis is another adoption of Aligned Moving Average index study published earlier:
Instead of summing up the aligned moving average strength, here we are checking the max and min values from X bars. If maxValue is above threshold, we show bullish bias by coloring candles lime. Similarly if minValue is below threshold we show bearish bias by coloring candles orange. If the max and min signals are mixed - showing both bullish and bearish or showing neither bullish or bearish, then we do not have any bias and candles are colored in silver.
Parameter descriptions are as below:
Moving Average Type : Select moving average type to calculate moving average alignment index
LookbakPeriod : Periods to calculate min and max values
Threshold : Percentage less/more than min/max values of alignment index. At present, max value of alignment index is 36. Hence, 25 threshold will consider max ma alignment index above 27 as bullish and min alignment index below 9 as bearish
Filter type : allows you to use only bullish or bearish filter.
If bullish type is selected, then candle colors are based only on the maxValue of moving average alignment. Candle color will be lime if above threshold and silver otherwise.
If bearish type is selected, then candle colors are based only on the minValue of moving average alignment. Candle color will be orange if below threshold and silver otherwise.

Sniper DragonThis indicator improvement from Indicator | MCDX
I make some revise with adding rsi line and range. Also, hardcoded sensitive value to the rsi base, period etc.
Sniper Dragon created for help trader to identify smart money and momentum using RSI .
The rsi base also hard coded with sensitive rsi value that will get accurate value.
How to use this indicator:-
Histrogram Color legend
1. Green Color - Retailers
2. Yellow Color - Institution
3. Red Color - Smart Money
- the more red color in one bar is prefer for long position
- full yellow color indicate will good for mid position or short term position.
- if more green color then red and yellow indicate that the price likely going down. need to be careful here. the seller is in overpower.
- if more red color increasing, its indicate that the buyers momentum come in. A powerful buying interest.
Black Line RSI using RSI 9
- help trader to indentify current momentum.
- RSI range area already scale to fit in with the histogram.
- RSI scale range:-
- RSI 40-50 : signal overbought. standby for sell
- RSI 25-35 : indecision signal. might sideway. if before got above 35 can buy.
- RSI 0-15 : signal oversold. standby for buy
Horizontal Line Range
- red line :- indicate max range for the momentum. need to standby to sell.
- green line:- indicate lower min range for the momentum. can ready for buy if black line cross up the horizontal range.
