Simple Moving Averages (5, 10, 20, 60, 120, 200SMA for different time frames.
Covers 5, 10, 20, 60, 120, 200 sma units
Search in scripts for "股价站上60月线"
MA 5-10-30-60-90-120 by MMCThis indicator only plots 6 moving average lines:
MA 5, MA 10, MA 30, MA 60, MA 90, MA 120
No ribbon, no fill, no clouds, no arrows, no alerts — completely clean and minimal.
Lines are thin (linewidth = 2) but colors are very bright/neon so they pop even on dark charts.
Two inputs:
MA Type → EMA (default, faster) or SMA (smoother but lags more)
Color Theme → 3 preset themes:
Canlı Kontrast → brightest and most visible (red-orange-yellow-green-blue-purple)
Gökkuşağı → classic rainbow order
Kırmızı-Yeşil → red/orange tones for short-term, green tones for long-term
Change the theme and colors update instantly.


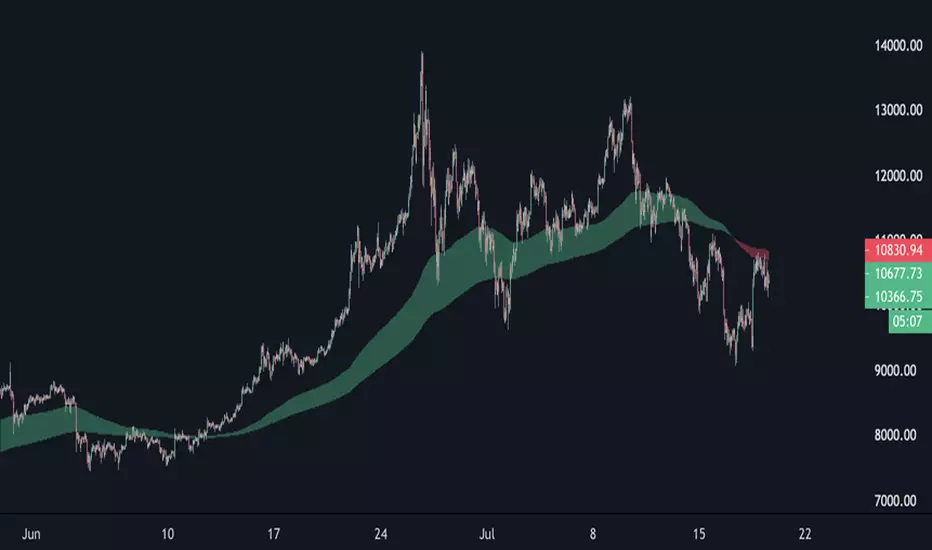
EMA Cloud 9/30/60 – Visual Trend Strength - CryptowitchThis indicator displays three Exponential Moving Averages (EMAs):
🔸 EMA 9 (short-term)
🔸 EMA 30 (mid-term)
🔸 EMA 60 (long-term)
A dynamic cloud is drawn between EMA 9 and EMA 30 to visually highlight trend momentum:
Green cloud = bullish momentum (EMA 9 above EMA 30)
Red cloud = bearish momentum (EMA 9 below EMA 30)
This cloud setup helps quickly identify trend direction, momentum shifts, consolidation zones, and potential entry/exit points.
Clean, visual, and effective – suitable for scalpers, swing traders, and trend followers alike.


Emre AOI Zonen Daily & Weekly (mit Alerts, max 60 Pips)This TradingView indicator automatically highlights Areas of Interest (AOI) for Forex or other markets on Daily and Weekly timeframes. It identifies zones based on the high and low of the previous period, but only includes zones with a width of 60 pips or less.
Features:
Daily AOI Zones in blue, Weekly AOI Zones in yellow with 20% opacity, so candlesticks remain visible.
Persistent zones: AOI boxes stay on the chart until the price breaks the zone.
Multiple zones: Supports storing multiple Daily and Weekly AOIs simultaneously.
Break Alerts: Sends alerts whenever a Daily or Weekly AOI is broken, helping traders spot key levels in real-time.
Fully automated: No manual drawing needed; zones are updated and extended automatically.
Use Case:
Ideal for traders using a top-down approach, combining Weekly trend analysis with Daily entry signals. Helps identify support/resistance, supply/demand zones, and critical price levels efficiently.

EMA band 12/60/150/200EMA band consisting of 12/60/150/200
Specifically for Indian stock market, can be used for other trading scripts after testing.
Best use case : on Daily TF.
Bull run entry criteria, Not bear market or Bottom catching.

15-Minute and 60-Minute ORB with Wicks15 and 60 minute ORBs for each trading day. Simple, yet effective.


EMA (10,20,60) + Bollinger BandsCombination of bollinger bands and exponential moving averages (10, 20, 60)
The coloring is optimized for dark background, and it is editable
This indicator combined 3 exponential moving average lines and bollinger bands . The EMA lines can be add or deleted in pine editor, and its parameters can be changed too. Same to the bollinger bands . Defaulted value for BB is 20SMA with 2 standard deviations.
Useful as a supplmentary indicators

EMA30,60,100 EMA 30 (orange),60(red),100(green)
Bullish: green below the other two
Bearish: green above other two
when lines cross, no clear trend.
When Price touches the orange = entry point
Thanks to CFXtrader for the basic script


[STRATEGY]EMA 30/60 Cross Strategystrategy based on EMA 30/60 cross
works best on 4hr timeframes & high-midcaps


120/60 Trend ModelCombination of 120 & 60 EMAs used to determine entries as well as the over all trend.
Guppy MMA 3, 5, 8, 10, 12, 15 and 30, 35, 40, 45, 50, 60Guppy Multiple Moving Average
Short Term EMA 3, 5, 8, 10, 12, 15
Long Term EMA 30, 35, 40, 45, 50, 60
Use for SFTS Class

Bollinger Bands HTF Hardcoded (Len 20 / Dev 2) [CHE]Bollinger Bands HTF Hardcoded (Len 20 / Dev 2) — Higher-timeframe BB emulation with bucket-based length scaling and on-chart diagnostics
Summary
This indicator emulates higher-timeframe Bollinger Bands directly on the current chart by scaling a fixed base length (20) via a timeframe-to-bucket multiplier map. It avoids cross-timeframe requests and instead applies the “HTF feel” by using a longer effective lookback on lower timeframes. Bands use the classic deviation of 2 and the original color scheme (Basis blue, Upper red, Lower green, blue fill). An on-chart table reports the resolved bucket, multiplier, and effective length.
Pine version: v6
Overlay: true
Primary outputs: Basis (SMA), Upper/Lower bands, background fill, optional info table
Motivation: Why this design?
Cross-timeframe Bollinger Bands typically rely on `request.security`, which can introduce complexity, mixed-bar alignment issues, and potential repaint paths depending on how users consume signals intrabar. This design offers a deterministic alternative: a single-series calculation on the chart timeframe, with a hardcoded “HTF emulation” achieved by scaling the BB length according to coarse higher-timeframe buckets. The result is a smoother, slower band structure on low timeframes without external timeframe calls.
What’s different vs. standard approaches?
Baseline: Standard Bollinger Bands with a fixed user length on the current timeframe, or true HTF bands via `request.security`.
Architecture differences:
Fixed base parameters: Length = 20, Deviation = 2.
Bucket mapping derived from the chart timeframe (or manually overridden).
No `request.security`; all computations occur on the current series.
Effective length is “20 × multiplier”, where multiplier approximates aggregation into the chosen bucket.
Diagnostics table for transparency (bucket, multiplier, resolved length, bandwidth).
Practical effect: On lower timeframes, the effective length becomes much larger, behaving like a higher-timeframe Bollinger structure (smoother basis and wider stability), while remaining purely local to the chart series.
How it works (technical)
The script first resolves a target bucket (“Auto” or a manual selection such as 60/240/1D/…/12M). It then computes a multiplier that approximates how many current bars fit into that bucket (e.g., 1m→60m uses mult≈60, 5m→60m uses mult≈12). The effective Bollinger length becomes:
`bb_len = 20 mult` (clamped to at least 1)
Using the effective length, it calculates:
`basis = ta.sma(src, bb_len)`
`dev = 2 ta.stdev(src, bb_len)`
`upper = basis + dev`
`lower = basis - dev`
A “bandwidth” diagnostic is also computed as `(upper-lower) / basis` (guarded against division by zero) and shown in the table as a percentage. A persistent table object is created/deleted based on the visibility toggle and updated only on the last bar for performance.
Parameter Guide
Source — Input series for the bands — Default: Close
Use close for classic behavior; smoother sources reduce responsiveness.
Bucket — HTF bucket selection — Default: Auto
Auto derives a bucket from the chart timeframe; manual selection forces the intended target bucket.
Offset — Plot offset — Default: 0
Shifts plots forward/back for visual alignment, displayed in the data window.
Table X / Table Y — Table anchor — Default: Right / Top
Places the diagnostics table in one of nine anchor points.
Table Size — Table text size — Default: Normal
Use small on dense charts, large for presentations.
Dark Mode — Table theme — Default: Enabled
Switches table palette for readability against chart background.
Show Table — Toggle diagnostics table — Default: Enabled
Disable for a cleaner chart.
Reading & Interpretation
Basis (blue): The moving average centerline of the bands (SMA of effective length).
Upper (red) / Lower (green): ±2 standard deviations around the basis using the same effective length.
Fill (blue tint): Visual band zone to quickly see compression/expansion.
Interpretation staples:
Price riding the upper band suggests strong bullish pressure; riding the lower band suggests strong bearish pressure.
Band expansion indicates rising volatility; contraction indicates volatility compression.
Mean reversion setups often key off the basis and re-entries from outside bands, while breakout/trend setups often key off sustained band rides.
Diagnostics table:
HTF Tag: Human-readable label showing the current timeframe → bucket mapping.
Bucket: The resolved target bucket (Auto result or manual selection).
Multiplier: The integer factor applied to the base length.
Len/Dev: Shows base length (20) and the effective length result plus deviation (2).
Bandwidth: Normalized width of the band (percent), useful for spotting squeezes.
Practical Workflows & Combinations
HTF context on LTF charts: Use this as “slow structure” bands on 1m–15m charts without requesting HTF data.
Squeeze detection: Watch bandwidth shrink to historically low levels, then look for break/hold outside bands.
Trend filtering: Favor long bias when price stays above the basis and repeatedly respects it; favor short bias when below.
Confluence: Combine with market structure (swing highs/lows), volume tools, or a trend filter (e.g., a longer MA) for confirmation.
Behavior, Constraints & Performance
Repaint/confirmation: No cross-timeframe requests. Values can still evolve intrabar and settle on close, as with any indicator computed on live bars.
History requirements: Very large effective lengths need sufficient historical bars; expect a warm-up period after loading or switching symbols/timeframes.
Known limits: Because the method approximates HTF behavior by scaling lookback, it is not identical to true HTF Bollinger Bands computed on aggregated candles. In particular, volatility and mean can differ slightly versus a real HTF series.
Sensible Defaults & Quick Tuning
Default workflow:
Bucket: Auto
Source: Close
Table: On (until you trust the mapping), then optionally off
If bands feel too slow on your timeframe: choose a smaller bucket (e.g., 60 instead of 240).
If bands feel too reactive/noisy: choose a larger bucket (e.g., 1D or 3D).
If chart looks cluttered: hide the table; keep only the bands and fill.
What this indicator is—and isn’t
This is a Bollinger Band visualization layer that emulates higher-timeframe “slowness” via deterministic length scaling. It is not a complete trading system and does not include entries, exits, sizing, or risk management. Use it as context alongside your execution rules and protective stops.
Disclaimer
The content provided, including all code and materials, is strictly for educational and informational purposes only. It is not intended as, and should not be interpreted as, financial advice, a recommendation to buy or sell any financial instrument, or an offer of any financial product or service. All strategies, tools, and examples discussed are provided for illustrative purposes to demonstrate coding techniques and the functionality of Pine Script within a trading context.
Any results from strategies or tools provided are hypothetical, and past performance is not indicative of future results. Trading and investing involve high risk, including the potential loss of principal, and may not be suitable for all individuals. Before making any trading decisions, please consult with a qualified financial professional to understand the risks involved.
By using this script, you acknowledge and agree that any trading decisions are made solely at your discretion and risk.
Do not use this indicator on Heikin-Ashi, Renko, Kagi, Point-and-Figure, or Range charts, as these chart types can produce unrealistic results for signal markers and alerts.
Best regards and happy trading
Chervolino.

🔥 DarkPool's Fear & Greed v4 🔥DarkPool Fear & Greed v4 is a composite sentiment indicator designed to gauge market psychology in real-time. Unlike standard oscillators that rely on a single metric, this tool aggregates data from four distinct technical sources—RSI, MACD, Bollinger Bands, and Moving Averages—to create a unified "Index Score" ranging from 0 to 100.
Beyond general sentiment, the script employs custom algorithms to detect specific market anomalies, including sustainable buying pressure (FOMO), capitulation events (Panic), and trend reversals (Divergences).
Key Features
Composite Index: A weighted average of Momentum, Trend, Volatility, and Price Location.
Anomaly Detection: Specialized logic to flag high-momentum "FOMO" events and high-volatility "Panic" drops.
Divergences: Automatically spots bearish and bullish discrepancies between the sentiment index and price action.
Live Dashboard: A real-time data table displaying current sentiment zones, intensity scores, and volume ratios.
How to Use
1. The Fear & Greed Index The main oscillator line moves between 0 and 100 to visualize market sentiment:
0-20 (Extreme Fear): Deeply oversold; potential capitulation or buying opportunity.
20-40 (Fear): General bearish sentiment.
40-60 (Neutral): Indecisive market.
60-80 (Greed): General bullish sentiment.
80-100 (Extreme Greed): Overbought conditions; potential for a pullback.
2. Visual Signals
FOMO (Triangle Up): Marks candles with excessive buying volume and RSI momentum.
Panic (Triangle Down): Marks candles with sharp percentage drops and volatility spikes.
Divergences (Circles): distinct markers appear when price action contradicts the sentiment index, often signaling a reversal.
3. The Dashboard Located on the chart, the dashboard provides a snapshot of the current market state, including the specific "Intensity" of FOMO or Panic events and a Volume-to-MA ratio to gauge participation.
4. Alerts The script is fully integrated with the alert system. You can set alerts for "Any alert() function call" to receive dynamic notifications for FOMO detections, Panic drops, Extreme Zone entries, and confirmed Divergences.
Disclaimer This indicator is provided for educational and informational purposes only. It does not constitute financial advice, investment recommendations, or a guarantee of future results.
