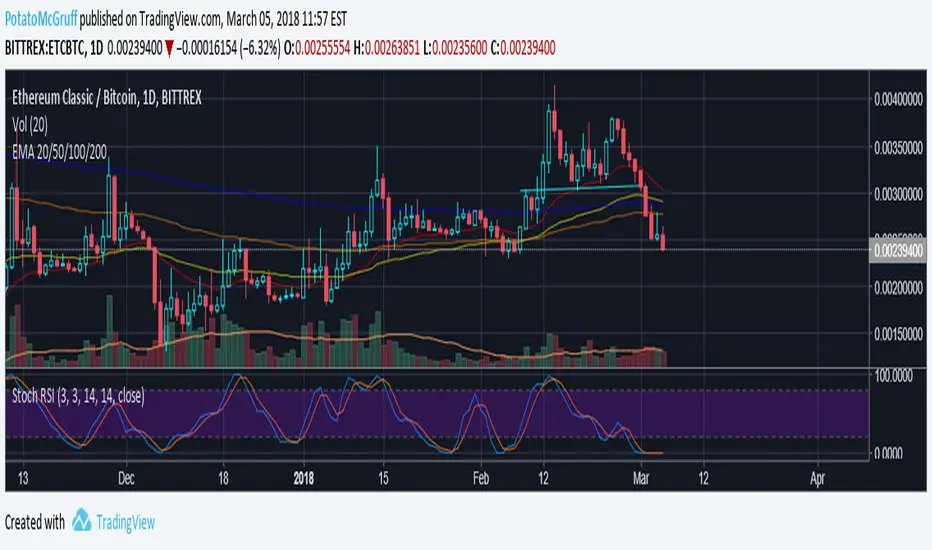
EMA 20/50/100/200Script that publishes the EMA for 20, 50, 100, and 200.
Follow me on Twitter at @PotatoMcGruff
Search in scripts for "黄金近50年的走势"


EMA 20/50/100/200Plots exponential moving average on four timeframes at once for rapid indication of momentum shift as well as slower-moving confirmations.
Displays EMA 20, 50, 100, and 200... default colors are hotter for faster timeframes, cooler for slower ones
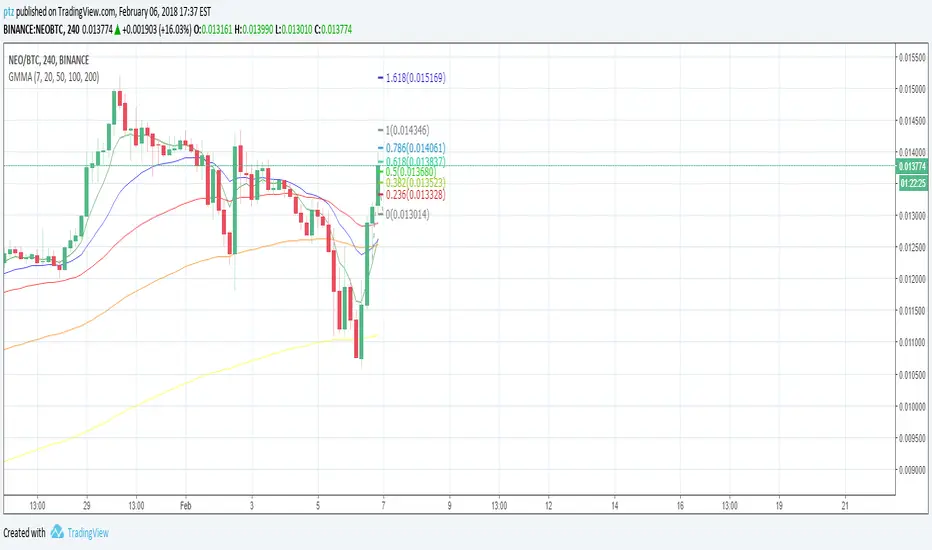
Guppy MMA 3, 5, 8, 10, 12, 15 and 30, 35, 40, 45, 50, 60Guppy Multiple Moving Average
Short Term EMA 3, 5, 8, 10, 12, 15
Long Term EMA 30, 35, 40, 45, 50, 60
Use for SFTS Class

MA Cross 50/200 - Moving Averageindicates short-term 50-day moving average AND long-term 200-day moving average CROSS
@GateTicker


DECL: 3 X Moving Average (50, 100 and 200 day)Basic Moving Average with 3 different intervals. Default: 50 day (blue), 100 day (red) and 200 day (purple)

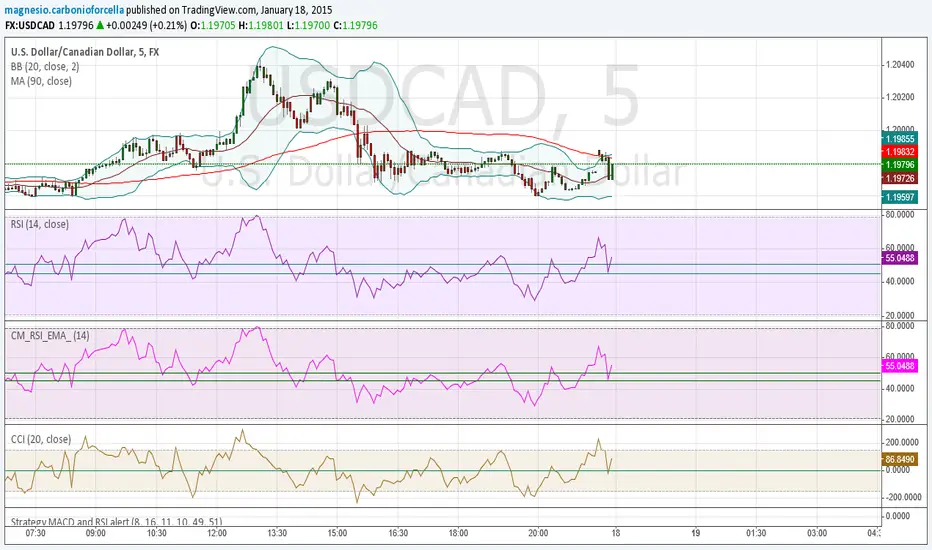
Ultimate Oscillator with 70/30/50 LinesUltimate Oscillator with 70/30/50 lines and a background.
Read how to use it here:
stockcharts.com
Enjoy :)

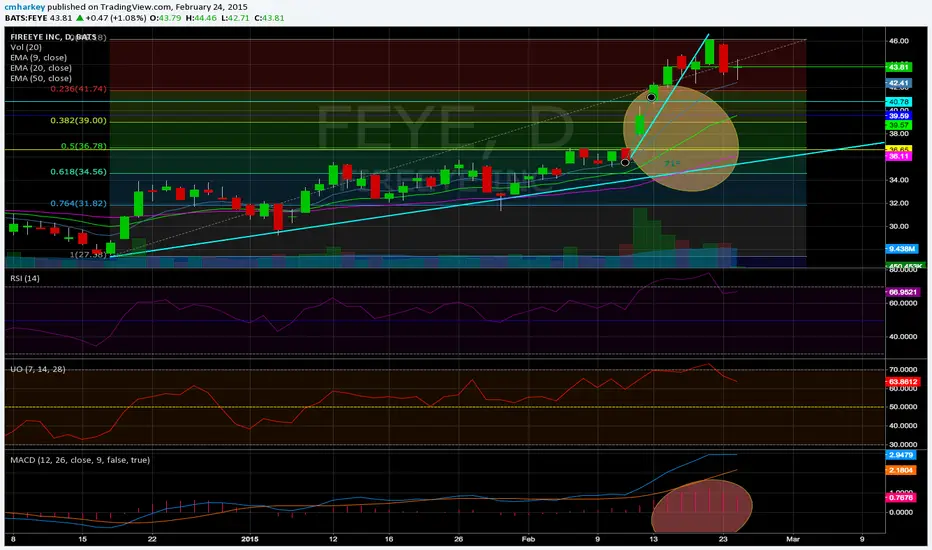
B3 20/50 MeanSimple MA's 20 and 50 are averaged to produce a mean MA line. I like the smoothness of it, and it can help you stay in a trade in the slow moving trends. Also if you start to see a large cloud in your favor, it could be a great time take the profits.


UO_30-50-70Ultimate Oscillator with bands present at the 30, 50, and 70 pt levels.
Personally use this every time, created a script to hard code these lines so I wouldn't need to redraw them all the time.
Enjoy
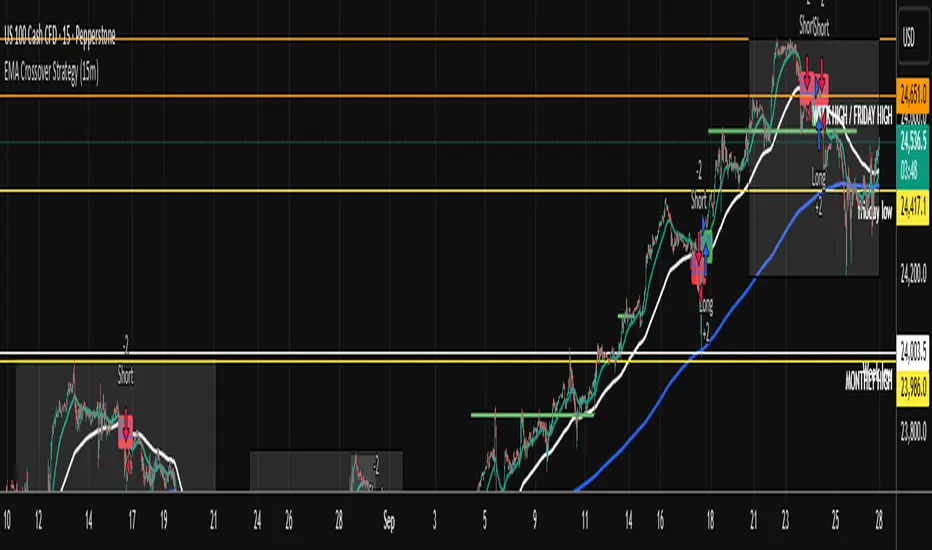
EMA Crossover Strategy (15m)50 and 200 ema crossing when leaving anchor. when 50 and 200 crosses will give you direction of where market is going. wait for a pull back and take trade. sl on highest or lowest point of apex tp open . when you see multiple equal ( low or High) get put of trade.
The Lazy Trader - Index (ETF) Trend Following Robot50/150 moving average, index (ETF) trend following robot. Coded for people who cannot psychologically handle dollar-cost-averaging through bear markets and extreme drawdowns (although DCA can produce better results eventually), this robot helps you to avoid bear markets. Be a fair-weathered friend of Mr Market, and only take up his offer when the sun is shining! Designed for the lazy trader who really doesn't care...
Recommended Chart Settings:
Asset Class: ETF
Time Frame: Daily
Necessary ETF Macro Conditions:
a) Country must have healthy demographics, good ratio of young > old
b) Country population must be increasing
c) Country must be experiencing price-inflation
Default Robot Settings:
Slow Moving Average: 50 (integer) //adjust to suit your underlying index
Fast Moving Average: 150 (integer) //adjust to suit your underlying index
Bullish Slope Angle: 5 (degrees) //up angle of moving averages
Bearish Slope Angle: -5 (degrees) //down angle of moving averages
Average True Range: 14 (integer) //input for slope-angle formula
Risk: 100 (%) //100% risk means using all equity per trade
ETF Test Results (Default Settings):
SPY (1993 to 2020, 27 years), 332% profit, 20 trades, 6.4 profit factor, 7% drawdown
EWG (1996 to 2020, 24 years), 310% profit, 18 trades, 3.7 profit factor, 10% drawdown
EWH (1996 to 2020, 24 years), 4% loss, 26 trades, 0.9 profit factor, 36% drawdown
QQQ (1999 to 2020, 21 years), 232% profit, 17 trades, 3.6 profit factor, 2% drawdown
EEM (2003 to 2020, 17 years), 73% profit, 17 trades, 1.1 profit factor, 3% drawdown
GXC (2007 to 2020, 13 years), 18% profit, 14 trades, 1.3 profit factor, 26% drawdown
BKF (2009 to 2020, 11 years), 11% profit, 13 trades, 1.2 profit factor, 33% drawdown
A longer time in the markets is better, with the exception of EWH. 6 out of 7 tested ETFs were profitable, feel free to test on your favourite ETF (default settings) and comment below.
Risk Warning:
Not tested on commodities nor other financial products like currencies (code will not work), feel free to leave comments below.
Moving Average Slope Angle Formula:
Reproduced and modified from source:

50-Minute Opening Range BreakoutThis is a test of the opening range with Bearish/Bullish confirmation
