Sellsignal
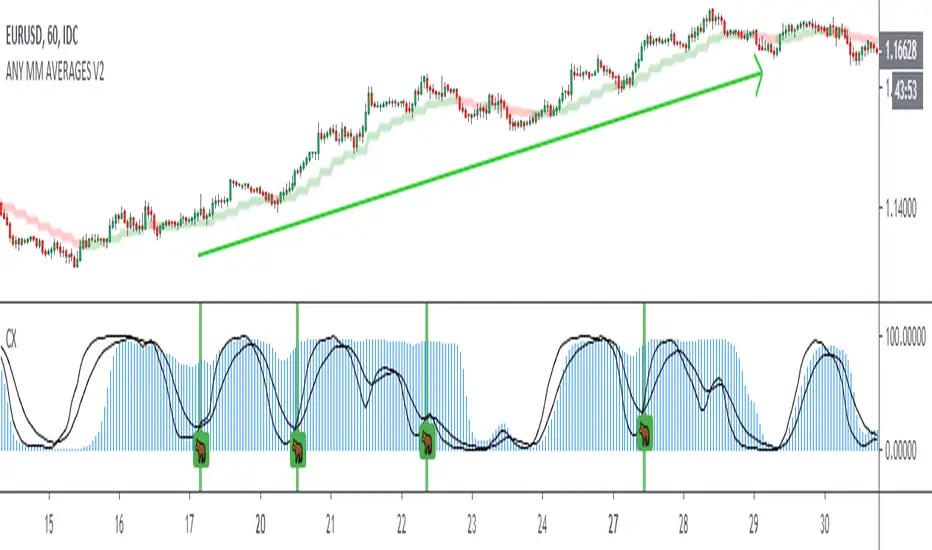
Crack XThis indicator looks for cracks (de-correlation of 2 indicators), what you have to do is simple, first look at the trend in a higher frame, there are many indicators for this, then look for cracks as wide as possible (you can configure the size in the configuration) and that they are not close to important supports / resistances. This indicator can be very useful for Swing, Coverages, to increase existing positions.The confirmation of the crack occurs when the black lines cross + bar closure.
- Added Alerts
CryptoSignalScanner - Double High/Low & Engulfing IndicatorDESCRIPTION:
This script has been designed to show the double high/low candle patterns and the Engulfing candles patterns.
• This scripts is based on RSI length.
• It displays a label when a Double High or Double Low candle pattern is detected.
• It displays a label when a Bullish Engulfing or Bearish Engulfing candle pattern is detected.
• It is also possibility to set a Double High/Low, Double High, Double Low, Bullish/Bearish Engulfing, Bullish Engulfing, or Bearish Engulfing alert.
HOW TO USE:
• When a Double High signal appears it means that we have probably or temporarily stopped the uptrend and could see a reversal. Most likely we will see a downtrend from here.
• When a Double Low signal appears it means that we have probably or temporarily stopped the downtrend and probably could see a reversal. Most likely we will see an uptrend from here.
• When a Bullish Engulfing candle appears it means that we probably made a reversal to the upside. Bullish Engulfing patterns are more likely to signal reversals when they are preceded by three or more red candlesticks.
• When a Bearish Engulfing candle appears it means that we probably made a reversal to the downside. Bearish Engulfing patterns are more likely to signal reversals when they are preceded by three or more green candlesticks.
• Wait for a clear reversal to buy or to sell. Use the Fibonacci tool together with the Eliot Waves to help you with this.
FEATURES:
• You can show/hide the labels based on RSI length and high/low input values.
• You can show/hide the labels based on the % candle match.
• You can show/hide the Double High/Low labels.
• You can show/hide the Bullish/Bearish Engulfing labels.
HOW TO GET ACCESS TO THE SCRIPT:
• Use the link below to subscribe to our indicators.
REMARKS:
• This advice is NOT financial advice.
• We do not provide personal investment advice and we are not a qualified licensed investment advisor.
• All information found here, including any ideas, opinions, views, predictions, forecasts, commentaries, suggestions, or stock picks, expressed or implied herein, are for informational, entertainment or educational purposes only and should not be construed as personal investment advice.
• We will not and cannot be held liable for any actions you take as a result of anything you read here.
• We only provide this information to help you make a better decision.
• While the information provided is believed to be accurate, it may include errors or inaccuracies.
Good Luck,
The CryptoSignalScanner Team

CryptoSignalScanner - Advanced BUY/SELL indicatorDESCRIPTION:
This script has been designed to do some swing trading on 4 hour and daily candles.
After some adjustments it also gives a good result on the lower timeframes 5m, 15m and 1h.
• This scripts is based on RSI, Stoch RSI and some other indicator(s).
• It provides BUY, SELL, STRONG BUY and STRONG SELL labels when loading the script.
• It is also possibility to set a BUY, STRONG BUY, SELL, STRONG SELL, BUY/SELL or STRONG BUY/STRONG SELL alert.
HOW TO USE:
• When a BUY signal appears it means that the trading pair is oversold. Wait for the reversal to buy. Use the Fibonacci tool together with the Eliot Waves Theory to BUY or SELL or wait for the SELL signal.
• When a SELL signal appears it means that the trading pair is overbought. SELL immediately or use the Fibonacci tool together with the Eliot Waves Theory to SELL.
FEATURES:
• You can show/hide the labels based on RSI, Stoch RSI input values.
• You can show/hide the labels based on Stoch RSI K and R input values.
• You can show/hide the labels based on Stoch RSI K and R crossing.
• You can show only STRONG BUY or STRONG SELL labels.
• Etc...
HOW TO GET ACCESS TO THE SCRIPT:
• Use the link below to subscribe to our indicators.
• Based on this script we provide telegram channels that provides signals for all Binance BTC, ETH, USDT and BNB pairs.
REMARKS:
• This advice is NOT financial advice.
• We do not provide personal investment advice and we are not a qualified licensed investment advisor.
• All information found here, including any ideas, opinions, views, predictions, forecasts, commentaries, suggestions, or stock picks, expressed or implied herein, are for informational, entertainment or educational purposes only and should not be construed as personal investment advice.
• We will not and cannot be held liable for any actions you take as a result of anything you read here.
• We only provide this information to help you make a better decision.
• While the information provided is believed to be accurate, it may include errors or inaccuracies.
Good Luck,
The CryptoSignalScanner Team

Premium Stochastic OscillatorThe PSO is a rewired version of a short-period stochastic. Unlike a standard stochastic oscillator, this indicator is normalized to register neutral values at zero while providing greater sensitivity to short-term price moves. This indicator uses a central zero line as a reference point and will oscillate above and below this point as price fluctuates. In addition, the PSO is smoothed by using a double exponential moving average to provide a more even response to turns in the market.
(from TASC magazine, August 2008 issue).
The Premium Stochastic Oscillator was introduced by technical analyst Lee Leibfarth.

Normalized Smoothed MACDMACD normalized with its highest and lowest values over the last “Normalization period”
- includes alerts

KDJ Indicator The KDJ indicator is derived from the Stochastic with the one difference being the addition of the J line. This implies that the KDJ indicator has a total of three lines; %K%D%J. The %J is simply put, the difference between the %K and the %D lines, which is similar to the MACD.
The difference between the %J and that of the MACD is that it is plotted as a histogram and the second being that the value are weighted and as such delivers more emphasis on the shorter term %K line.
What we now have is a line that moves quite slowly and has the knack to move beyond the range of a normal stochastic indicator.

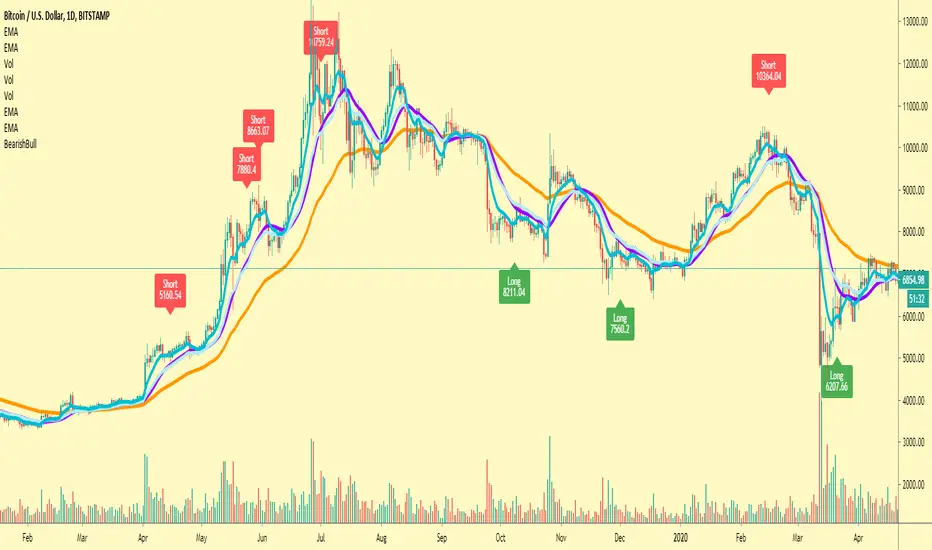
BTC BUY/SELL INDICATORThis script combines my personal MACD+RSI strategy which I've been using for years, into a simpler indicator so if both meet the right conditions It'll give a buy or sell signal depending on the circumstances this script is intended to be used along your set of other scripts as a confirmation of your bias for any particular trade, not to be use alone by itself, I recommend using it on high time frames.
RSI Divergence Plotter (2020)How do i use this script?
Firstly, be sure that you have done your research on what divergence is. The oscillator will automatically mark all types of divergence and has coloured 'over bought' and 'oversold' levels at 30 and 70, although reliable, be sure to use other Technical Analysis before entering trades.
Thank you.

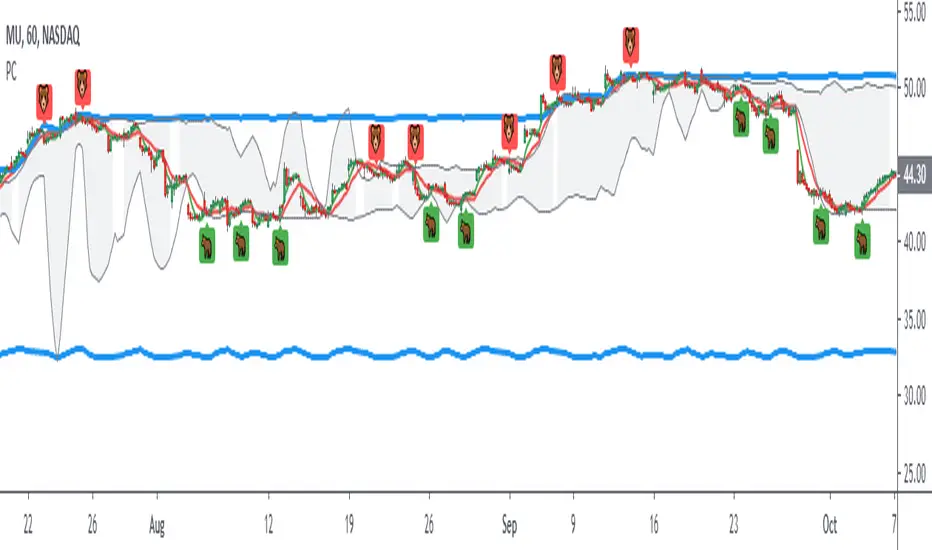
™TradeChartist Rubicon™TradeChartist Rubicon is a beautifully designed functional indicator that helps traders enter and exit Long or Short trades with ease.
This indicator is aptly named Rubicon as it studies the candles in the River of Rubicon (Flat Blue River that never stops flowing up and down the chart) through the Lands of Rubicon to find out which army ( Bulls or Bears ) is committing itself to crossing the River and its tides. By doing this for every price candle, the indicator generates BUY and SELL signals along with Targets and real-time Gains on the chart.
What does the ™TradeChartist Rubicon Indicator do?
Plots very high probability BUY and SELL signals on chart
-- Real-time signals are plotted in Orange labels. (Note: Real-time signals repaint. So wait for confirmation before taking a trade position. This feature is included based on feedback from a few traders as some of them like to see a potential direction based on developing candle, its RSI, Stochastic etc.)
-- Confirmed signals are plotted in Green labels for BUY and Red labels for SELL. These signals don't repaint and can be used confidently to enter or exit a trade.
-- Option to choose type of trade opportunity from indicator settings namely - Long trades, Short trades or both, based on which the chart background colour will be green for duration of long trades or red for duration of short trades.
-- Intermediate signals are also plotted between the primary BUY and SELL signals which can be used for re-entry, scalping etc if the opportunity to enter trade at Primary signal was missed. These secondary signals marked as B and S with arrows can be deactivated from indicator settings.
Plots Target levels as soon as BUY or SELL signal is confirmed on chart.
-- These levels can be used as support and resistance levels too.
-- The first 3 TP levels can be used as a litmus test to trade higher levels as the likelihood of price hitting higher profit levels significantly increase when price crosses the first 3 smaller levels.
-- The performance of the current signal can be tracked by using the Show Gains from Primary Signal and the past signals can be accessed by checking Show Past Performance option from Indicator Settings.
Plots % Gains based on candle close in real-time and Max % Gains based on highest since the BUY signal or lowest since the SELL signal. The entry price is normally plotted along with the signals and is an indicative price based on breached resistance. Traders may choose to buy at Market Price or Limit Price based on the price movement at the time of signal generation.
Plots Bulls/Bears waiting price points for chart time-frame if activated from settings. (Default - Not Active)
Automatically plots Bull and Bear power labels along with visually painting the Bull or Bear power on the Lands of Rubicon.
Plots RSI colour candles based on user preferred Overbought and Oversold RSI levels from indicator settings. (Default - 60 Overbought and 30 Oversold)
What markets can this indicator be used on?
Forex
Stocks - works best with 4hr or above and prices calculated taking gaps into account.
Commodities
Cryptocurrencies
and almost any asset on Trading View
Works really well when there is good volume , volatility or both in the asset observed/traded.
What time-frames can this indicator be used on?
This indicator can be used on 1m, 3m, 5m, 10m, 15m, 30m, 1hr, 2hr, 3hr, 4hr, 6hr, 8hr, 12hr, Daily, Weekly, Bi-Weekly and Monthly time-frames. Signal generation based on value, volume and volatility. If an asset has very little volume or is far low in comparative value against the base currency, there can be far too many erratic signals but with most assets, this won't be an issue.
Does this indicator repaint?
No and Yes
-- Once the confirmed BUY (in green) and SELL (in red) signals are posted after a candle close, it doesn't repaint.
-- Repainting happens for real time Orange label BUY and SELL signal on the current candle. Some traders prefer to see the developing signal and trade using RSI, Stochastic etc.
Does the indicator send alerts when a signal is generated?
Yes, traders can get alerts by setting Trading View alerts for BUY/SELL Signals and when a new Profit Target is achieved. For confirmed BUY/SELL alerts, 'Once per bar close' must be used.
Real-time BUY and SELL trigger alerts can also be set using 'Once per bar' or 'Once per minute' as alert frequency.
Some Examples of trades using ™TradeChartist Rubicon indicator
GOLD short trade and Long trade scalping on 15m
GOLD on Daily
SUGAR-USD on 15m
AUD-USD on 5m
LEND-BTC alt pair on Daily
-----------------------------------------------------------------------------------------
This is not a free to use indicator. Get in touch with me if you would like access to the indicator for a free trial before deciding on a paid access for a period of your choice.
-----------------------------------------------------------------------------------------

Market ModeThe Market Mode indicator seeks to identify trends and rebounds by identifying “phases” according to the principles of John Ehlers.
- When the oscillator passes above the top line, the market is in an uptrend.
- When the oscillator goes below the bottom line, the market is in a downtrend.
- Between these two levels, the market is calmer and could rebound in the direction of the initial trend and / or phase of trend change.

Quadratic SemaphoreThe quadratic semaphore indicator is an indicator that find confirmed market u-turn with the help of 2 quadratic regression calculated with Highs and Lows over the last “length” periods.
- “p” setting is candlesticks quantity to confirmed the quadratic regression has formed a High or Low parabola, such as Fractals. Consecutive same signals can happen due to the use of different price values for upper and lower semaphore.
- Adjust the settings to your instrument and time frame.
- Alerts included.
Success with your trade¡¡
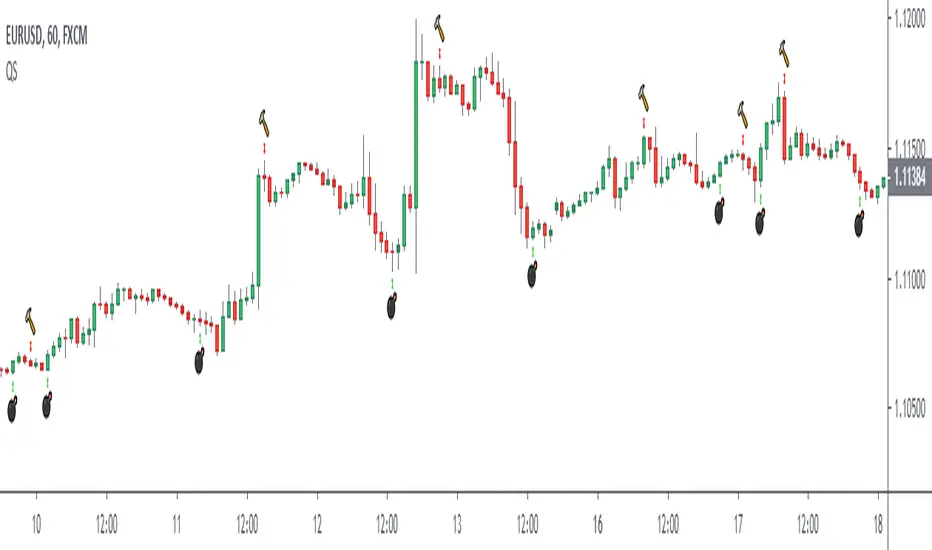
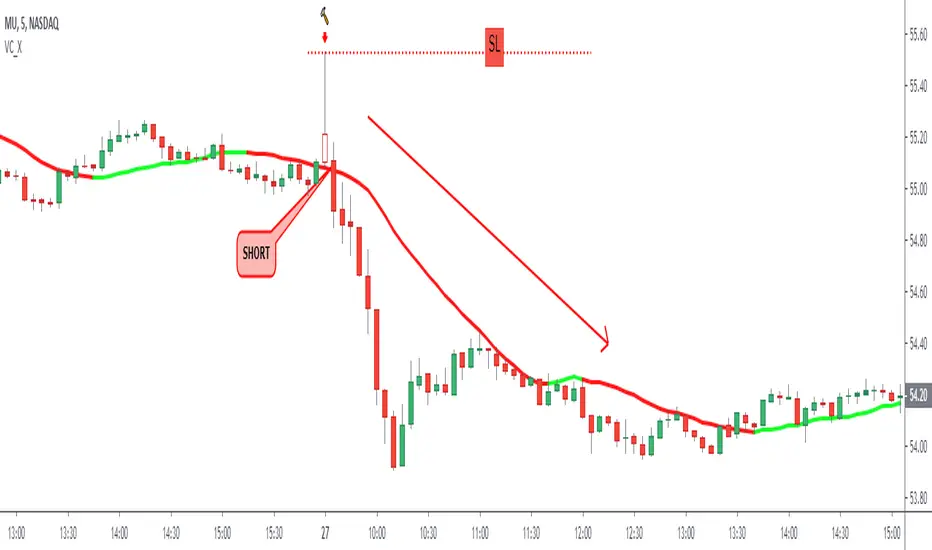
Long Tail Candle by Oliver VelezThis script detects an event created by Oliver Velez, it is a wide-range candle with a small body and a long tail (hammer-type candle), its range is noticeably larger than previous candles, as a rule it can be taken that the body should be maximum of 30% of the total range of the candle with a long tail. The stop goes under the tail and the signal is given when the next candle followed by the long tail candle exceeds its body, do not program this condition so that the alert indicates that a long tail candle was generated and the trader has some Time to visualize the graph and wait for the signal.
The default configuration is very basic, each trader must adjust to their needs.
- Trend filters can be activated.
- Alerts available.
Thumbs up
TMMS OscillatorThe TMMS oscillator (aka “Trading Made More Simpler”) is an indicator made of conditions based on both 2 separated Stochastic and 1 RSI.
Bullish zone is green and bearish one is red. When the histogram is grey, no signals is available at that time.
The indicator has an option to show the current trend of an Hull moving average (ascending or descending curve). When the trend is up, green dots are plotted on the zero line. When the trend is down, the dots are coloured in red.
Greetings, success with your trade!!!

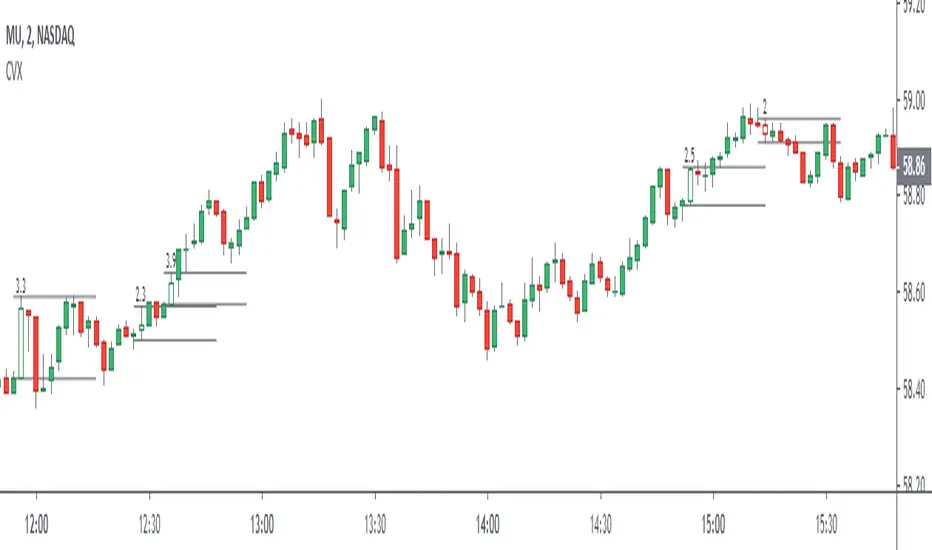
Depth Multiple Time FrameThe price always returns to the average !!!
An important separation of the price with respect to an average, indicates a depth and generally generates a reversion or correction in the trend. Depth detection is a simple and very powerful technique, it is widely used for scalping and pyramid operations, this indicator detects depth in 7 time frames, everything is configurable independently, simultaneous detection of depth in several time frames increases The chances of success in the operation. I personally like pyramidization and it is one of the tools I use to detect depth to average the price of my operations.
thumbs up!!

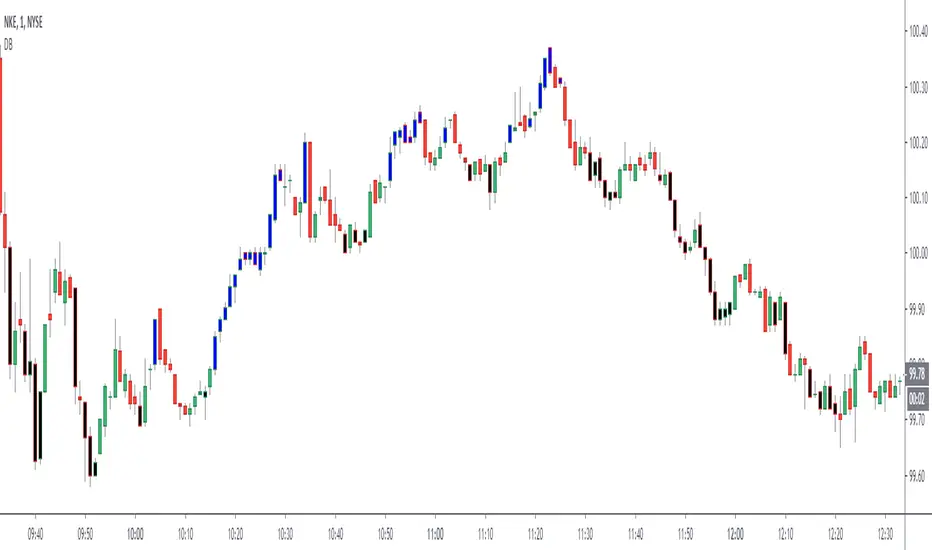
Dreadblitz BarsThese bars can give you good opportunities if you know how to analyze the context.
blue=bullish
black=bearish
thumbs up

ESPECULATOR XNew indicator, I hope you like it.
- If you want to filter more the signals you can activate in MacD Filter in the configuration.
- The use of the indicator is simple, with a simple Trader evaluation you can take good positions.
Note: Volume Required
Thumb up if you think it's a good tool ..
Good energy for everyone.
Regards.


Bull MountainsAre you a BEAR?
Then get out of here!
This indicator is only for long movements, its reading is simple and if you use it correctly it will give you very good results, the components are:
The highest quality configuration is as follows:
It is not necessary that all the components are aligned, the appearance of the upper mountain on the lower mountain is already a good sign, but if you add some seasoning more the soup will be better =)
Note: once the position is taken, it is the trader's responsibility to manage it. INSTRUMENTS WITH REAL VOLUME ARE REQUIRED FOR THIS INDICATOR.
tip: what would happen if you look for the signal in an upper frame and then look for an input in a lower frame? mmmmm....
tip: play with the 'Length' setting and see what happens
Bull a thumbs up please!
I wish you many greens !!

Bollinger Bands on MacdOnly longs when Macd line is above Bollinger Band and shorts when Macd line is above Bollinger Band, this will avoid many problems.
thumbs up!!!

Climatic Volume X- Climate volume detection
- Relative volume value in bar
- Automatic zone generation (possibility of configuration)
- Additional features
¡¡¡Thumbs up¡¡¡
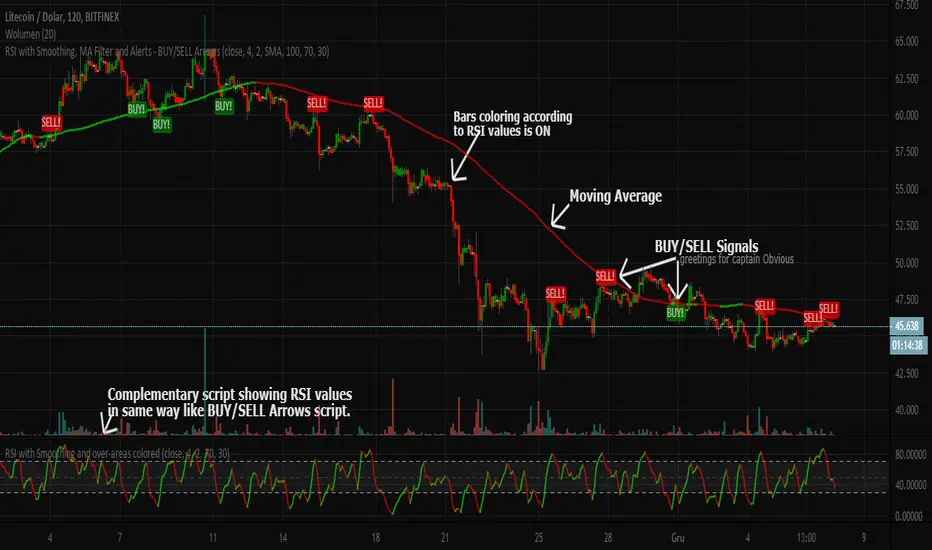
RSI with Smoothing, MA Filter and Alerts - BUY/SELL ArrowsEnglish description:
Here you have kind of better RSI (with smoothing) that can improve your decision-making process when you would like to trade.
Script has the following characteristics:
- Candles colorization
- RSI length
- RSI smoothing
- Moving Average Filter
- Moving Average to choose between: SMA and EMA
- Few differents methods of BUY/SELL signals to choose from and combine together
- Possibility to set Upper/Lower bands for over-bought/sold areas
This BUY/SELL Arrows script is invite-only for the members of our trading group (info in signature).
If you would like to have the oscillator visible on chart above, here is the complementary script:
Polish description:
Niniejszy skrypt, dzięki nieco ulepszonym wskaźniku RSI (z opcją wygładzenia jego linii sygnałowej) ma za zadanie wspomóc proces decyzyjny przy zakładaniu pozycji na giełdzie.
Możliwości są następujące:
- Kolorowanie świec na wykresie zgodnie z kierunkiem danych ustaleń wskaźnika RSI
- Długość/okres RSI
- Wygładzenie RSI
- Filtrowanie sygnałów Średnią Kroczącą
- Wybór pomiędzy dwoma rodzajami średnich kroczących: SMA i EMA
- Kilka różnych metod generowania sygnałów KUPNA/SPRZEDAŻY, które można włączać/wyłączać lub łączyć razem
- Możliwość ręcznego ustawienia domyślnych wartości górnej i dolnej bandy wskaźnika RSI, czyli stref wykupienia/wyprzedania.
Skrypt jest publikowany na zasadzie invite-only(zasada przydzielania dostępu na TradingView), a zatem dostępny jest tylko dla aktywnych użytkowników naszej grupy traderskiej, do której link można znaleść w mojej sygnaturze poniżej.
Jeśli chciałbyś również mieć na wykresie oscylator widoczny w oknie powyżej, tutaj jest odnośnik do skryptu uzupełniającego: