Musashi-Hidden-Wave Trading SystemThis Indicator is a full trading system that offers setups with Entries and Targets and Trade Management. This indicator is very accurate because it uses advanced setup detection and filtering logic.
The setup is triggered if the price passes the blue dash. Do not enter the trade unless price passes the blue dash. Each setup has 3 possible targets, which are dashes colored green for longs and red for shorts.
You can use the baseline (which is a trend-line that is either green for bullish or red for bearish ) to manage the trade. You should only enter long trades if the trend-line is green, and only enter short trades if the trend-line is red. One strategy would be if you enter a trade long, and reach the first target, you can take some profits, but still let the some of the position run, where a bar closing beyond the baseline or breaks a prior opposite pivot, would stop out your remaining position.
To summarize:
Blue Dash = Entry Trigger
Green Dashes = Long Targets (3 of them, for different price targets: target 1, 2 and 3)
Red Dashes = Short Targets (3 of them, for different price targets: target 1, 2 and 3)
The great thing about this indicator is that its universal, there are no settings necessary -- just put it on the chart and it finds high probability setups and paints it on the chart as they occur. There is NO Repainting with this indicator.
Of course, you can add other indicators if you wish, and even add this indicator to your existing trading system.
Again, this indicator does NOT repaint.
Once a setup is found, the indicator draws the entry trigger price and the targets at the setup bar close.
Setup Alerts are fully supported, via email, sms , and desktop notification.
*If you wish to license this indicator, please contact me via private message for details regarding access. Thank you.
LEGAL STUFF:
Risk Disclosure
Futures , forex, stock, crypto and derivative trading contains substantial risk and is not for every investor. An investor could potentially lose all or more than the initial investment. Risk capital is money that can be lost without jeopardizing ones’ financial security or life style. Only risk capital should be used for trading and only those with sufficient risk capital should consider trading. Past performance is not necessarily indicative of future results
Hypothetical Performance Disclosure
Hypothetical performance results have many inherent limitations, some of which are described below. no representation is being made that any account will or is likely to achieve profits or losses similar to those shown; in fact, there are frequently sharp differences between hypothetical performance results and the actual results subsequently achieved by any particular trading program. One of the limitations of hypothetical performance results is that they are generally prepared with the benefit of hindsight. In addition, hypothetical trading does not involve financial risk, and no hypothetical trading record can completely account for the impact of financial risk of actual trading. for example, the ability to withstand losses or to adhere to a particular trading program in spite of trading losses are material points which can also adversely affect actual trading results. There are numerous other factors related to the markets in general or to the implementation of any specific trading program which cannot be fully accounted for in the preparation of hypothetical performance results and all which can adversely affect trading results
Signals

Internal Bar Strength IndicatorThe Internal Bar Strength Indicator is pretty basic but very intuitive. Most stocks that close near their high of the day tend to fall the next day and stocks that close near their low tend to rise the next day. This indicator has very similar buy and sell signals as the RSI. Buy when the indicator rises above its signal or if the indicator is in the red zone and rises up outside of the red zone. Sell when the indicator falls below its signal or if the indicator is in the green zone and falls down outside of the green zone.
Let me know if you would like to see other indicators from me!

UO CrossThis particular UO Cross is evolved into far more flexible and visually intuitive oscillator than previous versions.
After thorough experiments with the code of indicator, I came to new deductions on how to use it properly for random TF and made it simpler.
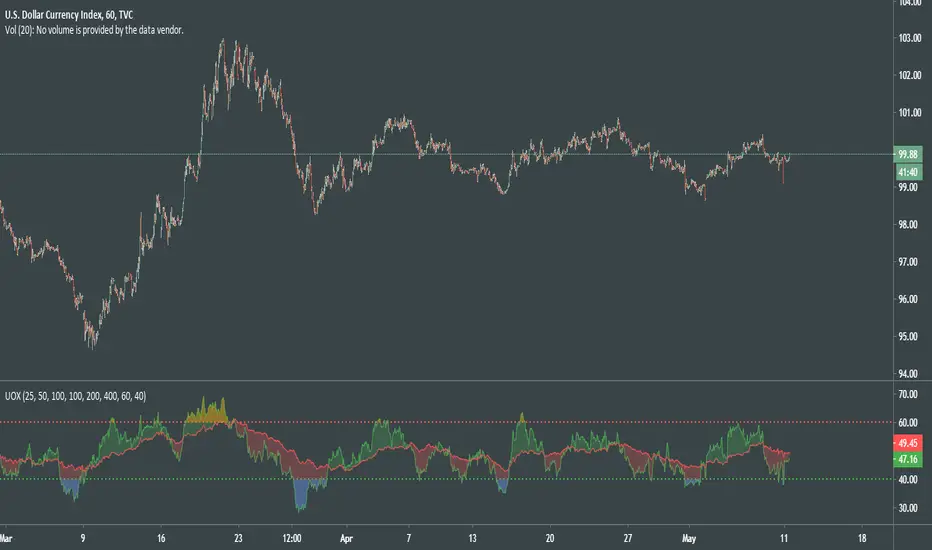
How to read a chart using UOX:
Before uptrend takes place, we see the both indicator levels moving towards green dotted line (40).
When green UO index passes below 40, it's an alert that the market is about to interact to new demand levels, coloring it blue for a potential reversal.
Once green UO index is moving up and crossing above green dotted line - the second signal of uptrend established.
Another strong sign of uptrend is when green UO index passes above red UO index, coloring the space in between 2 indicators greenish.
At this point of time, we can be more confident that the general movement of the price is headed upwards, although we might see some small corrections there.
During uptrend Green UO index will fluctuate above red UO index.
Both indices will rise, getting closer and closer to red dotted line, which psychologically would be the first signs of the reversal of the uptrend.
When you see green UO index passing above red dotted line 60, coloring orangish, that's a serious alert for upcoming reversal.
I'll once more remind you that at this point of time both UO indices are at overbought levels, def above 50.
You know the situation is serious when you witness red UO index being very close to red dotted line!
To confirm the signals for downtrend, you must see green UO index go down and passing below red dotted line.
Second confirmation of downtrend is when green UO index crosses below red UO index, and colors the space in between indices red.
With this indicator we can understand:
Condition of the market
Early signs and alerts for reversal
Signals of entry
Confirmations of those signals
Visualized mass psychology behind domination of bulls / bears
It would be much better if you combine it with volume-based indicators.
Good luck!
TradeChartist Tantalizer Pro™TradeChartist Tantalizer Pro is an extensive set of trading Indicators, Signal generators and Utilities all packed into 1 script. The script's visually appealing design and its functionality offers a pleasing experience for the users, thereby complementing their analysis and helps understand asset's price action better.
What does ™TradeChartist Tantalizer Pro do?
1. MA Tantalizer plots Moving Averages Tantalizer (Fishnet or Tantalized) based on user selection from a dropdown of 10 MAs (SMA, EMA, Zero-Lag EMA, SMMA, WMA, DEMA, TEMA, VIDYA (Variable Index DYnamic Average), T3 MA (developed by Tim Tillson featured in his article "Better Moving Averages" in 1998), Modified T3 MA). If length input is 10, Tantalizer plots 20 MA plots ranging from 10 MA to 200 MA. The Tantalized MAs help the traders to visually spot price trends and along with other indicators within the script, helps make an informed trade decision. 20 MA plots can be individually plotted or hidden from the indicator settings.
2. Plots two MAs based on user input length and timeframe which helps detect MA crosses as shown below.
3. Generates Intensity framework based Signals with recommended Stop Loss (trails with Equilibrium Line) along with Intensity Bands plot. (disables MA Tantalizer)
4. Plots Intensity candles to help spot trend and trend changes.
5. Generates TradeChartist's Rubicon framework based signals with recommended Stop Loss (trails and reverses trade when closes below or above, based on trade direction) along with Rubicon Environment plot.
6. Offers RSI color candles, Automatic Levels Generator in the toolkit to help traders visually spot RSI changes and Support/Resistance levels on chart. RSI Color Candles is a very helpful tool especially in spotting price trends on Heikin Ashi charts.
The sheer number of interesting things that can be done with this script from plotting visually engaging MA Tantalizer, detecting MA crosses not just on chart Timeframe, but also crosses between MAs of different timeframes, switching between Rubicon and Intensity environments, switching between RSI and Intensity color candles to plotting Support/Resistance levels using Automatic Levels Generator, makes this script quite versatile and a real Tantalizer.
This is not a free to use indicator. Get in touch with me (PM me directly if you would like trial access to the indicator before deciding to take lifetime access to this script)
Premium Scripts - Trial access and Information
Trial access offered on all Premium scripts.
PM me directly to request trial access to the scripts or for more information.

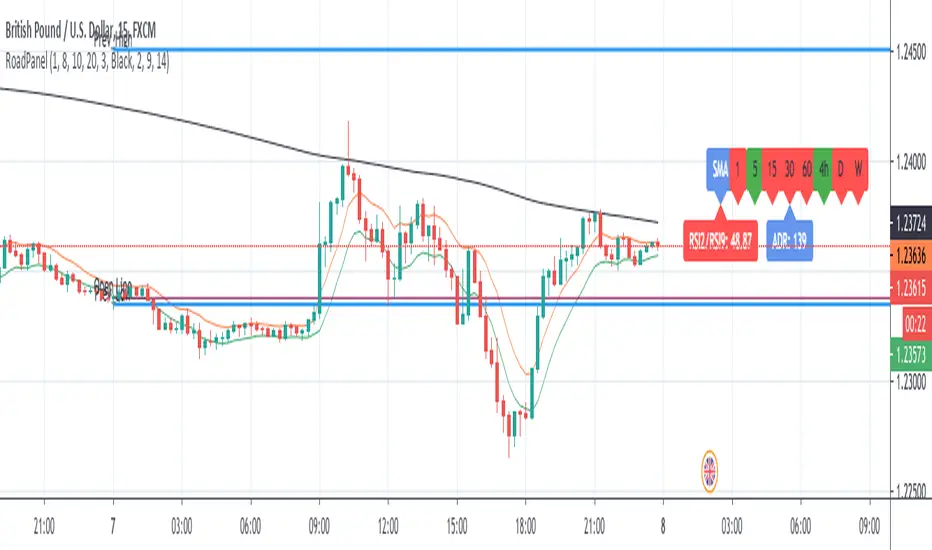
RoadMap PanelThis study is usefull for who follows the rules of "Laura's RoadMap" trading strategy.
If someone doesn't know what I'm talking about, google it because I cannot post link here.
It could be used for scaliping too.
Basically, the rules are:
- Open only in direction of Multitimeframe SMA200
- EMA high/low channel shall be above(buy) or below (Sell) SMA200
- RSI2/RSI9 shall be above(buy) or below (sell) 50
- Look at ADR, last day high/low, daily open for possible supports/resistance.
Next improvement (only to whom is interested to this script and follows me): ADR, last day high/low, daily open to be added to this study.
Next improvement (only to whom is interested to this script and follows me): Alerts to be added.
Please use comment section for any feedback.
********************************** IMPORTANT********************************************************************
I have developed an expert advisor for metatrader4 (MT4) with good results in 2019-April 2020
*********************************************************************************************************************
This study is free to use but code is private. If you like or have question please use comment section.
Check also my other scripts at www.tradingview.com
Thanks for your feedbaks.
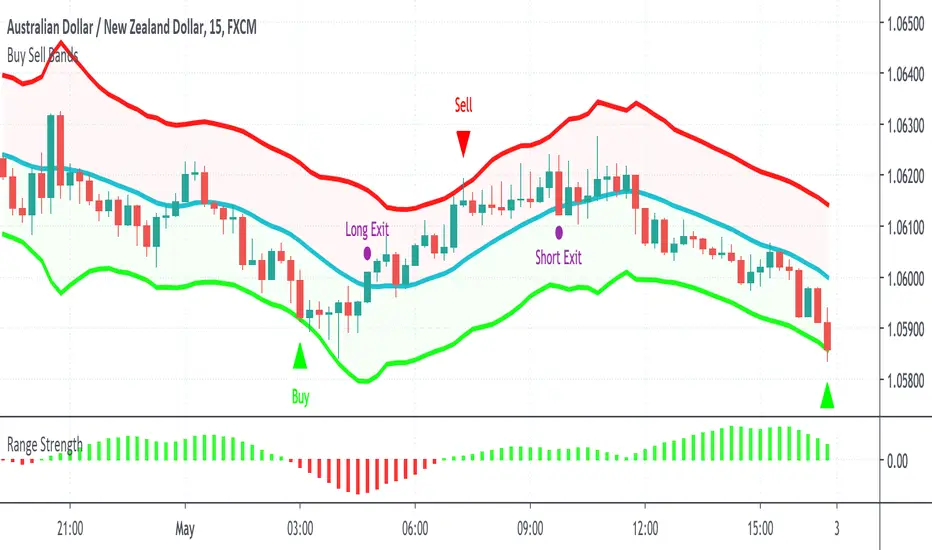
Buy Sell BandsBuy Sell Bands is a super simple indicator based on the mean reversion (range trading) strategy that shows you exactly where to buy, sell and close trades on every chart, market and timeframe.
It's best used together with our Range Strength indicator to identify when the market is in a range mode, this is the best time to take the entry signals from the Buy Sell Bands.
How Is It Different From Other Indicators?
- Designed specifically for the mean reversion (range trading) strategy
- Upper and lower bands are based on current and past volatility
- Aren't as sensitive to "squeezes" after periods of contracted volatility
- Works well in conjunction with the Range Strength Indicator to confirm entry signals
- Helps identify good "pair trading" opportunities
- Can be applied to all markets and timeframes
How To Use The Indicator?
1) Visit our website URL shown below this description and signup
2) We will then grant your TradingView username permission to use our indicators
3) Go to your Indicators window, then the Invite-Only section and add our indicators to your chart
4) Our indicators will then show on every chart you now look at
5) You can set up alerts to be notified in real time of trading signals from our indicators
6) Read our user manual for all the best tips on how to use our indicators as part of a range trading strategy
7) Feel free to reach out to us for personal one-on-one help with getting setup
What Markets and Conditions Does It Work Best On?
All markets cycle between trending and ranging modes, and the key to successfully using these indicators is identifying when the market is in or about to go into a range trading mode, and as such it can be applied to all markets and timeframes.
Some markets and timeframes trade within ranges more predictably than others, for example Forex, Cryptocurrencies, and Futures on the 15 minute timeframe during the US night session can work well due to the lack of price sensitive news creating lasting trends. With Stocks & ETFs on the 5 minute timeframe during the midday session on large cap blue chip stocks with no recent news releases can show strong range trading environments to use our indicators in.
In addition to single markets, you can also use our indicators on pair charts, for example Coca Cola(KO) versus Pepsi(PEP), you can do this by entering KO/PEP inside your TradingView chart quote box and it will bring up a pair chart. Our indicators will show buy and sell signals right on the pair chart just like any other single instrument chart. You can get very creative with what type of pairs you can come up with.
Our indicators are primarily designed for day trading and swing trading, however they can also be used for position trading and investing by identifying technically oversold and overbought range levels that are based on current and past volatility around a dynamic average price, for this we recommend using a weekly chart to identify longer trading opportunities.
As always indicators should be used as part of a trading strategy to assist in making decisions, instead of just blindly following every signal they produce you should always seek to compliment technical trading signals with additional analysis to reduce your risk and increase your odds of making a winning trade.
Examples Of Use On Various Markets and Timeframes
GBP vs CHF Forex Pair 15 Minute Chart
Tesla Stock 1 Minute Chart
Bitcoin vs USD Crypto Pair 15 Minute Chart
Micro E-Mini SP500 Futures 1 Minute Chart
Mastercard vs Visa Stock Daily Pair Chart
To gain access to the Buy Sell Bands and Range Strength Indicators visit our website shown below.
Happy Range Trading :)
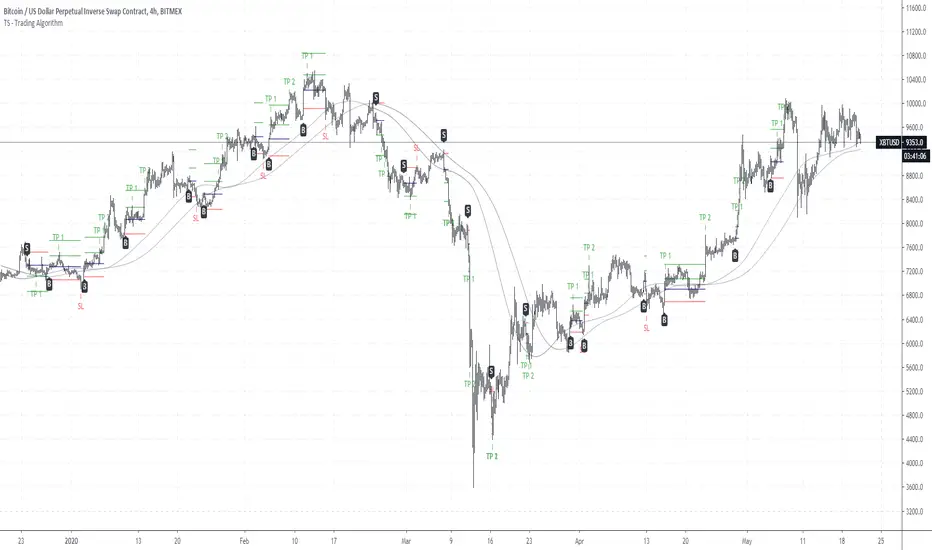
TS - Trading Algorithm - Crypto, Forex & StocksWhat does the TS - Algorithm do?
-- Plots trend following, high probability signals.
-- These signals do not repaint and can be used confidently to enter or exit a trade.
What markets can this indicator be used on?
-- Forex
-- Stocks
-- Commodities
-- Cryptocurrencies
What time-frames can this indicator be used on?
-- This indicator can be used on 1m, 3m , 5m, 10m, 15m, 30m, 1hr, 2hr, 3hr, 4hr, 6hr, 8hr, 12hr, Daily, Weekly, Bi-Weekly and Monthly time-frames.
-- This is a trend following algorithm, so low as there is good volume , volatility and price history of an asset, the model can perform.
Does this indicator repaint?
-- No
Premium Tradespot Script - Trial access and Information
-- Trial access offered
-- PM me directly to request trial access to the scripts or for more information.
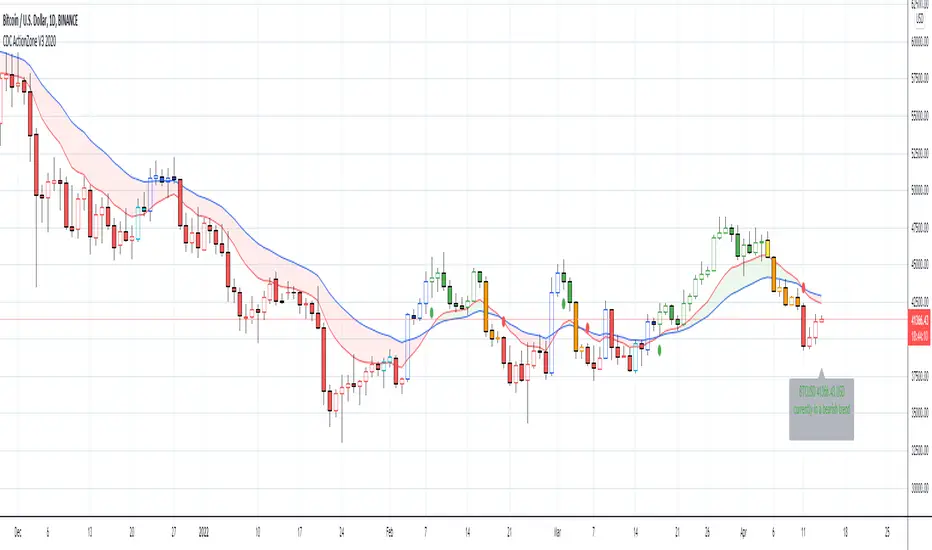
CDC ActionZone V3 2020## CDC ActionZone V3 2020 ##
This is an update to my earlier script, CDC ActionZone V2
The two scripts works slightly differently with V3 reacting slightly faster.
The main update is focused around conforming the standard to Pine Script V4.
## How it works ##
ActionZone is a very simple system, utilizing just two exponential moving
averages. The 'Zones' in which different 'actions' should be taken is
highlighted with different colors on the chart. Calculations for the zones
are based on the relative position of price to the two EMA lines and the
relationship between the two EMAs
CDCActionZone is your barebones basic, tried and true, trend following system
that is very simple to follow and has also proven to be relatively safe.
## How to use ##
The basic method for using ActionZone is to follow the green/red color.
Buy when bar closes in green.
Sell when bar closes in red.
There is a small label to help with reading the buy and sell signal.
Using it this way is safe but slow and is expected to have around 35-40%
accuracy, while yielding around 2-3 profit factors. The system works best
on larger time frames.
The more advanced method uses the zones to switch between different
trading system and biases, or in conjunction with other indicators.
example 1:
Buy when blue and Bullish Divergence between price and RSI is visible,
if not Buy on Green and vise-versa
example 2:
Set up a long-biased grid and trade long only when actionzone is in
green, yellow or orange.
change the bias to short when actionzone turns to te bearish side
(red, blue, aqua)
(Look at colors on a larger time frame)
## Note ##
The price field is set to close by default. change to either HL2 or OHLC4
when using the system in intraday timeframes or on market that does not close
(ie. Cryptocurrencies)
## Note2 ##
The fixed timeframe mode is for looking at the current signal on a larger time frame
ie. When looking at charts on 1h you can turn on fixed time frame on 1D to see the
current 'zone' on the daily chart plotted on to the hourly chart.
This is useful if you wanted to use the system's 'Zones' in conjunction with other
types of signals like Stochastic RSI, for example.
Stochastic Pop and Drop Signals [Bitduke]It's a long/short signals for modified Stochastic Pop and Drop strategy.
About
It's the strategy of 2 indicators: Stochastic Oscillator to define the bias and Average Directional Index to confirm it.
Signals
Strategy flips long / short depending of indicator signals. There can be multiple signals of the same type, for example, 2 longs in a row, only the first of them matters, others you should handle in your websocket script or manually.
Testing
Tested on different sources for data, oscillator periods and different levels in relation to the crypto market.
So, it shows good results with two tight thresholds at 55 and 45 level.
The bar chart below the defining the bullish and bearish periods (green and red) and gives a signal to enter the trade (purple bars).
Backtesting
Backtested on XBTUSD , BTCPERP ( FTX ) pairs. You may notice it shows good results on 3h timeframe.
Relatively low drawdown
~ 10% (from 2019 to date) FTX
~ 22% (4 years from 2016) Bitmex
Bitmex 3h (2017 - 2020) :
i.imgur.com
FTX 3h (2019 - 2020):
i.imgur.com
Possible Improvements
- Regarding trading algorithm it would be good to check with strategy with ADX somehow. Maybe for the better entries
- As for Risk Management system, it can be improved by adding trailing stop to the strategy.
Link: school.stockcharts.com

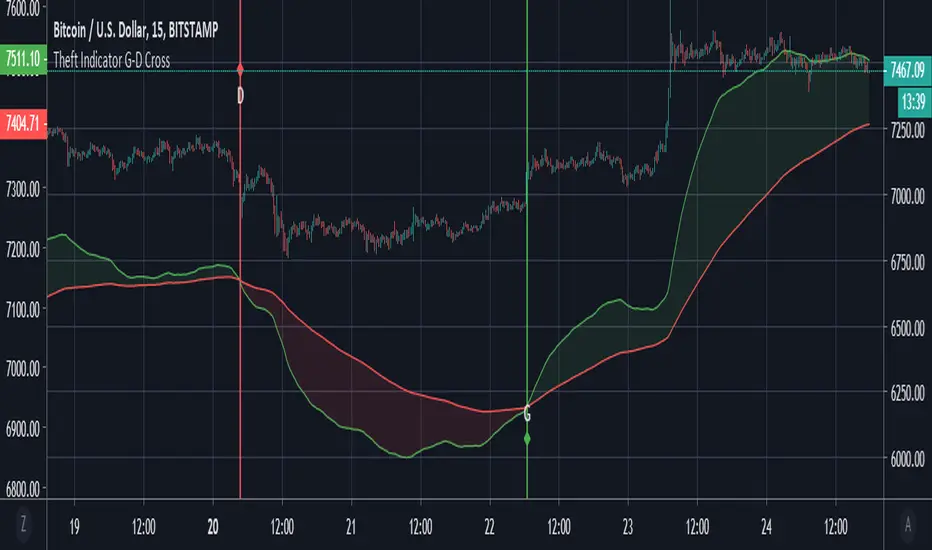
Theft Indicator - Golden/Death CrossThe golden cross and death cross used here is favorable for low time frames. We believe it is a good scalping option to use it. It works well with forex, stocks and crypto.
How is it used? - Just apply it to the chart, and take trades on the labels signaled. G = Golden cross || D = Death Cross.
The indicator is open for public use, but the source code is protected.
Enjoy it.
SuperStoch EnhancedShort Stochastic, Long Stochastic and Super Signal in 1 neatly packaged indicator with customizable inputs.

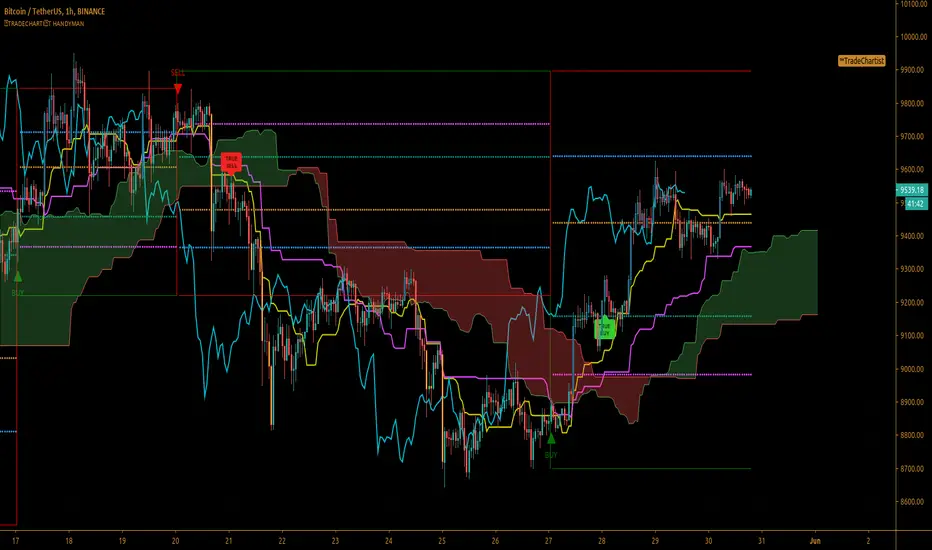
™ᴛʀᴀᴅᴇᴄʜᴀʀᴛɪꜱᴛ ʜᴀɴᴅʏᴍᴀɴ™ᴛʀᴀᴅᴇᴄʜᴀʀᴛɪꜱᴛ ʜᴀɴᴅʏᴍᴀɴ is a well designed utility script that helps plot a few important trading indicators like Bollinger bands, EMA , Ichimoku Cloud etc. along with repainting Buy/Sell signals based on Zig-Zag (Heikin Ashi trend) which can be used cautiously with levels generated.
What does ™ᴛʀᴀᴅᴇᴄʜᴀʀᴛɪꜱᴛ ʜᴀɴᴅʏᴍᴀɴ do?
Plots Bollinger Bands
Plots EMA
Plots VWMA and VWAP
Plots Ichimoku Cloud
Plots Zig-Zag based trade signals - Use with confirmation from other indicators above
---- CAUTION : Signals REPAINT as they are based on developing Zig-Zag
---- Option to plot Last True Non-Painted Signal label
---- Option to plot Fibonacci retracement levels to last known Zig-Zag high/low
based on highest/lowest of 2 trend changing up/down Heikin Ashi candles
---- Type of trade can be opted from indicator settings.
Plots RSI Color Candles
Note : This script is a good tool to get confirmations but Trade Signals cannot be used as definitive entry/exit points. This is the reason why there are no alerts coded for the signals.
Also, this script generates signals the same way as one of my first scripts, Alcides Indicator Lite, but has more trade options + more utilities to choose from indicator settings.
GBP-USD 1hr on Swing trade mode
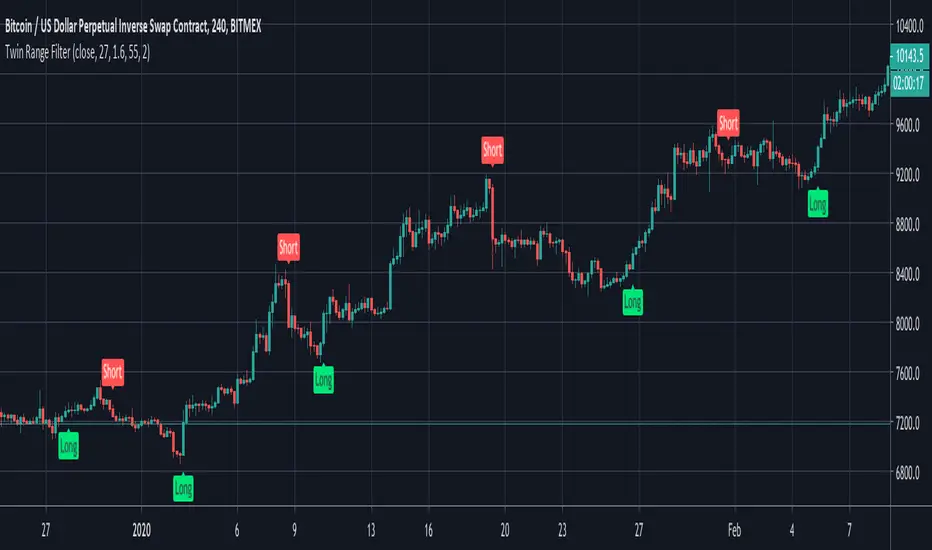
Twin Range FilterAn experiment to combine two range filters and plot the average of both to smooth out the signals.
This works significantly better than the typical ATR set-up, but there's still too much noise here to set and forget with bots. Use it as the basis of your own system with additional filtering on top.
TS - Multiple Timeframe RSI ScreenerWhat is it?
Simple signal and alert based indicator that lets the user use 1-4 different period RSI indicators overlayed on top of eachother.
- Up to 4 RSI indicators overlayed at once
- All time periods use within the indicator are customisable to fit the traders needs
- Buy & Sell alerts built in
Access
This is one of our free indicators in our trading suite. Just PM me for access!

VPTbollfib & Camarilla (Danarilla)I do not own the original indicators. This is just a combination of the two because of their nature to work in a similar way.
Camarilla Pivots run on the basis of intraday range trading. Usually after daily open you look the fade whatever move happened before. by shorting R3/H3 levels or longing R3/L3. Targeting the other side of the range. This is the infamous PivotBoss level calculations and you would want to activate camarilla and turn off the normal pivots. They use the previous days volatility to plot the next days levels.
But what about some confirmation?
Well RafaelIzoni (who made it open source for improvement) threw together this VPTbollfib. It is volume price trend crossing down a fib line using bollinger bands as price envelope. The beauty of this is that It will signal usually counter to current price action based on selling into uptrends or vise versa. Meaning you get signals to counter price. Which is what you might be looking for on range day trade scalps for camarilla. A wick reversal or engulfing + volume based signal is a very happy pairing together. And those signals are usually suitable for the target of the range you are day trading. Hourly time frame works quite well for both. And camarilla should also be on daily settings.
Special Thanks to Nanda (who published the pivotboss indicator AND) Helped to merge the scripts together.
This indicator alone is an entire trade system. Camarilla already is. If you know the rules. it can be used for entries, exits, risk management to trade the range on TREND, COUNTER TREND, and BREAKOUT plays. The bollinger band fibs add confirmation to the trends levels. And the VPT adds a secondary confirmation to take a camarilla trade.
Try it out. I think you will find both the levels on camarilla and the VPT signals quite suprising.

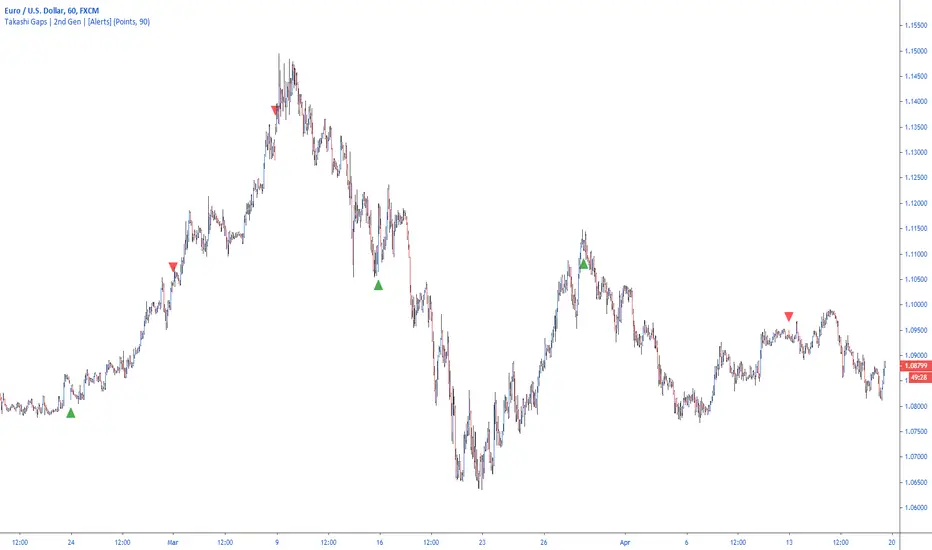
Takashi Gaps | 2nd Gen | [Alerts]Spot gaps between bars and benefit from the correction of the market as the price restores its position.
Inputs
Value In
Options input. Defines if the gap between bars will be checked by Points or Percent.
Gap Size
Float input. Value to trigger a signal if the gap between bars is bigger than.
To get access to this and other scripts check links below.
Rogue Profit Alert IndicatorThis is a complex script developed to measure specific volatility parameters and enter trades based on predetermined rules which are proprietary and will not be released, so don't ask for specific indicator settings.
This indicator accompanies the "Rogue Profit Strategy" and can be used for creating alerts based on the strategy's performance. Please read the more in depth description on the "Rogue Profit Strategy" page. Make sure the input parameters are the same for both the Strategy and Indicator to insure accurate signals.
This is a very powerful and profitable script that will simplify your trading and has been in development and tested for three years. Message for details on how to obtain access. Please allow up to 24 hours for a response.

LuxAlgo® - Signals & Overlays™Signals & Overlays™ is an all-in-one toolkit made up of more than 20+ features primarily focused on generating useful signals & overlays to fulfill any trader's technical analysis needs with relevant data.
Created directly with TradingView Pine Script Wizard, alexgrover - this is a first of its kind comprehensive script made fully from the ground-up to provide an all-in-one solution for traders.
Signals & Overlays™ can be used alongside other forms of technical analysis, however, it was also designed to be used as a stand-alone toolkit that can fit any trading style. Every feature included considers how not all technical indicators fit every market condition.
The ideal way to utilize this indicator is to explore through all of the features over time, pick & choose 2-3 features best suit your style of trading, and stick with those to create your own unique LuxAlgo trading strategy.
Providing Endless Possibilities Catering To All Trading Styles
Signals & Overlays™ works in any market for discretionary analysis & includes many features:
Beginner-friendly Presets to enable multiple features at once within one-click (locks other settings when enabled).
Confirmation Signals: Normal & Strong signals to help traders confirm trends (not to be followed blindly).
Contrarian Signals: Normal & Strong to help traders spot reversals (also not to be followed blindly).
Exit Signals: "x" marks that apply for both Confirmation Signals & Contrarian Signals to suggest potential take-profit areas during signals.
Signal Optimization Methods: Sensitivity / Agility, optimal sensitvity parameter displayed on dashboard, and Autopilot (dynamic setting).
Candle Coloring: Purple/Green/Red to visualize trends developing between 'normal' & 'strong'.
6+ Indicator Overlays that helps traders visualize trends, find reversal points, and get dynamic areas of support & resistance.
Filters within "Presets / Filters" to allow users to filter Confirmation Signals with Indicator Overlays & other metrics within LuxAlgo Premium.
A complete dashboard with highly actionable metrics such as Trend Strength, current volatility, volume analysis, etc.
Advanced Settings to display customizable TP/SL points, further enhance signal optimizations, & customize dashboard size/location.
Full Any Alert() Function Call Conditions included
Highly useful Filtered Alert Creator section to generate custom filtered signal alerts with Indicator Overlays & other metrics.
+ more. (Check the changelog below for current features)
🔶 USAGE
Basic Signals & Candle Coloring Demonstration
In the image below we can see a basic example of how these 2 core components function within Signals & Overlays™.
As explained earlier, the Confirmation Signals can generate normal labels as well as strong labels marked by the "+" symbol. These signals are directly correlated to the candle coloring in order to see the development of trends & navigate through different market conditions as best as possible.
The candle coloring comes especially in handy when using signals, whereas a positive sign for an uptrend to occur rather than a fake-out is to see candles consistently hold as green. This indicates the market is strong & is likely to continue an uptrend. Vice versa for sell signals & the candles holding as red.
Normal Confirmation Signals often occur with smaller trends, retracements within larger trends, or just as signals a user may not want to trust as much directly. In order to enhance your ability to trust signals more & find more actionable use cases out of LuxAlgo Premium, we recommend going to the settings menu of the indicator & activating some indicator overlays. These are covered in the next section.
🔶 INDICATOR OVERLAYS W/ SIGNALS
In the image below we have enabled the "Smart Trail" & "Reversal Zones" indicator overlays from within the settings of Signals & Overlays™. By using these overlays alongside the signals & candle coloring, users can find more confluence to create trading strategies or plans.
The Smart Trail provides an excellent area of dynamic support/resistance for traders, as well as an additional confluence for general trend following purposes alongside the Confirmation Signals.
The Reversal Zones are particularly useful for areas to immediately take profit on trades, however, during strong trends price may continue rising or falling through the Reversal Zones which makes a good use case of waiting for price to first exit the Reversal Zones before considering the next move in the market.
In the next image below we can see the market is generally ranging, making it more complicated for the standard Confirmation signals to perform greatly as they are meant to excel for finding developing trends. This image displays the Contrarian Signal Mode, Contrarian Gradient candle coloring, as well as the Trend Catcher Indicator Overlay to help us trade these market conditions specifically.
Paired with the Contrarian based candle coloring, these signals can be helpful to a trader looking to find confluent reversals. You can also see the Trend Catcher indicator overlay gives a hybrid approach to analyzing the underlying trend within this price action.
Some traders naturally are Contrarian in nature, so this signal mode may be of primary interest to them, however, most of the use cases will come from the standard Confirmation sigals paired with other overlays or regular technical analysis.
🔶 SIGNALS WITH AI CLASSIFICATION
Our toolkit is able to classify generated signals using a simple machine learning algorithm into four levels. These levels indicate if a signal will most likely indicate a trend continuation (level 3/4) or a reversal/retracement (1/2).
Users are able to filter out certain signals depending on their classification, only keeping signals of interest and potential filtering out false signals.
🔶 FILTERS
In the next image below we can see after resetting the Signals & Overlays™ indicator to it's defaults, we have simply enabled the "Smart Trail Filter" from within the Presets / Filters section at the top of the settings.
By doing this, we can filter out signals that are not aligned with the Smart Trail indicator overlay, which gives direct confluence in every signal that generates on the chart.
Applying filters to signals do not necessarily make them instantly "better" than using the indicator without them. Between every technical indicator, there are trade-offs. So while we can now use Confirmation signals & retests of the Smart Trail as great optimal entry points, at times the indicator may miss signals or retests of the Smart Trail.
The same is seen below with another one of the Filters within Signals & Overlays™; Trend Strength Filter.
We can see the indicator is using the Trend Strength metric to only generate Confirmation Signals that align with a trending market which can clean up a lot of noise during retracements as well as ranging markets.
However, the trade-off present now with this filter enabled is that at times the indicator will miss trends, in which we'd still need to be aware of the price action, candle coloring, or other forms of analysis to give us indications the market may start a new trend opposed to just relying on signals directly.
🔶 CONCLUSION
We believe that success lies in the association of the user with the indicator, opposed to many traders who have the perspective that the indicator itself can make them become profitable. The reality is much more complicated than that.
The aim is to provide an indicator comprehensive, customizable, and intuitive enough that any trader can be led to understand this truth and develop an actionable perspective of technical indicators as support tools for decision making.
You can see the Author's instructions below to get instant access to this indicator & our LuxAlgo Premium indicator suite.
🔶 RISK DISCLAIMER
Trading is risky & most day traders lose money. All content, tools, scripts, articles, & education provided by LuxAlgo are purely for informational & educational purposes only. Past performance does not guarantee future results.

Theft Indicator - BUY/SELL AlertsWhat is our indicator?
Theft Indicator - Buy & Sell Alert System is our first published script that shows price action on a certain period of time (We Use ATR indicator). We take pride in enabling trading to become easier for the experienced and the non-experienced traders around the globe. Buy & Sell alerts will be fired once a conditions in our algo is met.
Does it Repaint?
Our indicator does NOT re-paint. Although while setting an alert it may pop up the repaint alert, please take into consideration that once a signal is fired on a "CLOSED BAR", our signal will never disappear, they do not repaint.
What Markets is it usable with?
You can use it in any market, Forex, Stocks, Crypto, Indices. We recommend high time frames but you can also use it on the 1 minute chart if you are a scalper and a risk taker. All time frames are profitable, not all trades. But the Majority is profitable. We will soon add a backtest strategy for it, there is no ETA on it tho.
How to use:
Simple plug and play it to your chart, in addition to a few other indicators we will recommend to you (we still have not published them yet), and this will confirm your trades. You can also connect TV alerts with a bot and let it run. Please be aware that SLIPPAGE time is important, If you run a bot on this indicator you HAVE to know that the buy/sell price will be on the bar AFTER the Candle close (For example: the BUY/SELL alert is on a candle, the buy/sell your bot or you will execute WILL be in the following candle depending on your trading system. Theft Indicator - Buy/Sell Alerts work best with higher time frames, however it works on smaller time frames, we recommend 15 mins, 30 mins, 1hr, 4hr. It just depends on your trading style. Please contact us if you do not understand how to use it.
How are the Buy/Sell Alerts fired?
We use the simple ATR (Average True Range) indicator. However we have modified the indicator to fit our trading system. Check below for a definition of what ATR is:
What is Average True Range - ATR?
The average true range (ATR) is a technical analysis indicator that measures market volatility by decomposing the entire range of an asset price for that period. Specifically, ATR is a measure of volatility introduced by market technician J. Welles Wilder Jr. The true range indicator is taken as the greatest of the following: current high less the current low; the absolute value of the current high less the previous close; and the absolute value of the current low less the previous close. The average true range is then a moving average, generally using 14 days, of the true ranges.
Why is our indicator special and different from the normal ATR indicators?
We have modified the mathematical equation and changed it slightly to give more accurate signals, we do not promise all trades are profitable, the use of this indicator is up to your own judgement and liability. We believe that we have an indicator like no other ATR because of our algo that is different from the normal ATR calculation.
P.S: This is not financial advice, we are just sharing our indicator that we know has good results, and it will take time for people in -ve profiles to recover losses and for the profiting to be more profitable.
You can contact me for more information about the indicator, Goodluck :)

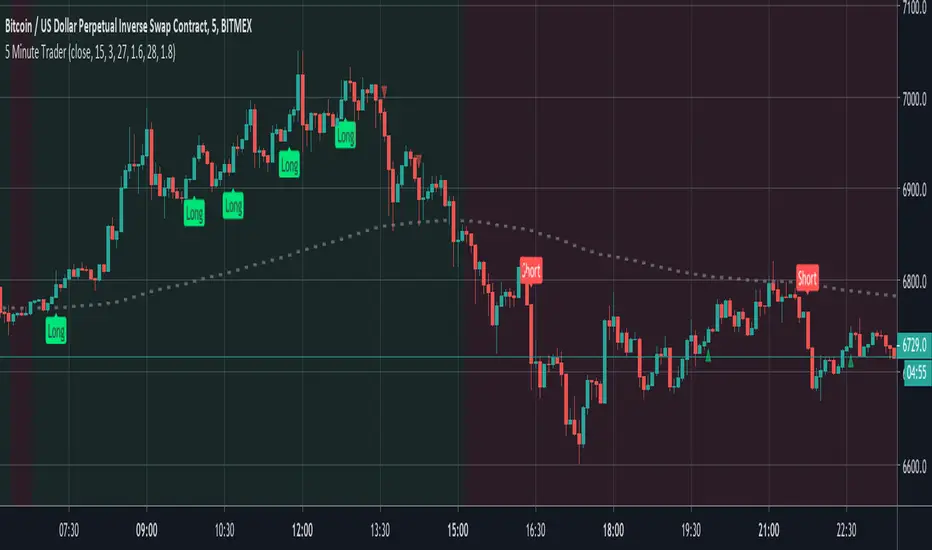
5 Minute TraderBy request, this is an amalgamation of my most popular indicator features but tailored for lower timeframes.
Signals are generated by simple EMA crosses (with adjustable values) in the direction of the current trend and then validated against a scoring system that's comprised of 20 other indicators. When the majority of them agree then the trade can be taken. The tolerance score that permits a trade can be adjusted within the indicator preference panel and the values can be printed above/below the candle to help you tune your entry points.
To further reassure you, the smoothed candle direction from the 4 hour chart is printed in the background to validate the trend direction and a floating trade helper panel translates the scores in to practical terms (buy, sell etc)
Alerts are built in.
Note: This is a premium script. Please DM me for access.
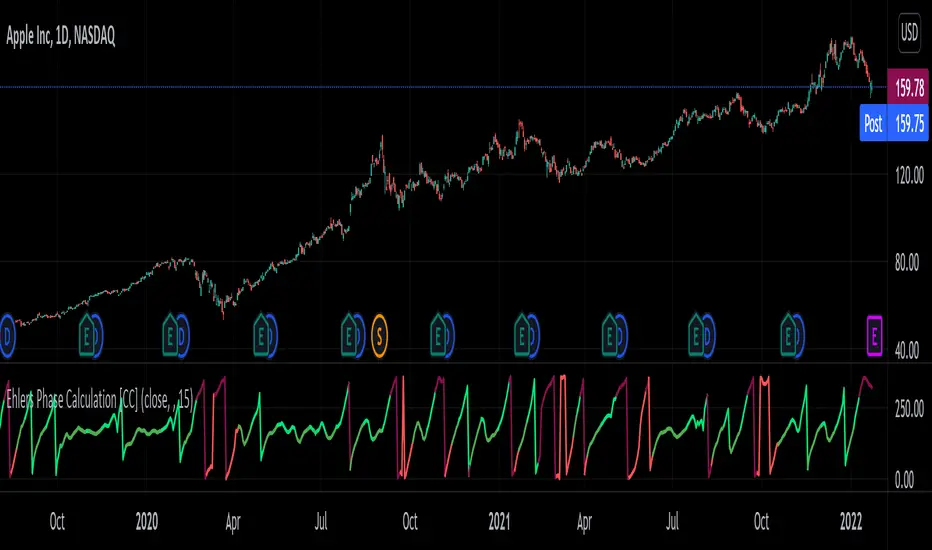
Phase CalculationPhase Calculation was authored by John F. Elders in the Stocks and Commodities Magazine 11/1996
This indicator will tell you if the stock is in a uptrend or downtrend. A phase number with a low number means it is in a uptrend and a phase number with a high number means it is in a downtrend.
Let me know if you want to see me write code for different indicators!
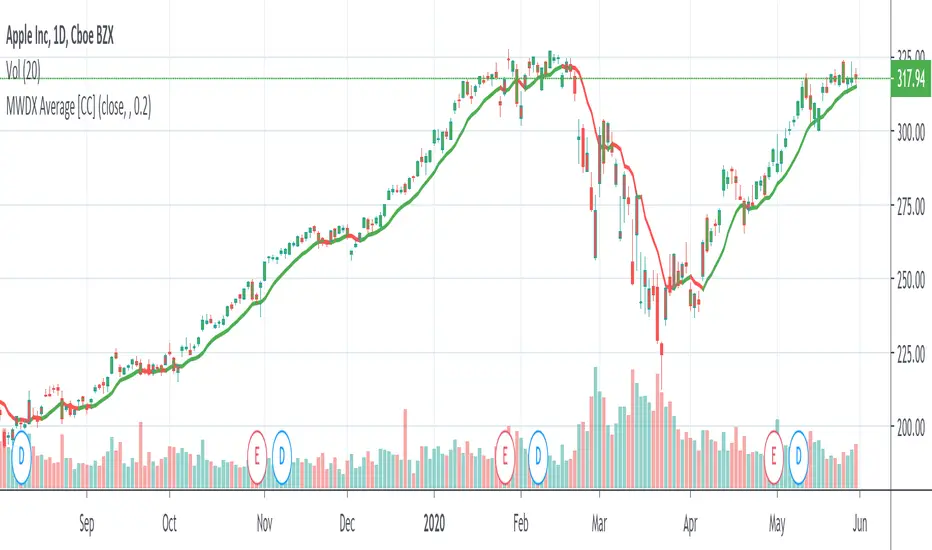
MWDX AverageThis is a variation of an exponential moving average which follows the price pretty smoothly. Feel free to change the factor to adjust how closely it follows the price. I set the default to 0.2
Let me know if you want me to write code for any other indicators!
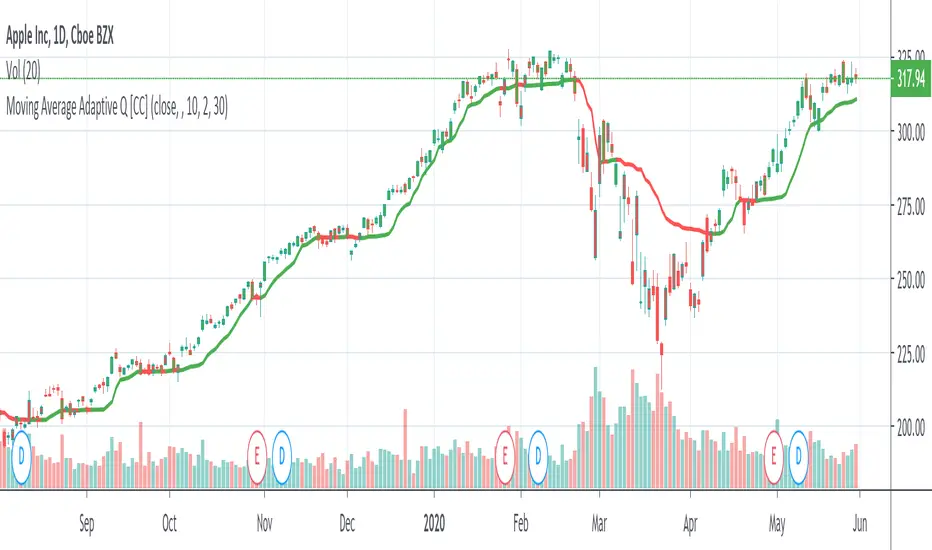
Moving Average Adaptive QThe Moving Average Adaptive Q (MAAQ) was authored by Perry Kaufman in the Stocks and Commodities Magazine 06/1995
This is similar to his Kaufman Adaptive Moving Average with a few changes. This is a pretty close moving average which I like quite a bit. Try it and let me know what you think.
Send me a message and let me know what other indicators you would like to see!