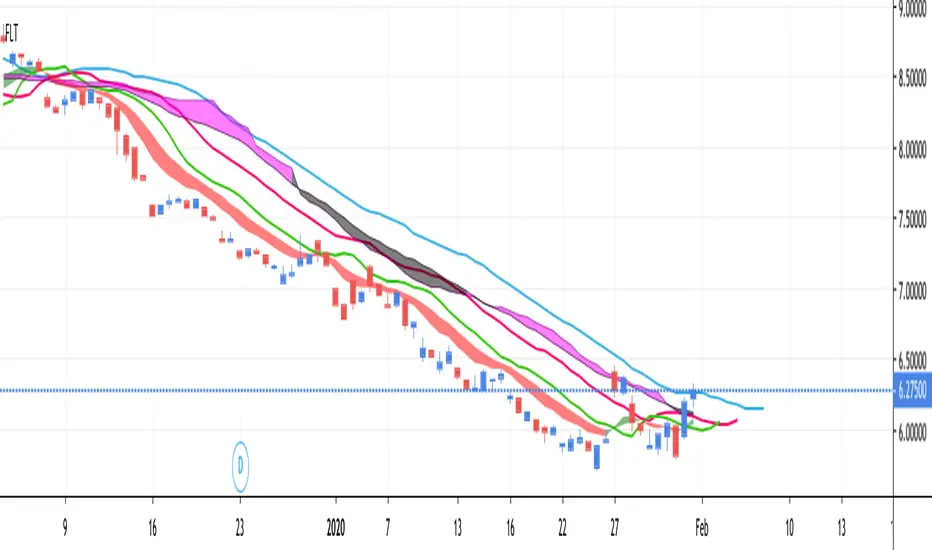
FLT - Fully Loaded TacoThis is a very full indicator.
NOTICE: By default, ALL indicators are turned off in the settings, except for the Bollinger Band, in order to facilitate faster load times.
Features can easily be turned on/off in the settings. You can have as many or as few as you want.
FEATURE LIST:
3 SMAs (Fast, Medium, Slow)
3 EMAs (Fast, Medium, Slow)
Support & Resistance Lines (Lime Color)
Parabolic Support & Resistance (Red dots above, Blue dots below)
Keltner Channel (purple channel lines)
Bollinger Band (Blue Cloud; Center & Borders hidden by default)
TTM Squeeze (Purple Background Color on Chart)
VWAP (Vibrant Blue Glowing Line, Intraday Only)
Fibonacci Retracement (Multicolor, Intraday Only)
Ichimoku Cloud (Standard Colors)
Sma
CriptoImpulso - InOut The script evaluates several indicators such as moving average, exponential moving average and other indicators, to make a decision and show a possible opportunity for entry and exit. In addition to the entry and exit, pivots are provided based on the values of daily closures, to find supports and resistances.
This script works with low timeframes (1,3,5,15) and is easy to use, the green label arrows below the candles show the possible entries and the magenta label arrows above the candles show the possible exits.

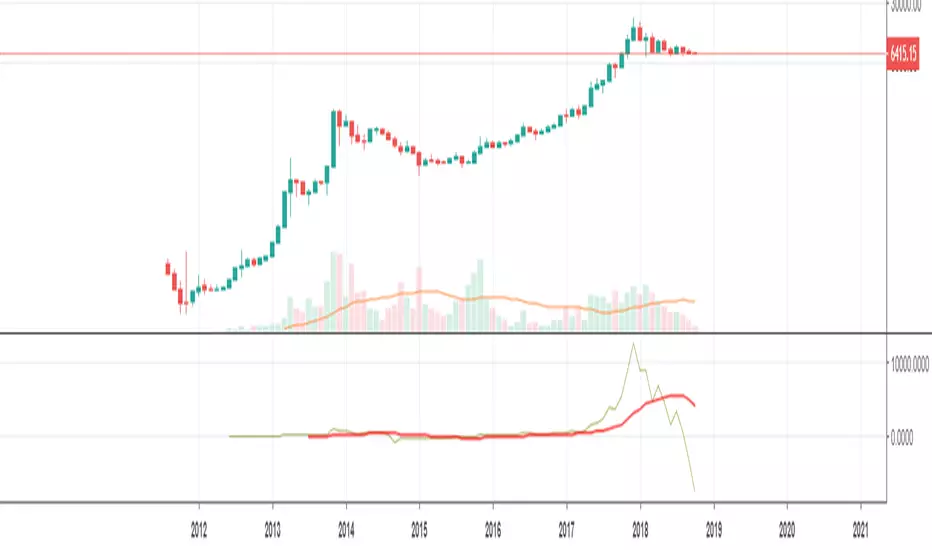
Multi Z Score [DW]This is an experimental study using z scores of multiple sampling periods to analyze price trends.
Z score measures the number of standard deviations price is from its mean.
In this study, z scores are calculated over a Fibonacci sequence of sampling periods from 3 to 4181.
The scores are then averaged with equal weighting, resulting in a display of long term trend with short term sensitivity.
Custom bar colors are included. The color scheme is based on the perceived trend from the average z score.

DYNAMIC SUP/RES 2.0Dynamic support/resistance generator.
It is volume based script which generates real time support and resistance levels.
Features:
- range finder
- high resistance zone finder
- fibonacci based support resistance levels
- stoploss
- 4x EMA
- 2x SMA
Enjoy and trade safe.

Derivative OscillatorThis indicator was originally developed by Constance (Connie) M. Brown (Journal of Technical Analysis (Winter-Spring 1994, 45-61): "Derivative Oscillator: A New Approach to an Old Problem").

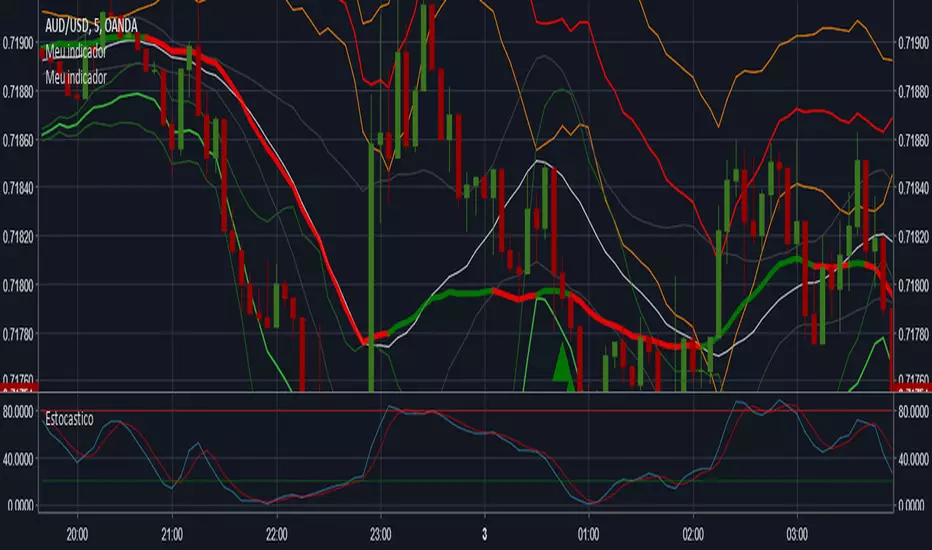
Signals for call and putSorry for the Google Translate English
Indicator for signals of call and put, using Bollinger bands (period 20, standard deviation 2.5), market trend of (sma, períod 100) and stochastic (period 20, %D 3).
I was overthrown but in pine scrip, the function "stoch()" no way to smooth (3). If anyone knows how to smooth inside the script, help me! Please.
With smoothed stochastic the hit rate grows a lot.
Português (Pt-Br)
Indicador de sinais de compra e venda, usando bandas de Bollinger (período de 20, desvio de 2,5), tendencia de mercado com (sma período 100) e estocástico (período 20, %D de 3).
Eu travei porque no pine script, a função "stoch()" não tem como aplicar a suavização (3). Se alguem souber como suavizar dentro do script, me ajude! Por favor.
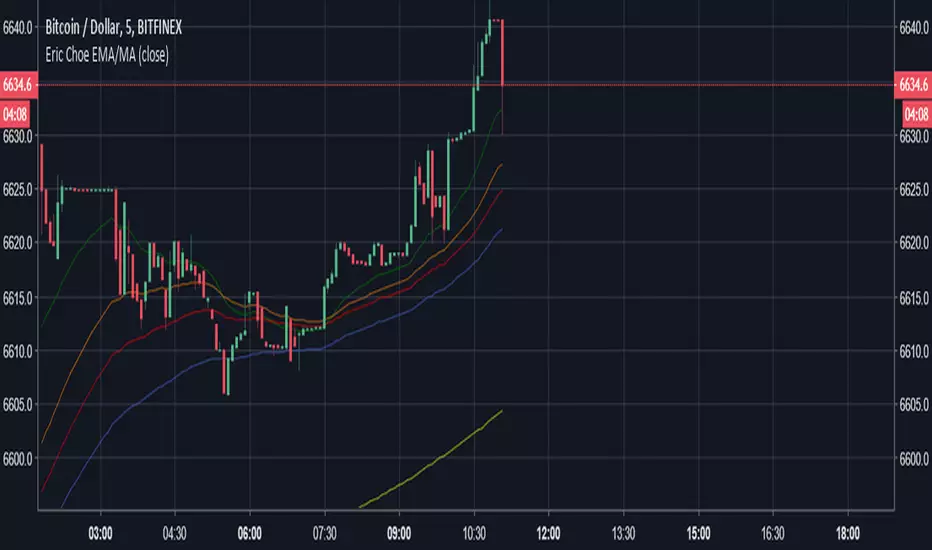
Eric Choe EMA/MAThis is Eric Choe's moving averages.
This indicator is really helpful on trading the trend with his EW (Elliot Wave) trading system
Emas Teo ZuñigaEmas Teo Zuñiga is programmed by Ruben Jaramillo
This trading system analyzes the crossover of two exponential moving averages (period of 8 and 18) to generate buy and sell signals.
The strategy opens a buy position when the 18-bar moving average crosses above the 8-bar moving average and only if the same crossover occurred at least once during the previous 20 bars.
The strategy opens a sell position when the 18-bar moving average crosses below the 8-bar moving average.
The trading system doesn't contain any other rules such as stops or money management scripts. It can be applied to the stock, ETF, futures and Forex market.
By running an optimization, you can create several simulations or backtests with different EMA periods and then look for the best EMA cross parameters. The first period will vary from 5 to 50 and the second one will vary from 12 to 120. (8, 18, 50 by default)

[ALERTS] MA Cross ElevenThis script is a crossing of eleven different MA, with alerts and SL and TP.
The simplest is what works best.
SMA --> Simple
EMA --> Exponential
WMA --> Weighted
VWMA --> Volume Weighted
SMMA --> Smoothed
DEMA --> Double Exponential
TEMA --> Triple Exponential
HMA --> Hull
TMA --> Triangular
SSMA --> SuperSmoother filter
ZEMA --> Zero Lag Exponential
Using "once per bar close" repaint is 0%, but if you like risk can choose "once per bar", better profit.
Thanks to JustUncleL and his amazing sripts.

4 Bollinger Bands and 2 Exponential Moving Averages This script contains multiple indicators of 3 types for better visibility and without having to select multiple indicators one by one and hence saving your time and energy. Also, minimum number of variables are being used in the script for better calculation speed and implementation .
This script is best suited for beginners who are not using pro version and finding it difficult to implement more than 3 indicators on a single chart layout :)
Indicators used :
1. Hybrid of Simple Moving Average and Bollinger Bands .
In this Indicator user can use total of 4 Moving Averages or 4 Bolinger Bands or both (eg: 3 Bolinger bands and 1 Simple Moving Average).
> How to use :
If you want to use Bollinger Bands simply check the boxes of all the 'Upper' and 'Lower' Bands under indicator format/settings.
Else if you want to use Simple Moving Average simply uncheck the boxes of all the 'Upper' and 'Lower' Bands under indicator format/settings.
Tip : You are free to experiment with the format/settings to use both Simple Moving Average and Bollinger Bands using 'MA Length' and 'StdDev'
(standard deviation).
2. Exponential Moving Average
In this indicator user can use 2 Exponential Moving Averages .
> How to use :
If you want to use 2 Exponential Moving Averages simply check 'Enable 2nd EMA' under format/setting inputs.
Else if you want to use only 1 Exponential Moving Average simply uncheck 'Enable 2nd EMA' under format/setting inputs.
Tip : You are free to experiment with both 'EMA_Length1' and 'EMA_Length2' and change it as per your requirments.
//Feel free to ping/DM me for any explaination on how to use this script as your ultimate trading strategy.

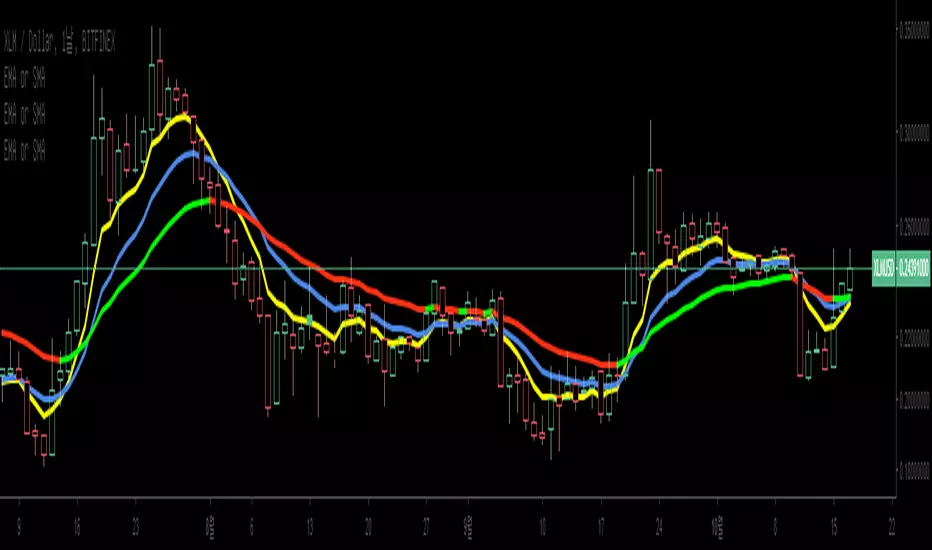
EMA or SMA slope Indicator and alarmIf exponential is checked in setting, it is EMA. If unchecked, it is SMA.
The color changes according to the slope of the moving average line.
When the slope of the moving average line changes, the alarm can be set according to UP and DOWN.
지수이동평균선 또는 기본이동평균선 기울기 표시기 및 알람 지표 입니다.
설정에서 exponential 을 체크하면 EMA 이며 체크하지 않으면 SMA 입니다.
이동평균선의 기울기에 따라 컬러가 바뀝니다.
이동평균선의 기울기가 바뀔때 UP,DOWN에 따라 알람을 설정 할 수 있도록 하였습니다.
Multi Moving Averages by Atilla YurtsevenFrom time to time, we both need to add multiple moving averages. I wanted to make it a bit easier.
Multi Moving Averages support 6 different moving averages and can plot up to 10 at the same time.
Supported moving averages
Simple Moving Average - SMA
Weighted Moving Average - WMA
Exponential Moving Average - EMA
Rolling Moving Average - RMA
Linear Moving Average - Linear
Ranking - Rank
By enabling Advanced Mode, you will be able to select different moving average types and different sources for each moving average.
This is not a financial advice and published for educational purposes only!
Happy trading
Atilla Yurtseven

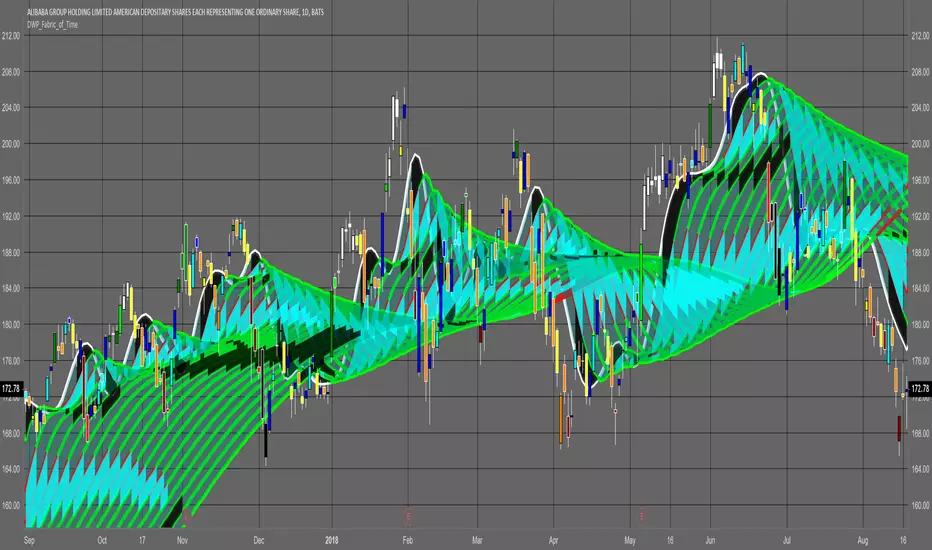
DWP_Fabric_of_TimeHello, The following is an indicator I wrote that shows the resistance or support created by the contraction or expansion of moving averages of price over time. The theory is that the areas created by either the decline or acceleration of sma lines are caused by either fear or excitement in the market thus marking the area for future support or resistance to take place. The light blue blocks indicate a decrease in expansion till no expansion. The dark black blocks indicate a decrease in contraction till no contraction. Both blocks can be support or resistance. Once a block is breached look for a reversal. if the block is penetrated over half-way then it will usually continue to the other side before reversing. Their is a multiplier in the script to allow expansion of the indicator. I have also added a bar color indicator for the strength of the move. This can be turned on or off in settings. The colors are paired up as such.
Up = aqua, blue,green, lime,white. | Down = yellow, orange,maroon, red,black.
Hope this helps visualize the market.
Good Trading MoveTrap
12 SMA Ribbon -30d(50,100,200)This ribbon uses SMA of 12 inputs for traders mainly trading stocks.
A market is assumed to have 30 working days in a month
Author: O.A.

12 SMA Ribbon - 22dThis ribbon uses sMA of 12 inputs for traders mainly trading stocks. A market is assumed to have 22 working days in a month
Author: O.A.

[ProfitTrailer] SMA Cross StudyProfitTrailer SMACROSS study for buy/sell strategies.
The script highlights the regions where trailing is most likely to succeed.

5 Moving Averages (SMA, EMA)5 moving averages in 1 indicator. Choose between SMA and EMA for each moving average.
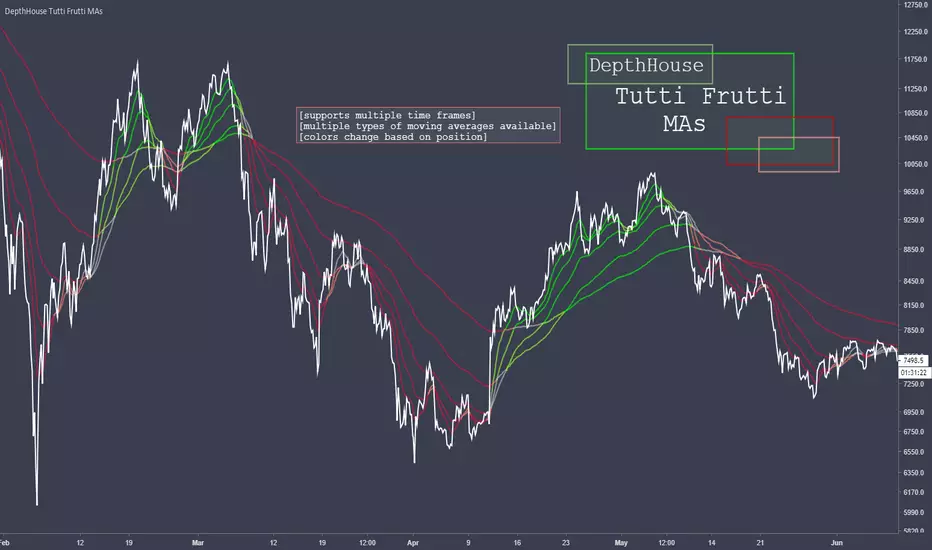
DepthHouse Tutti Frutti Moving AveragesDepthHouse Tutti Frutti Moving Averages combines the use of up to 5 Moving Averages that change colors based upon their position.
This indicator has full MTF support (multiple-time-frame). Meaning you can lock the moving averages to a specific time frame.
Currently Supported MA types:
SMA
EMA
SMMA
Hull MA
WMA
Multiple Time Frame Option
My favorite feature is the ability to lock the displayed moving averages to a specific time frame.
Say you wish to view the 30 min chart while keeping the 60 minute moving averages. Just turn this feature on!
This is a free indicator so please enjoy!
Leave questions and requests in the comments below!
Emiliano Mesa Moving AverageThe Emiliano Mesa Moving average is a completely custom moving average based on support and resistance levels calculated through several variables in any timeframe. The Emiliano Mesa Moving Average, or EMMA works as any simple moving average, however it does involve support and resistance levels which can be turned on and used to show where the price is likely to reverse, or how much strength the trend has in order to keep going above or below it.
Furthermore, the EMMA indicator as most moving averages won't seem to work properly on range markets. However, you can in fact avoid entering a range market by turning on Support and Resistance 1 in the settings. When the price is inside the support and resistance 1 moving averages you can tell the price may have a difficult time trying to get out, indicating the trend is not as strong and we may be stuck for a while...
Along the same lines, I've noticed that when the EMMA and its S/R 1 lines are very close together, the stock/commodity/crypto/pair/etc. is less likely to make a harsh move in the opposite direction of the trend.
Again this is only version one of my custom moving average... Please be sure to leave some positive feedback or general feedback!
Feel free to use it and tell me your experience!
Contact info:
emilianomesauribe2000@live.com

[PT] SMA Cross Buy/Sell studyProfitTrailer study for SMA Cross buy/sell strategies.
The script highlights the regions where trailing is most likely to succeed.


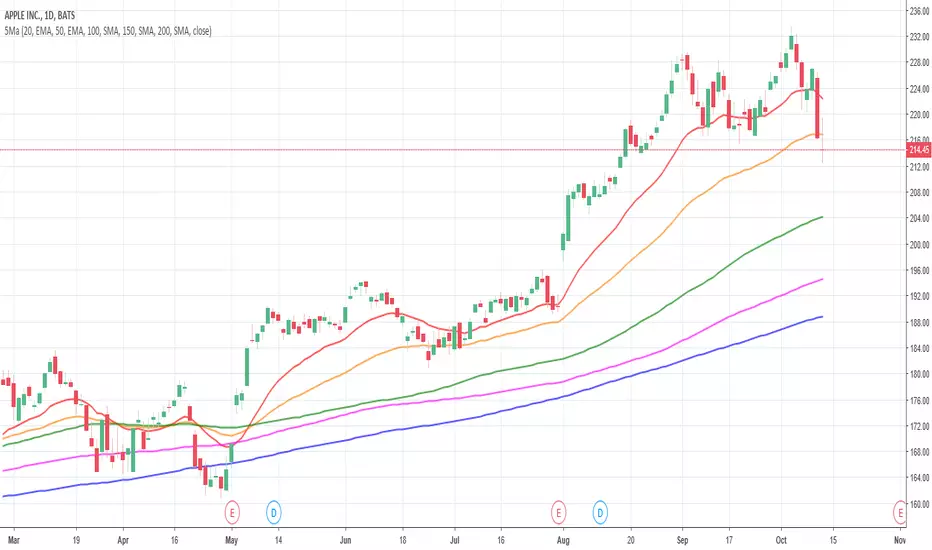
4 SMA's (20, 50, 100, 200)4 SMA's in a single indicator (can hide/show all at once).
Suitable for all markets, particularly for long term analysis.
