SMMA slope deviation alertThis indicator alerts when the deviation of close value from SMMA is more than 30% of the average deviation for the last 14 bars. The period of SMMA can be adjusted.
This indicator has 3 hardcoded timeframes so there is almost no sense what timeframe you use. It gathers data from 15m, 1H and 4H timeframes and combines then on one chart.
The markers are drawn one over another, for example, if you set 1H timeframe on you chart green markers from 15m can be placed under the same 1h-candle where the blue one lights on 1H. The algo is made to lower the risks of traders, so if you use 15m timeframe you will see green marker but if you use 1H you will see the blue marker on 1H (and don't see the green one because the blue is over the green). This is somewhat a "hardcoded scalp screener". You can "zoom in" and "zoom out" the row of markers by toggling between 15m and 1H and 4H but conditions for the signals are the same.
Black and blue markers light when the price is too far from the SMMA . "Too far" means that deviation is greater than the average deviation (for 14 bars) multiplied by 1.3.
Red and green markers light when besides the condition mentioned above, the price change is accelarating. Acceleration is considered in terms of the speed of running from SMMA . if SMMA was crossed by the priceline less than 8 bars ago and now it went so far that the condition of 30% is triggered then red and green markers light.
Sma

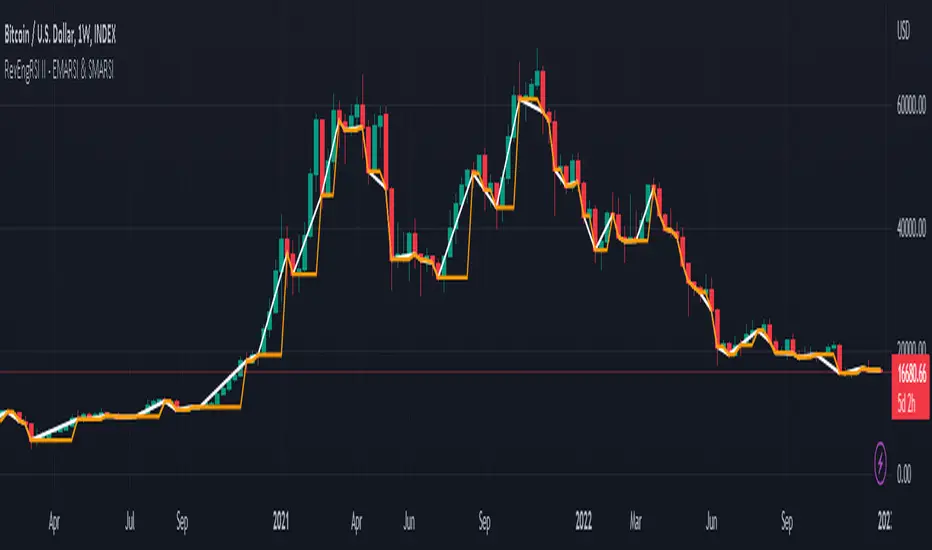
Reverse Engineering RSI II - EMARSI and SMARSIThis is the Reverse Engineering EMARSI and SMARSI Indicator.
It’s based on the work of Giorgos Siligardos on Reverse Engineering RSI.
The Reverse Engineering EMARSI and SMARSI Indicator shows the Exponential Moving Average and the Simple Moving Average of the RSI line but plotted in the price chart.
This script is also a complement of "Reverse Engineering RSI, by Giorgos Siligardos" script by HPotter but can also be used alone.
By default the RevEngSMARSI is turned off.
The RevEngEMARSI is the white line.
I’ve also added to the indicator:
1) Simple Moving Average (MA) of the EMARSI (EMARSI SMA) - Orange Line
2) Standard Deviation Bands for the EMARSI SMA - turned off by default
Using the settings I left in default (Length's = 1), we can see that when the EMARSI SMA is horizontal the price rises and so does the EMARSI. Also when the EMARSI SMA rises that's a signal that there is a resistance/support at that price. We can observe such thing if we draw horizontal lines at those prices. We can use this to help us put stop-losses and take profits. Also, those resistance/suport prices are ALWAYS the closing price of the first red candle after a bullish trend (big or small trends). Interesting...
When the EMARSI SMA rises and touches the EMARSI 3 things can happen:
- Bullish Trend slows down
- Correction of price
- Trend reversal
So, when the EMARSI SMA rises that can be interpreted as a signal for taking profits.
We should always wait for the price to close in the timeframe we're using, because sometimes the EMARSI SMA rises before the closing price and flattens again when is about to close.
However we should never take decisions based on 1 indicator. Our trading decision should always take in consideration multiple sources of information.
Of course we can use other settings for the trading. And if we do that we will observe different behaviours. And we should also study those behaviours. We can then use the crosses between the lines.
If there is something wrong with the code or its calculations, please let me know.
If you want to modify or improve the code, feel free to do that, but please let me know the changes you made.
This Indicator works in all timeframes. I hope you enjoy it!
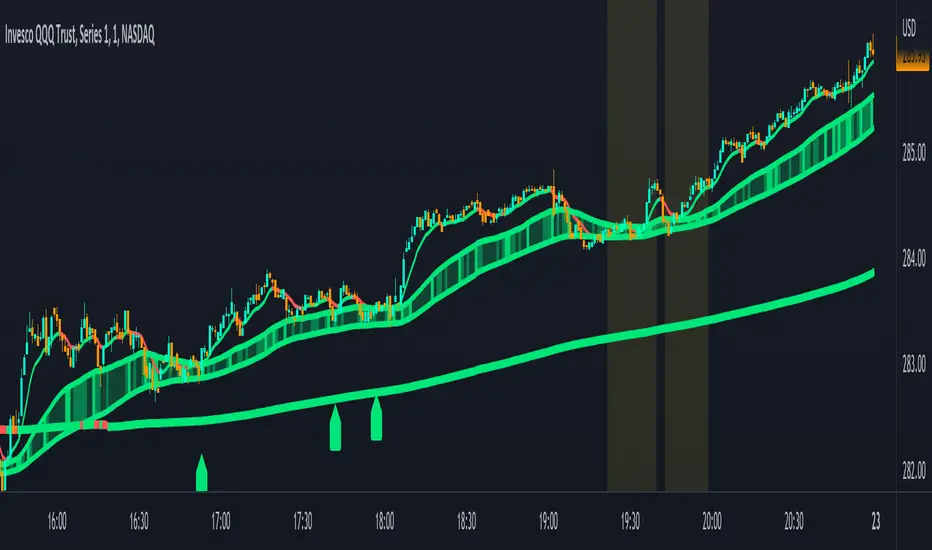
Combined Moving Averages + Squeeze & Volume Spike SignalsThis is a set of 4 combined moving averages. Each moving average is a combination of an EMA, SMA, HMA, RMA, WMA and VWMA with the same length as set in your input settings. All 6 of them are added together and then divided by 6 for an average of all of them. This is based on the theory that most traders use their own preference of moving averages, so combining them all should give us a better idea of where price should actually react since we are using the average of what most traders are using on their charts. It also smooths the moving averages out as well so you get a much easier to read moving average than any of them on their own which should help you hold positions longer and time your entries better.
The default lengths used for this indicator are as follows: 10, 50, 100 and 500. These lengths can be updated in the settings. The 10 and 500 will change colors when the individual moving average is less than or greater than its previous value. Price above or below the moving average does not affect the colors. The 50 and 100 are colored based on whether the 50 is greater/less than the 100.
The two middle length moving averages by default are the 50 and 100. This has been turned into a cloud because it is the area where price typically bounces, since tons of traders use the 50 and 100 moving averages. This should be your long/short zone when price is trending.
Each moving average can be set to use a different source such as close, open, high, low, ohlc4, etc. You can also adjust the length of each moving average. Default settings work well, but feel free to customize them to your liking. You can also change the colors of the lines in the settings.
Beware that changing the lengths of MA #2 and MA #3 will change the signals, squeezes and the cloud.
VOLUME SPIKES
The cloud will change to a brighter color when a volume spike is detected. When a major volume spike is detected, it will turn very bright colored green/red according to the direction of the cloud. This notifies you of volume spikes so you have a better idea of how strong the trend is. If the cloud is a dark green/red then that means that volume is less than or equal to the recent median volume.
SIGNALS
There are also signals that will be given when the current candle is in the cloud, the candle is going in the same direction as the cloud, the MA #2 and MA #3 is going in the same direction and a volume spike is detected. These help you identify good entries when markets are trending. Be cautious of these signals when the trend is sideways and not clearly moving in one direction. The signals can be turned on or off in the settings.
SQUEEZE
Many times when moving averages squeeze together, a big move happens shortly after. Because of this I added a yellow background color when a squeeze is detected. It looks at the median value difference of the MA #2 and MA #3 and if the current value difference is less than the median multiplied by the multiplier in the settings then it will change the background color to notify you. The default value of the multiplier is .6, meaning the squeeze signal will only show if the current value difference of the cloud is less than .6 of the median difference. The multiplier can be adjusted in the settings to suit your preferences. Lower values will only show tighter squeezes.
MARKETS
This indicator can be used on all markets including stocks, crypto, futures and forex.
TIMEFRAMES
This indicator can be used on all timeframes.
PAIRINGS
We recommend pairing this combined moving average with Trend Friend Swing Trade And Scalp Signals for extra confluence. Look for price to bounce in the cloud with good volume and a confirming signal from Trend Friend for highly probable moves.
TRIX With Moving Average - Didi's Needles setupTrix with Moving Average ( SMA or EMA ) and Fill Color. Pre-set for the Didi's Needles setup
Length: Trix Length
Use Ema: True will use an EMA , False will use an SMA .
Moving Average: Moving average used in the TRIX value.
Fill: True will fill the interior between the Trix and the MA with the color of the line above it.
-------
Trix com Média Movel ( MMS e MME) pré configurado para o setup de Agulhadas do Didi
Length: Comprimento do Trix
Use Ema: Verdadeiro usará uma MME , Falso usará uma MMS .
Moving Average: Média móvel utilizada no valor TRIX .
Fill: Verdadeiro irá preencher o interior entre o Trix e a MA com a cor da linha que está em por cima

Centered Moving AverageThe Centered moving averages tries to resolve the problem that simple moving average are still not able to handle significant trends when forecasting.
When computing a running moving average in a centered way, placing the average in the middle time period makes sense.
If we average an even number of terms, we need to smooth the smoothed values.
Try to describe it with an example:
The following table shows the results using a centered moving average of 4.
nterim Steps
Period Value SMA Centered
1 9
1.5
2 8
2.5 9.5
3 9 9.5
3.5 9.5
4 12 10.0
4.5 10.5
5 9 10.750
5.5 11.0
6 12
6.5
7 11
This is the final table:
Period Value Centered MA
1 9
2 8
3 9 9.5
4 12 10.0
5 9 10.75
6 12
7 11
With this script we are able to process and display the centered moving average as described above.
In addition to this, however, the script is also able to estimate the potential projection of future data based on the available data by replicating where necessary the data of the last bar until the number of data necessary for the calculation of the required centered moving average is reached.
If for example I have 20 daily closings and I look for the moving average centered at 10, I receive the first data on the fifth day and the last data on the fourteenth day, so I have 5 days left uncovered, to remedy this I have to give the last value to the uncovered data the closing price of the last day.
The deviations work like the bollinger bands but must refer to the centered moving average.

Trend Slope Meter - KaspricciTrend Slope Meter
This indicator measures the slope of the trend defined by a moving average or an external source. The slope is calculated by the change of price in ticks for a defined number of bars divided by the number of bars.
Settings
Source - Default: close price. Used to calculate the moving average as basis for slope measurement. Can be an external source of a different indicator as well. In case you select an external source, you can disable the moving average calculation.
Moving Average Settings
Type - Default: EMA. Type of moving average calculation. All provided out of the box by TradingView.
Length - Default: 50. Length used to calculate moving average.
Slope Settings
Length - Default: 50. Length used to calculate slope.

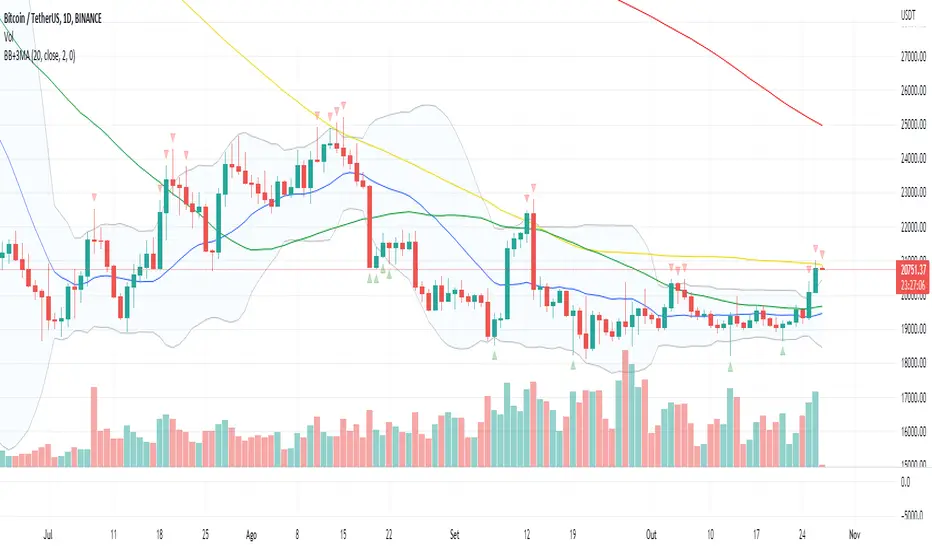
Bandas de Bollinger + 3 Medias Moviles SimplesDenota de una forma poco invasiva, cuando el precio alcanza las Bandas de Bollinger, y permite apreciar al mismo tiempo las medias móviles de 200,100 y 50 a fin de estar alerta a sus cruces, nos obstante, dicho indicador, debe ser apoyado junto con otros indicadores en los mercados financieros que estén al alza o a la baja.
Descargo de responsabilidad: Este contenido los datos, indicadores y valores reflejados, es solo para fines informativos y no debe interpretarse como asesoramiento legal, fiscal, de inversión, financiero o de otro tipo.
FieryTrading: Buy The Dip - Sell The RipDear Tradingview community,
Today I want to share a very powerful, yet easy to use indicator with you. The indicator will find local tops or bottoms and will help you determine when it's a good time to trade a potential reversal.
How does it work?
The indicator makes use of the RSI to detect extremities and waits until the RSI reverses. Furthermore, a long-term moving average is used to determine whether we're in bullish or bearish market conditions. In bullish conditions the indicator will only go long, in bearish conditions the indicator will only go short.
How do I use it?
Favorite the indicator and apply it to your chart! You can add an alert to the indicator to receive a message once it has detected a good point for a reversal trade.
The indicator can be used on all assets and on all timeframes. Personally, I've found the 1 - 4 hourly timeframes to yield the best results.
Good luck!

SUPER MULTI MOVING AVERAGE [Gabbo]📈 Moving Average Indicator Update - Version 2
🔹 New Features and Improvements:
1️⃣ Enhanced MA Selection for Table Lines:
Previously, the indicator did not allow users to choose a different Moving Average type for the table lines. Now, you can select the MA type for the table.
2️⃣ New Table Text Customization Inputs:
Added inputs to choose the table text color and size for a more personalized display.
3️⃣ Improved Input Visibility and Organization:
We’ve reorganized the inputs so that the most commonly used options are now placed at the beginning for quicker and more convenient configuration.
4️⃣ Bug Fixes and Code Improvements:
Minor bugs have been fixed, and the code has been optimized for improved stability and performance. The code is now cleaner and fully functional in version 6.
5️⃣ Cometreon Public Library Integration:
To lighten the code and improve modularity, we’ve integrated the Cometreon public library. This makes the code more efficient and reduces the need to duplicate common functions.
☄️ With this update, the Moving Average indicator becomes even more versatile and user-friendly, offering a refined table interface and enhanced customization options!

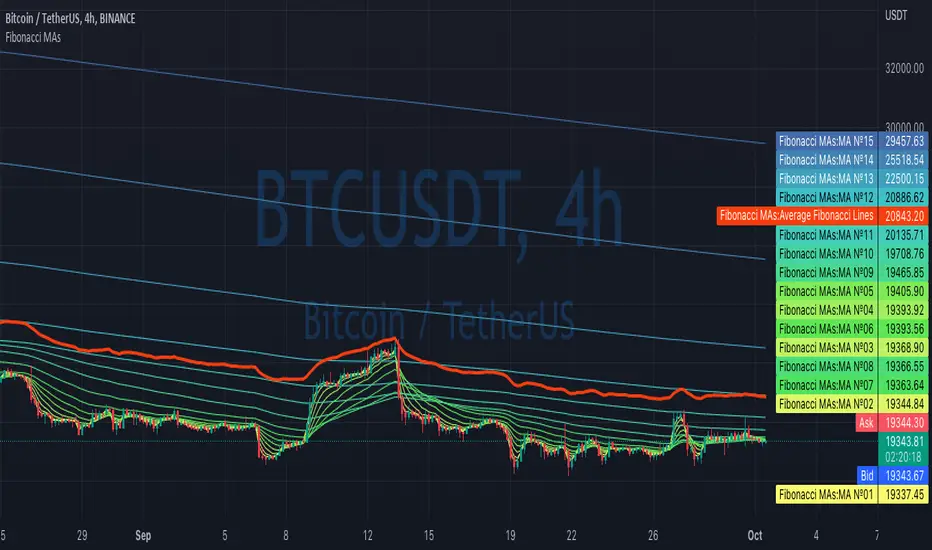
Fibonacci MAsIt's a pretty simple script. Idea is to compute MAs with the length of Fibonacci numbers and then compute an average of them all.
In the script, you can choose the type of MAs and how many Fibonacci numbers to use for it.
You can also adjust the length of these MAs manually and choose the color of every one of them.
Thanks to @MUQWISHI for helping me code it.
Disclaimer
Please remember that past performance may not be indicative of future results.
Due to various factors, including changing market conditions, the strategy may no longer perform as well as in historical backtesting.
This post and the script don’t provide any financial advice.
Relative Strength Index with fast and slow MAsThis is the typical Relative Strength Index indicator with two moving averages, one slow (length 50 by default) and one fast (length 20 by default). Additionally, there are four lines, which mark the oversold/overbought signals at different levels, there are two inner bands with values at the levels 40, and 60, and two outer bands at the levels 20, and 80. The presence of the fast and slow moving averages and their crossover/crossunder with the oversold/overbought levels or the RSI can provide more insightful and faster signals. The indicator has a slightly different colouring mechanism.
The views of the RSI indicator on the above the price chart in both dark and light modes:

NSDT MA+ADXThis script combines Moving Averages with ADX Strength, but with an added bonus. Rather than having the Moving Average line always plot on the chart, it will reference the ADX strength based on the settings by the trader.
This way, the Moving Average will not show on the chart unless there is also a strong direction in the trend. This may potentially be used to help with entries when trend trading due to adding the ADX for trend strength.
In the examples below, the ADX settings in the MA+ADX indicator are matched with the settings of a standalone ADX indicator at the bottom of the chart (not included, just for reference).
MA+ADX
prnt.sc
ADX Only
prnt.sc
You will see how the MA only plots when the ADX is over the threshold, currently set at 25. (arrows drawn to indicate confluence)

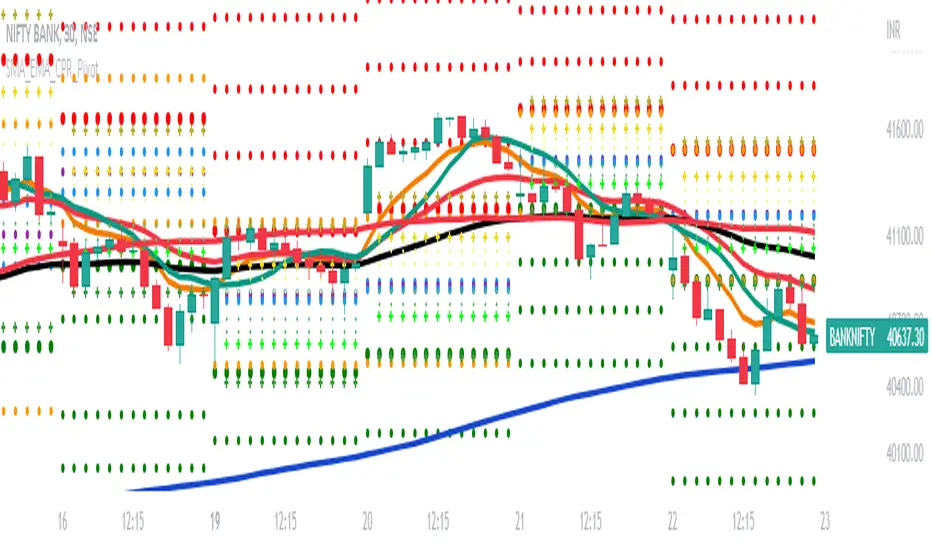
SMA_EMA_CPR_PivotThis Script can do multiple jobs in single indicator.
Like -:
Plot 3 SMA as per your inputs.
Plot 3 EMA as per your inputs.
Plot CPR Levels.
Plot Pivot Levels.
Plot Previous Day High Low.
Indicator can used in Intraday stock trading, Positional Trading and options trading.
Please Enjoy.
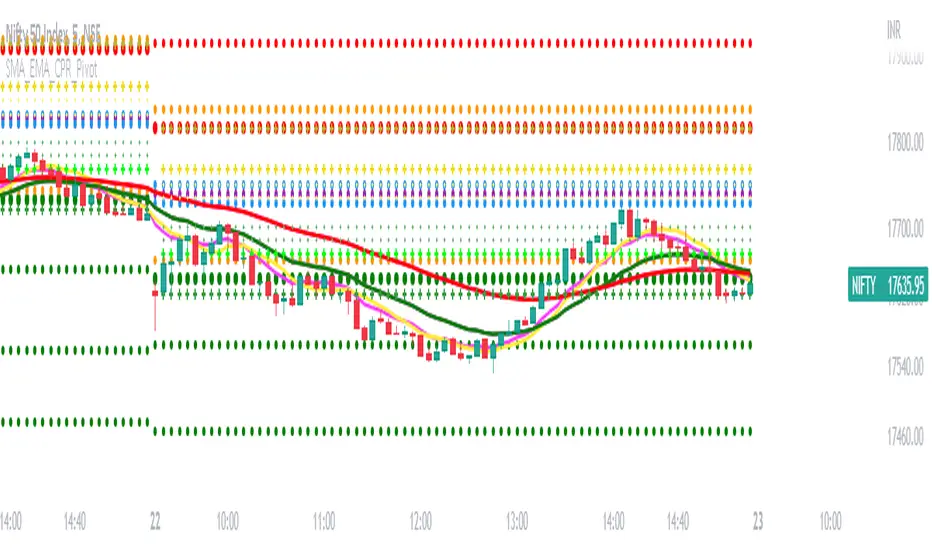
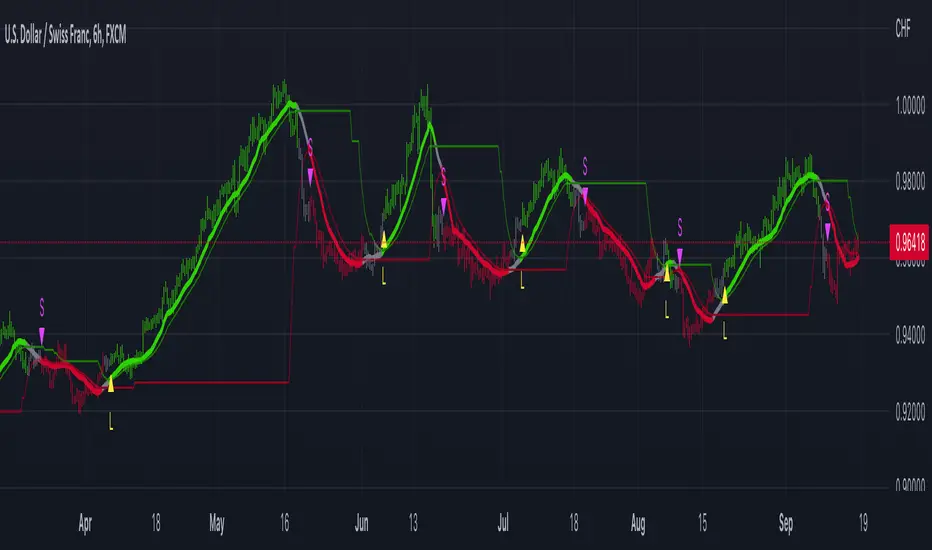
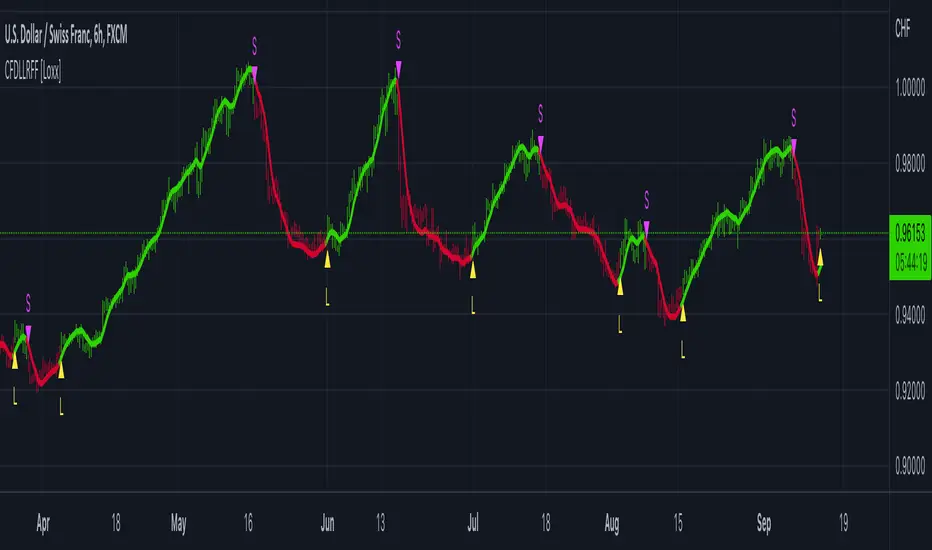
Fractal-Dimension-Adaptive SMA (FDASMA) w/ DSL [Loxx]Fractal-Dimension-Adaptive SMA (FDASMA) w/ DSL is a fractal-dimension-index-adaptive SMA. The SMA is accelerated during a trend and slowed down during a sideways market, so as to avoid false signals. This indicator uses the fractal dimension to compute an ingest period length into the SMA to output the FDASMA.
What is the Fractal Dimension Index?
The goal of the fractal dimension index is to determine whether the market is trending or in a trading range. It does not measure the direction of the trend. A value less than 1.5 indicates that the price series is persistent or that the market is trending. Lower values of the FDI indicate a stronger trend. A value greater than 1.5 indicates that the market is in a trading range and is acting in a more random fashion.
What are DSL Discontinued Signal Line?
A lot of indicators are using signal lines in order to determine the trend (or some desired state of the indicator) easier. The idea of the signal line is easy : comparing the value to it's smoothed (slightly lagging) state, the idea of current momentum/state is made.
Discontinued signal line is inheriting that simple signal line idea and it is extending it : instead of having one signal line, more lines depending on the current value of the indicator.
"Signal" line is calculated the following way :
When a certain level is crossed into the desired direction, the EMA of that value is calculated for the desired signal line
When that level is crossed into the opposite direction, the previous "signal" line value is simply "inherited" and it becomes a kind of a level
This way it becomes a combination of signal lines and levels that are trying to combine both the good from both methods.
In simple terms, DSL uses the concept of a signal line and betters it by inheriting the previous signal line's value & makes it a level.
Included
2 Signal types
Alerts
Loxx's Expanded Source Types
Bar coloring
Clutter-Filtered, D-Lag Reducer, Spec. Ops FIR Filter [Loxx]Clutter-Filtered, D-Lag Reducer, Spec. Ops FIR Filter is a FIR filter moving average with extreme lag reduction and noise elimination technology. This is a special instance of a static weight FIR filter designed specifically for Forex trading. This is not only a useful indictor, but also a demonstration of how one would create their own moving average using FIR filtering weights. This moving average has static period and weighting inputs. You can change the lag reduction and the clutter filtering but you can't change the weights or the numbers of bars the weights are applied to in history.
Plot of weighting coefficients used in this indicator
These coefficients were derived from a smoothed cardinal sine weighed SMA on EURUSD in Matlab. You can see the coefficients in the code.
What is Normalized Cardinal Sine?
The sinc function sinc (x), also called the "sampling function," is a function that arises frequently in signal processing and the theory of Fourier transforms.
In mathematics, the historical unnormalized sinc function is defined for x ≠ 0 by
sinc x = sinx / x
In digital signal processing and information theory, the normalized sinc function is commonly defined for x ≠ 0 by
sinc x = sin(pi * x) / (pi * x)
What is a Generic or Direct Form FIR Filter?
In signal processing, a finite impulse response (FIR) filter is a filter whose impulse response (or response to any finite length input) is of finite duration, because it settles to zero in finite time. This is in contrast to infinite impulse response (IIR) filters, which may have internal feedback and may continue to respond indefinitely (usually decaying).
The impulse response (that is, the output in response to a Kronecker delta input) of an Nth-order discrete-time FIR filter lasts exactly {\displaystyle N+1}N+1 samples (from first nonzero element through last nonzero element) before it then settles to zero.
FIR filters can be discrete-time or continuous-time, and digital or analog.
A FIR filter is (similar to, or) just a weighted moving average filter, where (unlike a typical equally weighted moving average filter) the weights of each delay tap are not constrained to be identical or even of the same sign. By changing various values in the array of weights (the impulse response, or time shifted and sampled version of the same), the frequency response of a FIR filter can be completely changed.
An FIR filter simply CONVOLVES the input time series (price data) with its IMPULSE RESPONSE. The impulse response is just a set of weights (or "coefficients") that multiply each data point. Then you just add up all the products and divide by the sum of the weights and that is it; e.g., for a 10-bar SMA you just add up 10 bars of price data (each multiplied by 1) and divide by 10. For a weighted-MA you add up the product of the price data with triangular-number weights and divide by the total weight.
Ultra Low Lag Moving Average's weights are designed to have MAXIMUM possible smoothing and MINIMUM possible lag compatible with as-flat-as-possible phase response.
What is a Clutter Filter?
For our purposes here, this is a filter that compares the slope of the trading filter output to a threshold to determine whether to shift trends. If the slope is up but the slope doesn't exceed the threshold, then the color is gray and this indicates a chop zone. If the slope is down but the slope doesn't exceed the threshold, then the color is gray and this indicates a chop zone. Alternatively if either up or down slope exceeds the threshold then the trend turns green for up and red for down. Fro demonstration purposes, an EMA is used as the moving average. This acts to reduce the noise in the signal.
What is a Dual Element Lag Reducer?
Modifies an array of coefficients to reduce lag by the Lag Reduction Factor uses a generic version of a Kalman velocity component to accomplish this lag reduction is achieved by applying the following to the array:
2 * coeff - coeff
The response time vs noise battle still holds true, high lag reduction means more noise is present in your data! Please note that the beginning coefficients which the modifying matrix cannot be applied to (coef whose indecies are < LagReductionFactor) are simply multiplied by two for additional smoothing .
Things to note
Due to the computational demands of this indicator, there is a bars back input modifier that controls how many bars back the indicator is calculated on. Because of this, the first few bars of the indicator will sometimes appear crazy, just ignore this as it doesn't effect the calculation.
Related Indicators
STD-Filtered, Ultra Low Lag Moving Average
Included
Bar coloring
Loxx's Expanded Source Types
Signals
Alerts
VWAP+SMA+EMAThis is the only indicator combing the results of VWAP + 2 SMAs + 2 EMAs.
This is a free indicator. Enjoy using it.
Kunal Jain
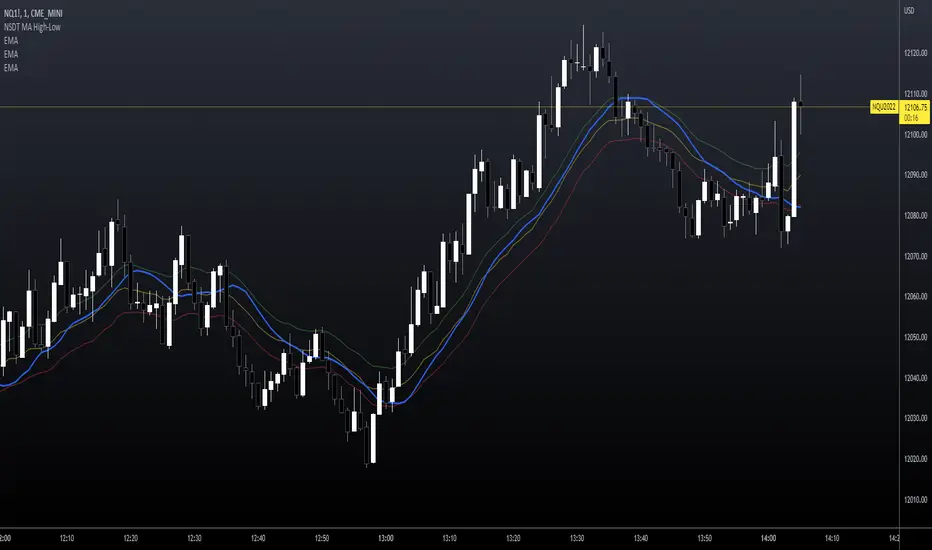
NSDT MA High-LowThis may seem like a pretty basic Moving Average indicator but I haven't seen one that changes the calculation point depending if the market is going up or down.
I've added three EMA's (length of 20) on this sample chart to demonstrate the differences. These are not included with the indicator.
Green, EMA calculated on High
Red, EMA calculated on Low
Yellow, EMA calculated on Close (default)
Blue, EMA calculated on HIGH when rising but on LOW when falling. (looks at 3 candles back to gauge direction)
* * * Note you can choose between 5 different Moving Average types
Notice how the Blue line (when going up it's calculated on the High) is catching up to the Green line (which is already calculated on the High)?
Notice how the Blue line (when going down so it's calculated on the Low) is catching up to the Red line (which is already calculated on the Low)?
This gives a faster response in the direction of the market because it switches between calculating on the High or Low based on market direction.
This script is free and open source.
OHLC Moving AverageThis indicator shows 4 moving averages of Open, High, Low and Close at the same time with an option to select SMA or EMA.
If you implement this indicator twice, you can make it look like the following chart.
One set of MA(red) is for current timeframe and another set(blue) is for higher timeframe, which is to identify potential support and resistance zones.
--------------------------
四本値(始値、高値、安値、終値)それぞれの移動平均線を同時に表示することのできるインジケーターです。
MAタイプはSMAかEMAを選択することができます。
このインジケーターを二つセットすると以下のように上位足の移動平均線とセットで表示することも可能です。
(赤がチャートの時間軸の4本値の移動平均線、青が上位足の4本値の移動平均線)
上位足の移動平均線をサポート・レジスタンスのゾーンとして捉える時などに活用できます。

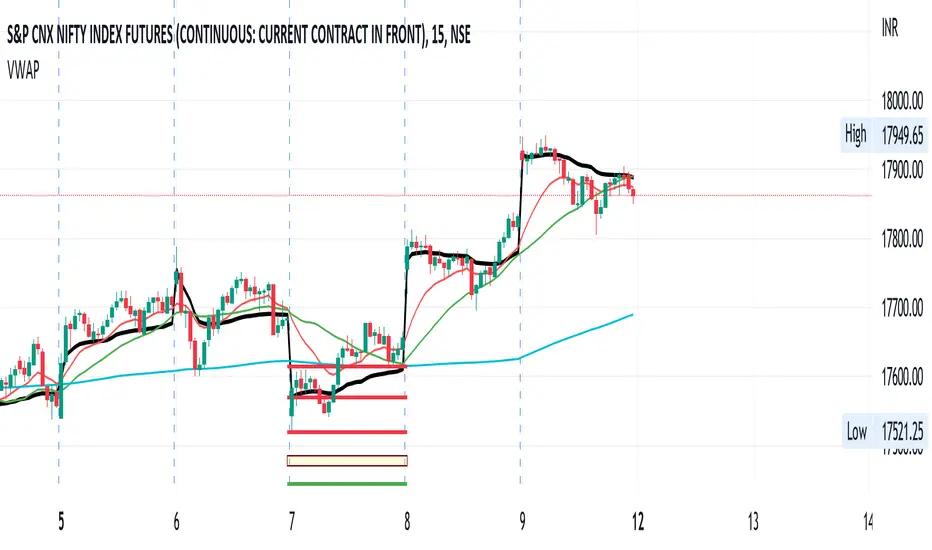
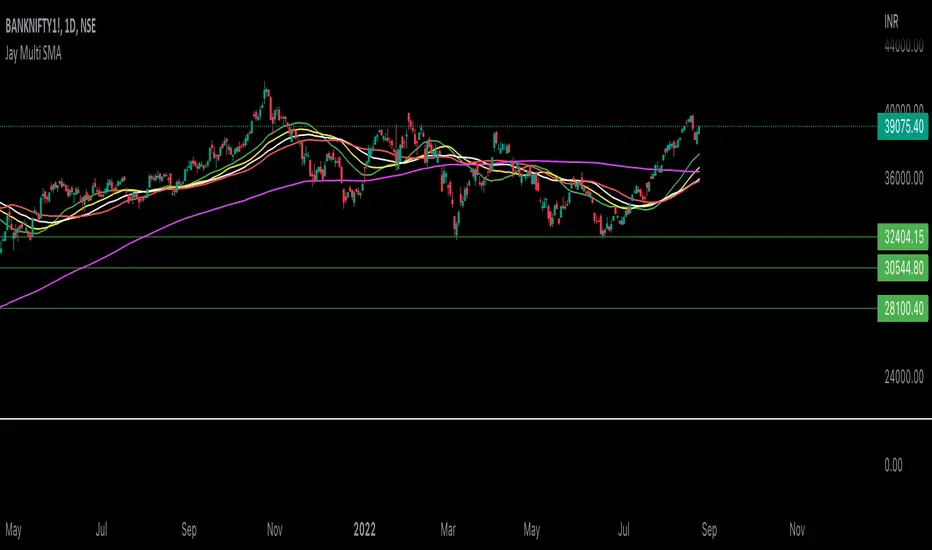
Jay Multi SMAIt's strategy of swing & positional trades.. It's based on the concept of crossing of SMA with there diff length...
Percent above or Below Moving Average Candle colourFilter:
If green candle is 'x' % above moving average than colour of candle is turn in blue colour.
If red candle is 'x' % below moving average than colour of candle is turn in orange colour.

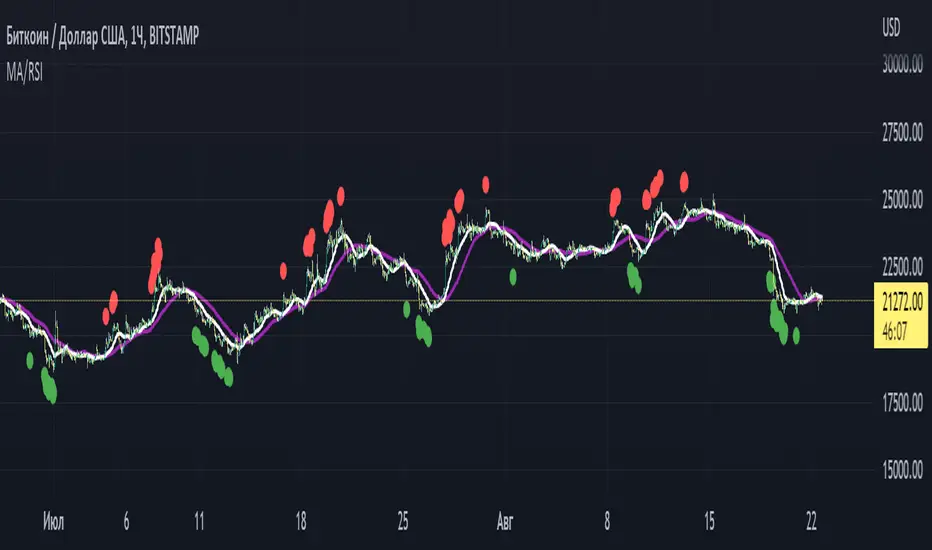
Pranoyama MA/RSI toolEng: The indicator highlights the overbought and oversold RSI levels on the bars. Also draws two moving averages: sma or ema. The RSI levels, the type of moving averages and their period are set by the user.
Rus: Индикатор подсвечивает на барах уровни перекупленности и перепроданности по RSI, а так же рисует две скользящие средние на выбор: sma или ema. Уровни RSI, тип скользящих средних и их период устанавливаются пользователем.
p.s. Это адаптация ранее опубликованного мной индикатора
TradingCube : Moving Average : Data tablePlots moving average both EMA as well as SMA on Multiple timeframes at once in a Tabular Format
for rapid indication of momentum shift as well as slower-moving confirmations.
Displays EMA/SMA 5 8, 13, 21,34,55,89,100,200,400 by default as well as provide the users the flexibility to choose the timeframe as per their set up.
