Adaptive Bollinger BandsThis is part 3 of 11 in the system named Ninetales/Volt V2 you can find on Tradingview.
It simply measures all of the combinations of the defined parameters for Bollinger Bands, and returns the most logically accurate values.
Use it however you would use standard Bollinger Bands, just add your preferred values to test against each other, and set the period you would like for it to backtest.
Standard Deviation

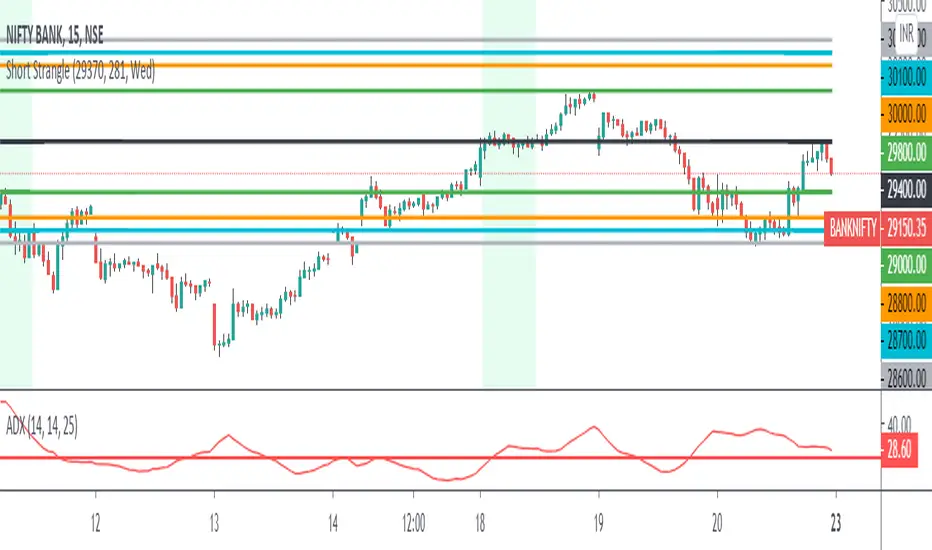
3 Leg Short Strangle BandsDraws 3 leg bands along with safe zone(green lines) based on input
1) Input ATR, Week Day, Current Market Close
2) Input ATR - Previous day 1H Max ATR
3) ADX < 25
4) Input Current Market Close
5) Trading Day - Mon/Tue/Wed/Thu/Fri - Bands distance calculated based on day M/Tu/F 2*(Max ATR), W/Th 1.5(ATR)
6) Safe zone green lines - CMPCls +/- (1.5 * Max ATR)
7) Leg 1 Upper Lower Legs - M/Tu/F - CMPCls +/-(2 * Max ATR), W/Th - CMPCls +/-(1.5 * ATR)
8) Leg 2 & 3 Calculates based on Leg 2 = Leg 1 +/- 100 pts distance, Leg 3 = Leg 2 +/- 100 pts distance'
9) All figures rounded to nearest 100's
10) Safe zone broken exit all positions
This is a popular technic used by Profitable traders on sideway markets for Intraday
One can keep 3K as SL per 1 set of 3 legs for better R:R
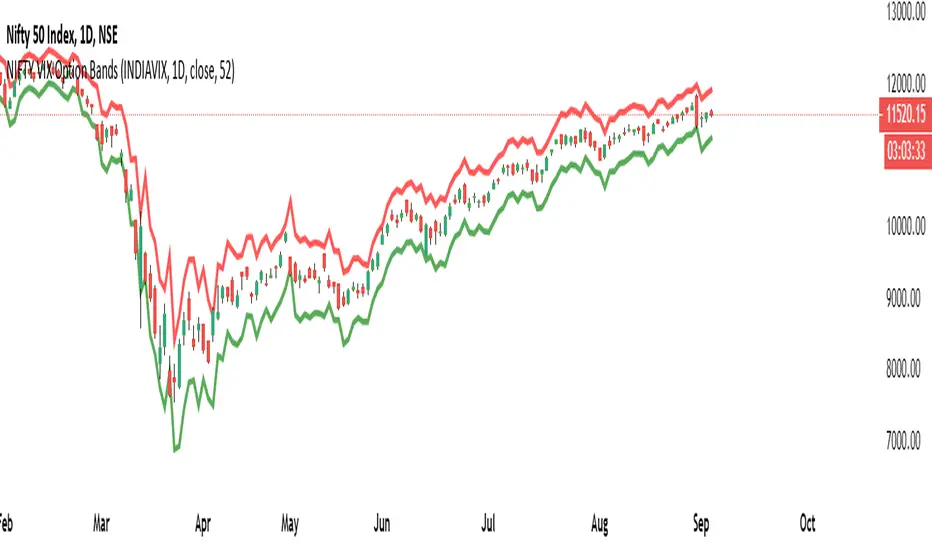
NIFTY VIX Bands1) The script takes current INDIA VIX as input Daily time frame for NIFTY
2) Used a Formula VIX Value / Square root of Time Period
3) Change Timeframe input accordingly 1 Year = 1, Monthly = 12, Weekly = 52, Daily = 365
4) based point 2 formula with 1 standard deviation it creates upper & lower range bands
5) This is generally used for option selling by big traders they go and sell above the band strikes
Standard Deviation Volatility HelperHere is a simple Standard Deviation Line based on supply and demand that will help you to find expected move easily. 3 Standart Deviation merged line available. Number of days and adjustable length.

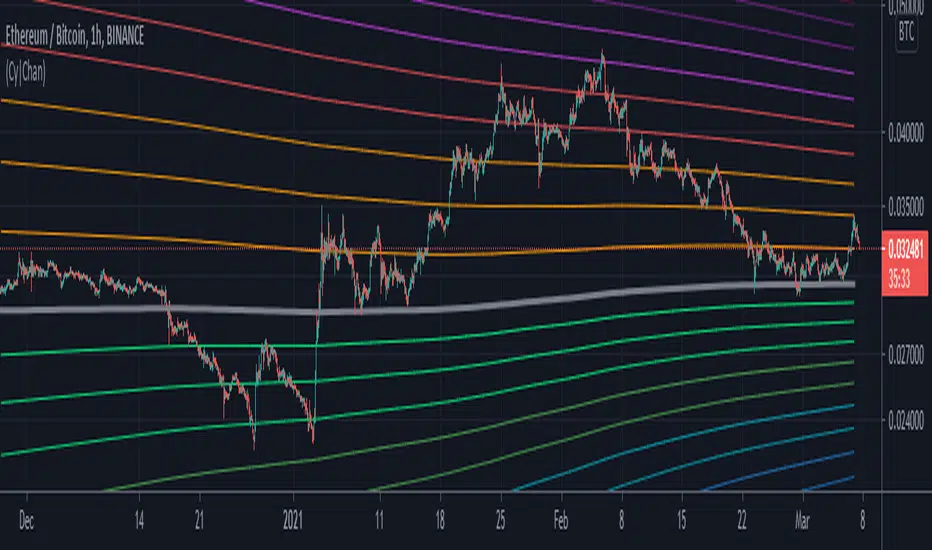
Cyber ChannelStandard deviation levels to determine if the price is over-extended in the positive/negative direction about the user defined MA line.
Historical confluence with the different levels can be used to estimate and predict the probability of a significant price retracement within given time-scale; and to help anticipate if the price is nearing local or all-time highs/lows.
Bollinger Bands Money Flow IndexThis script embodies the application of the Bollinger Band and Money Flow Index in John A. Bollinger's book "Bollinger on Bollinger Bands."
"Bollinger on Bollinger Bands" suggests a relatively method of analysis by applying the Bollinger Band to an indicator.
Here's one of the indicators, Money Flow Index.
Money Flow Index is an indicator of overbuying and overselling by reflecting the volume of transactions.
"Bollinger on Bollinger Bands" suggests using the Bollinger Band to create relative top and bottom lines for various indicators, such as Money Flow Index.
Original Money Flow Index is considered to be over-purchased if it is more than 80% and over-selling if it is less than 20%.
But if you put a bolinger band on it, you can set the standard for higher or lower over-selling and over-selling in a sustained bullish, bearish market.
This script uses the following values as the default values as recommended by "Bollinger on Bollinger Bands".
Money Flow Index for 10 days.
a bollinger band of forty days
standard deviation of 2
The above values are suitable for most stocks and markets, but sometimes there is too much or too little data inside the Bollinger Band.
It is recommended to modify each value little by little to adjust 85% to 90% of the total data to fit inside the Bollinger Band.
If the value is higher than the top line, it is considered over-purchased, and a red background color appears.
If the bottom line is crossed down, it is considered over-sold and the green background color appears.

Dexie Indicator v1.0The Dexie Indicator is a complete Forex trading system built for the 5 min chart. It is suitable for Nadex users and provides BUY/SELL signals with alerts and comes with a series of 8 custom built Moving Averages designed to reduce the need for chart drawing.
This indicator can be used by beginners out of the box and requires very little trading experience to be successful.
The more advanced trader can work with this tool to greatly increase their success rate and make for a much more enjoyable trading experience.
Please contact for more details.
Dexie Indicator with BUY/SELL signals displayed only:
Dexie Indicator with BUY/SELL signals, Bollinger Bands and custom Moving Averages
Dexie Indicator with all custom Moving Averages displayed

MultiType Shifting Predictive Moving Averages (MA) CrossoverJust 2 Moving Averages with adjustable settings and shifting capability, plus signals and predicting continuations.
At the time of publish these different types of MAs are supported:
- SMA (Simple)
- EMA (Exponential)
- DEMA (Double Exponential)
- TEMA (Triple Exponential)
- RMA (Adjusted Exponential)
- WMA (Weighted)
- VWMA (Volume Weighted)
- SWMA (Symmetrically Weighted)
- HMA (Hull)
I'm looking forward to any idea about filtering the signals. Thanks.

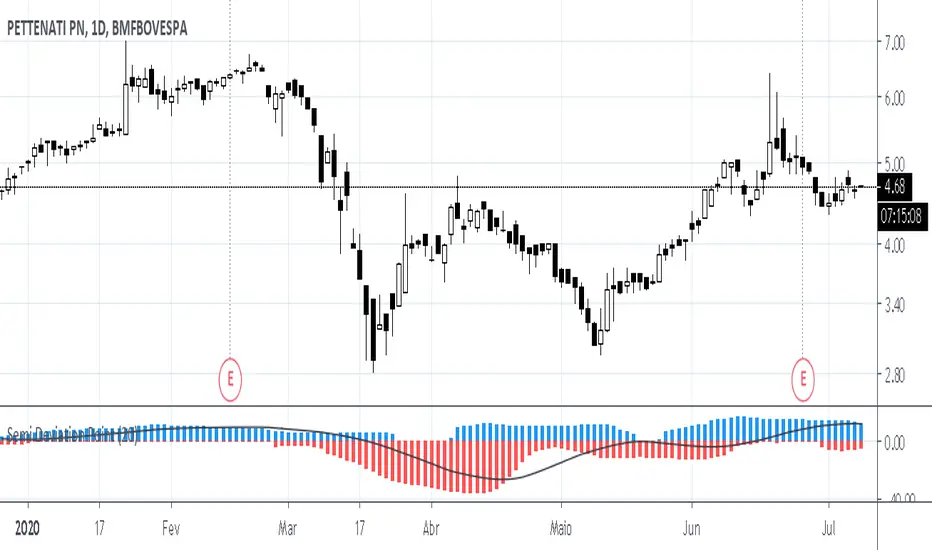
Semi Deviation Point PercentThe Semi Deviation Point calculates the positive value as the standard deviation of only samples that has high value than the simple moving average. The negative value is the same standard deviation, but only uses the low value and multiply for -1.
After this calculate the value is divide by the value of simple moving average and multiplied by hundred to get a percent value from 0% to 100%.
The delta line is a simple moving average from the differences of the two values.
How it should be read?
If positive values are greater than negative values than the volatility is happen on higher prices and not lower.
If positive values are lower than negative values than the volatility is happen on lower prices and not higher.
If you know that in which market you would opt in? Is it less risk the prior?
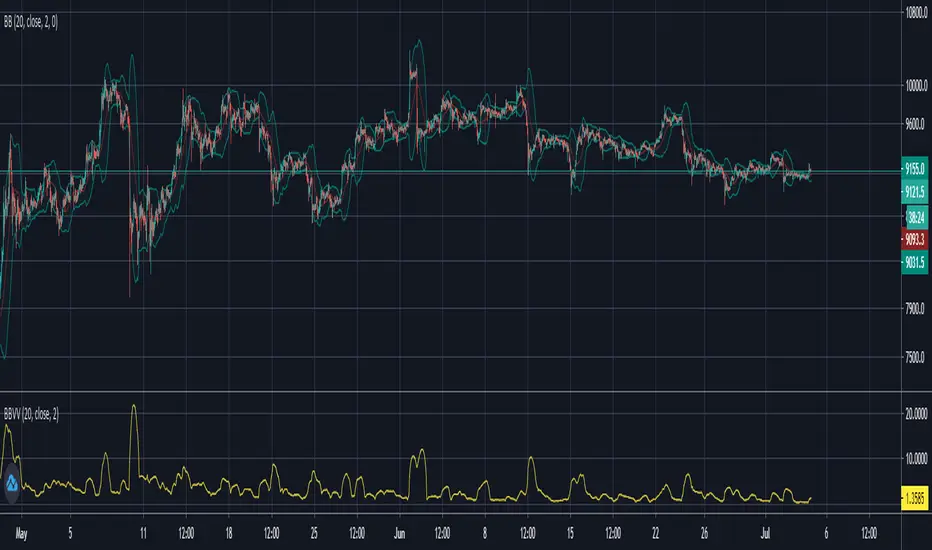
Bollinger Band Volatility Spread VisualizerThis indicator was created to see the total dollar (or whatever currency pair) amount spread between the upper and lower Bollinger Bands. This knowledge of knowing this spread can be used to indicate upcoming periods of high volatility in a market. The fundamental idea behind predicting periods of high volatility is backed up by the idea that periods of low volatility are followed by periods of high volatility and vice versa.
Based on this knowledge, the numerical spread of the Bollinger Bands, as shown in the indicator, we can deduce that when the value is super low, we can expect a period of high volatility AKA: big move incoming.
This indicator is not fully finished because this was my first time coding in Pinescript and I wanted to post the basic indicator first.
My future plans for improving this indicator include:
Adding customization as an option to choose your personal BBands settings that this indicator is based off of
Potentially converting this indicator as a TradingView Strategy where a signal would go off when the spread reaches a certain threshold
Overreaction indicator
Overreaction Indicator (OI)
Class : overreaction indicator
Trading type : intraday trading
Time frame : 1 day
Purpose : momentum/contrarian trading
Level of aggressiveness : standard
Overreaction Indicator is designed for intraday trading purposes. The indicator is based on the Overreaction Hypothesis. According to this hypothesis, after an abnormally strong rise/fall in price, the next day the contrarian price movement follows.
There are statistically significant differences between intraday dynamics on days with abnormal price changes and normal days respectively.
There is a strong momentum effect on days with abnormal price changes, i.e. prices tend to change only in the direction of the abnormal price changes during the whole day; in addition, usually the presence of an abnormal price movements becomes clear at the start of the US trading session.
During the Asian trading session a strong contrarian pattern is present (i.e., on the day after the overreaction prices tend to go in the opposite direction). Contrarian movement is limited in time, since usually it lasts only till the start of the European session.
There exist trading strategies that generate abnormal profits by exploiting the detected anomalies.
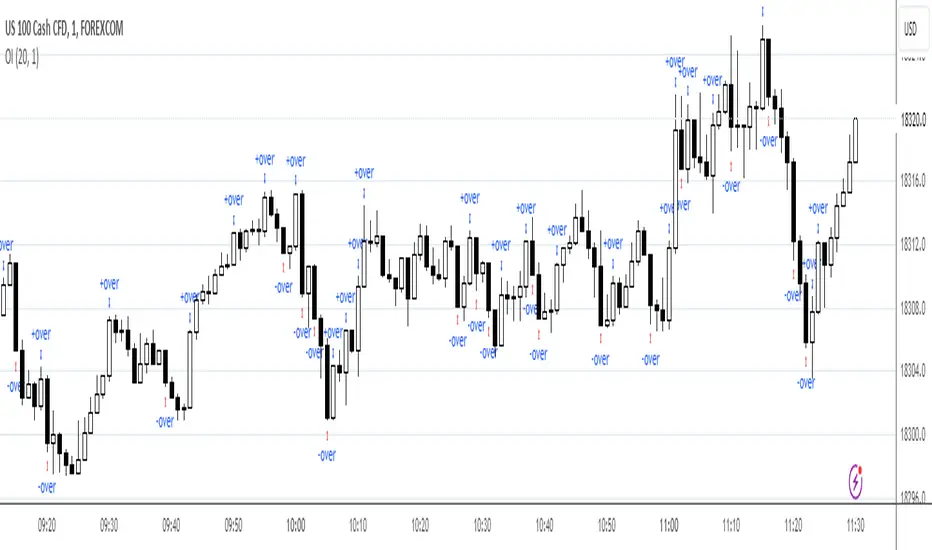
This indicator applies a dynamic trigger approach to detect daily abnormal price changes.
The indicator displays moments of market overreaction directly on the chart.
Parameters of the indicator
1. Averaging period (default value = 20) - period of indicator. It is used to define normal returns.
2. Number of Sigmas (number of standard deviations, default = 2) - Is used to detect abnormal returns. It defines levels of aggressiveness in trading signals. The bigger the value is the more conservative signals are generated
For the further information including the access to the indicator, please write in PM (private messages).
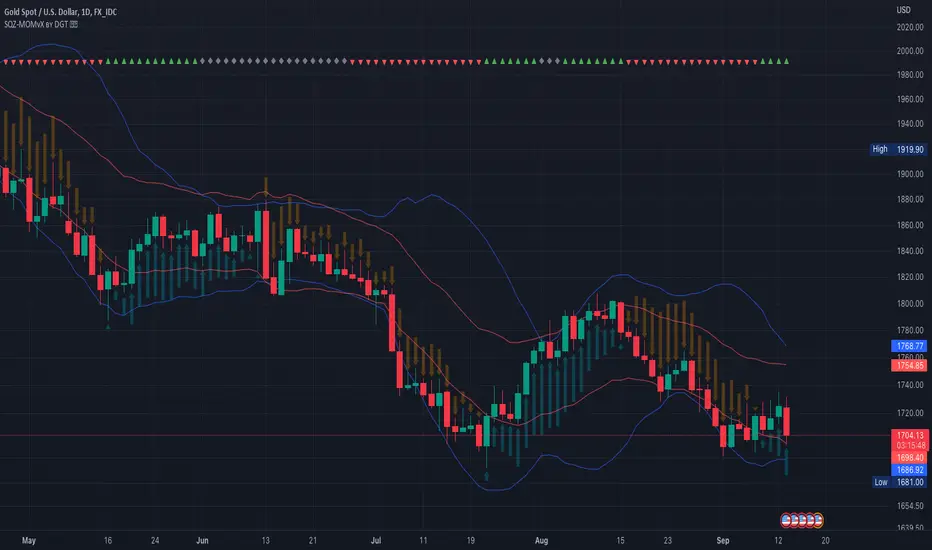
Squeeze Momentum Indicator [LazyBear] vX by DGTModified version of Squeeze Momentum Indicator visualizing on Price Chart
author: LazyBear, modified by KıvançÖZBİLGİÇ
NSDT ES Midline Zones**DESIGNED FOR ES/MES** This script provides an easy visualization of potential reversion zones to take trades back to the intraday midline. A common use would be to enter a position once price reached the outer yellow zones and retreats to either the red zone (for a short toward the midline) or a green zone (for a long back to the midline).

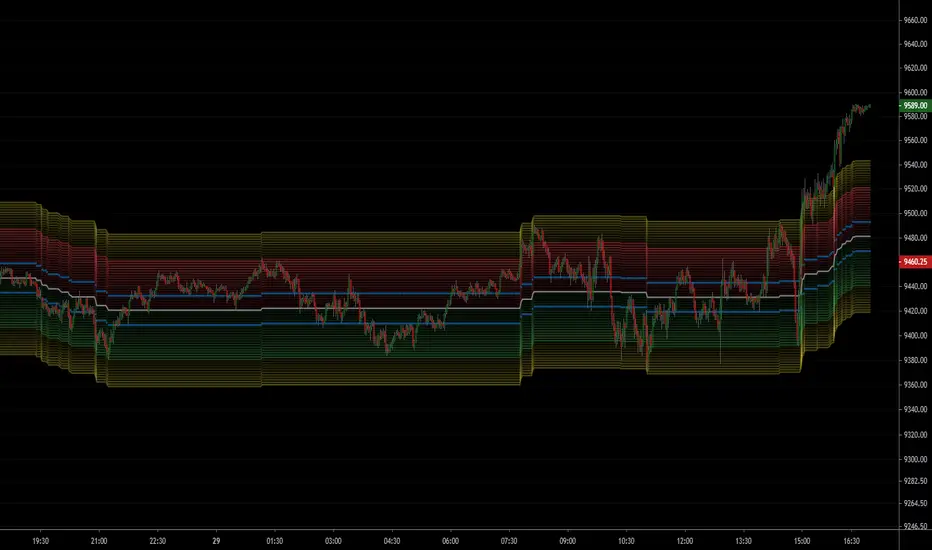
NSDT NQ Midline Zones**DESIGNED FOR NQ/MNQ** This script provides an easy visualization of potential reversion zones to take trades back to the intraday midline. A common use would be to enter a position once price reached the outer yellow zones and retreats to either the red zone (for a short toward the midline) or a green zone (for a long back to the midline).
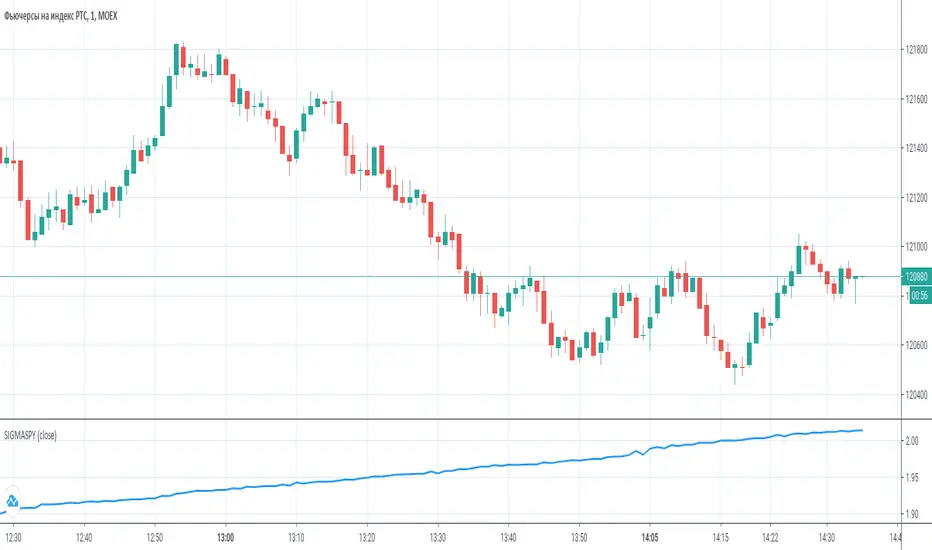
SigmaSpy: intraday deviation calculatorIndicator to estimate intraday price deviation for MOEX Futures, starts calculations each day at 10 a.m Moscow time
E.B. ReturnWith this script you can calculate a year/week/daily return of 5 stocks. Simply you choose the stocks and you gonna see it on the graph.

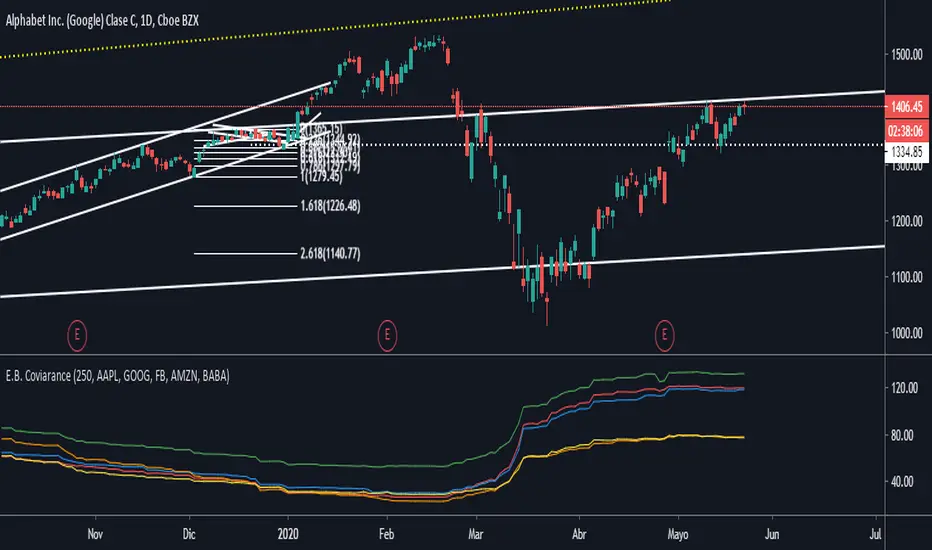
E.B. CoviaranceWith this script you can calculate the coviarance between two stocks. You can select until 5 diferents stocks to do it.
And you can choose the length too. If you want one year, two...
Why could you use it? To make a portfolio basically.
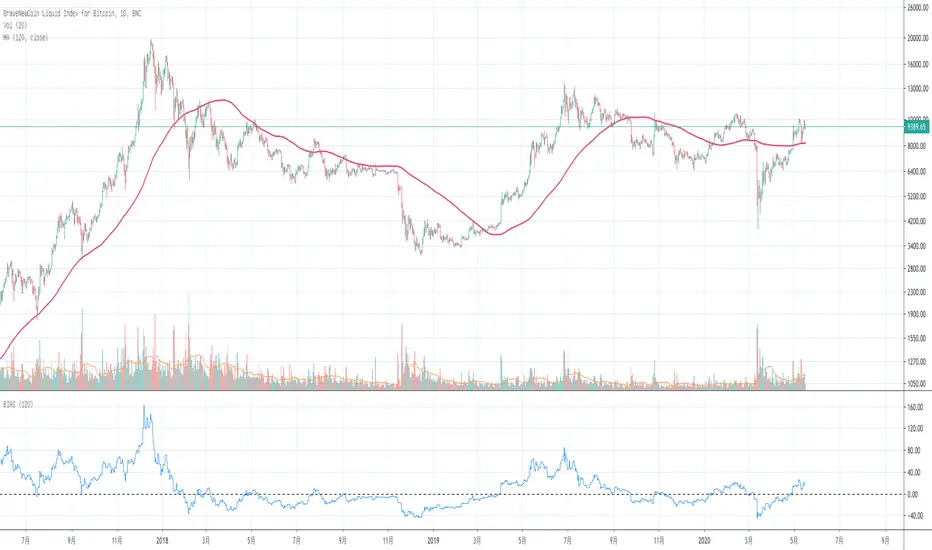
Basic BIASBasic BIAS
Deviation rate (bias), also known as deviation rate, or y-value for short, is an indicator to reflect the deviation degree between the price and MA in a certain period of time by calculating the percentage difference between the market index or closing price and a moving average, so as to obtain the possibility that the price will reverse or rebound due to deviation from moving average trend in case of severe fluctuation, and that the price will move within the normal fluctuation range Form the credibility of continuing the original potential.
The deviation rate is a percentage of the deviation degree (gap rate) between the price and ma.
The departure rate curve (bias) is a curve that connects the values of each bias into a line and obtains a wave extension curve with the value of 0 as the horizontal axis.
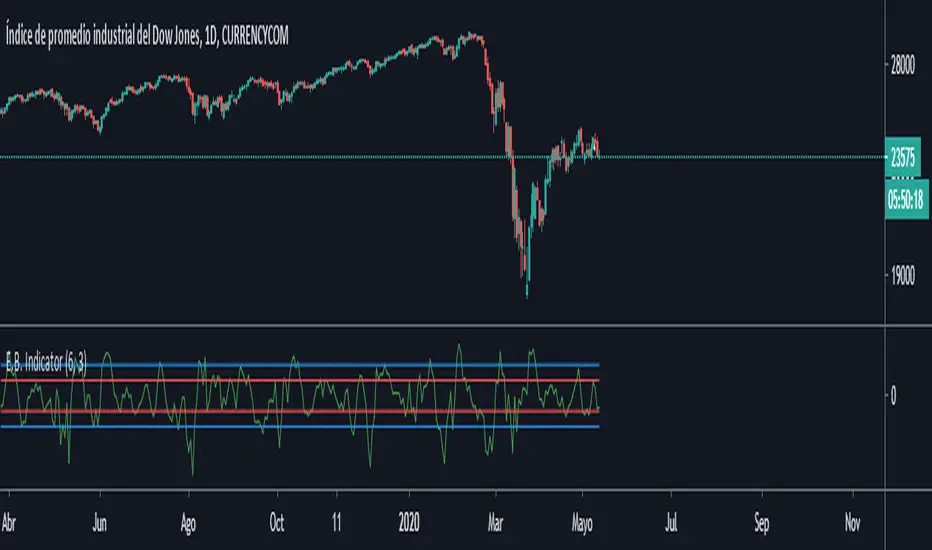
E.B. IndicatorThis is a custom indicator. When the green line crosses above the level 6, it's going to sell the stock. When it crosses down -6, it's going to buy the stock. You can change the level's number to adapt it to any asset.
It works for US30, or any Dow's Futures . But you can adapt it to any market, FOREX/Crypto/Stocks.
Also it works better in 5/15 min chart, but you can adapt it to any resolution too.
EntryModel is the level to make Buy and Sell transactions.
ExitModel is the level to close transactions.
If you would like to have the access, just DM me!
Trend Analysis IndicatorThe Trend Analysis Indicator was created by Adam White (Stocks & Commodities V. 10:8 (358-360)) and this is not to be confused with the Trend Analysis Index which was also created by Adam White. The stock is trending when it is above the signal and loses steam when it falls below the signal. Generally you should buy when it is above it's signal and sell when it goes below the signal.
Let me know if you would like me to write more scripts!

McMillan Volatility Bands w/ Buy & Sell Signals [optstrategist]BACKGROUND
McMillan Volatility Bands are an alternative approach to John Bollinger's "Bollinger Band" study and developed by world-renowned options trader and author Lawrence G. McMillan. Given his background in options trading, it was natural for Lawrence to approach any volatility-based study in the same manner options are priced --using Black-Scholes model. This model of pricing assumes a financial asset's volatility should be measured in percentage change rather than absolute value change.
OVERVIEW
The McMillan Volatility Bands indicator for TradingView will plot the 3 and 4-standard deviation bands around a 20-day moving average. This is how Larry has always used this system. The user can, however, change the standard deviation value as well as the moving average length to their preferred setting. This indicator can be used on any asset and on any timeframe.
Furthermore, the indicator will plot buy and sell signals based on a trading system used by Larry in his flagship newsletter publication The Daily Strategist. The system gives a signal when price closes outside the 4-sigma band and then closes back within the 3-sigma band. That 'signal bar' will be colored red or green for a sell or buy signal setup, respectively.
Finally, an arrow will be plotted on the chart where the system would actually enter the trade. This is determined when price trades a little beyond the extreme of the 'signal bar'. The level by which price has to go beyond the 'signal bar' is an input parameter and can be adjusted by the user. We've chosen the default value of 0.34. This means, the indicator will not give a buy or sell entry until the price moves: 1/3 x beyond the extreme signal bar. This is to prevent getting whipsawed by some setups that never really move in your favor. We've found it successfully removes the less-valuable trade setups.
PARAMETERS
ma_length => length of the moving average that the volatility bands work off of
outside_sigma => standard deviation of outer volatility band
inside_sigma => standard deviation of inner volatility band
entry_trigger_cushion => this refers to the percentage of the signal bar's range. The default value is 0.34. This means price will need to move 1/3 (~34%) of the signal bar's range beyond the high (for a buy) or low (for a sell) of the signal bar to trigger a buy/sell entry. This entry plots the arrow on the chart. We have found requiring this extra move in price eliminates many of the less-desirable signals at the expense of entering the better signals a little later.
WANT TO PURCHASE OR NEED MORE INFORMATION ON McMILLAN VOLATILITY BANDS?
Visit the link below to see purchasing options as well as screenshots of the indicator and how we trade it at McMillan Analysis Corp.

Wick SniperThis indicator is free to all Oasis Trading Group members.
The Wick Sniper was created to catch volatile moves that are extended from the mean. It uses an advanced ATR formula to follow price like a band, with an upper deviation and a lower deviation. I have also added a 1 candle offset so that the moves are not in "hindsight". Feel free to experiment with the inputs to find what is best for your asset.
For Access or Questions: Private message us. Thank you.

SPY Expected Move by VIXThis indicator shows 1 and 2 standard deviation price move from the VWAP based on VIX. Implied Volatility (IV) is being used extensively in the Option world to project the Expected Move for the underlying instrument. VIX is used as a proxy for SPY's IV for 30 days.
This indicator is meaningful only for SPY but can be used in any other instrument which has a strong correlation to SPY.
