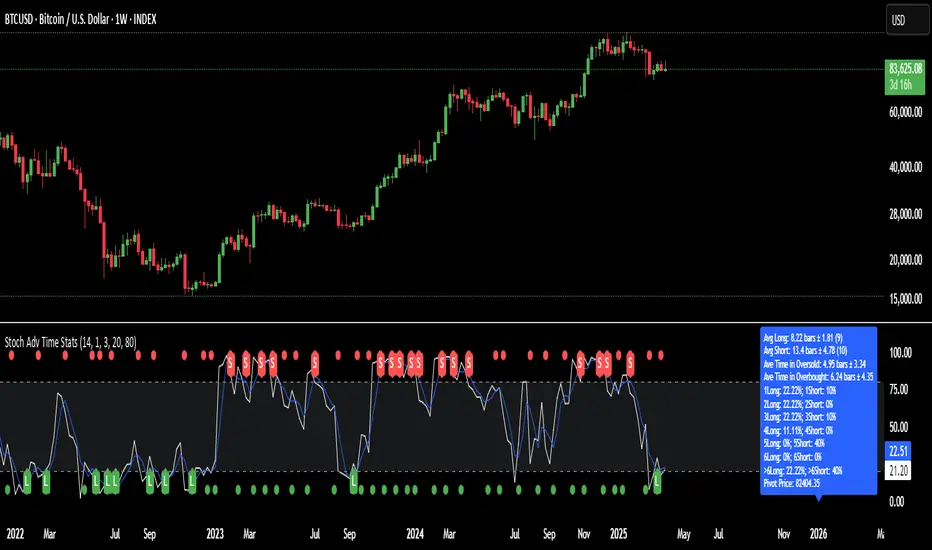
Price & Stochastics DivergenceOverview
This indicator is designed to help traders quickly identify both regular and hidden divergences between price and the Stochastic (K) line. It automatically locates potential turning points (pivots) on the chart, compares them to pivots on the Stochastic oscillator, and then flags divergences that could signal a shift or continuation in market momentum.
How It Works:
Pivot Detection
The script identifies swing highs and lows on both the chart’s closing prices and the Stochastic oscillator using a user-defined “lookback” period. This allows for flexible sensitivity to price swings.
Divergence Conditions:
Regular Bullish Divergence: Price makes a lower low, while Stochastic makes a higher low.
Regular Bearish Divergence: Price makes a higher high, while Stochastic makes a lower high.
Hidden Bullish Divergence: Price makes a higher low, while Stochastic makes a lower low.
Hidden Bearish Divergence: Price makes a lower high, while Stochastic makes a higher high.
Extended Horizontal Lines
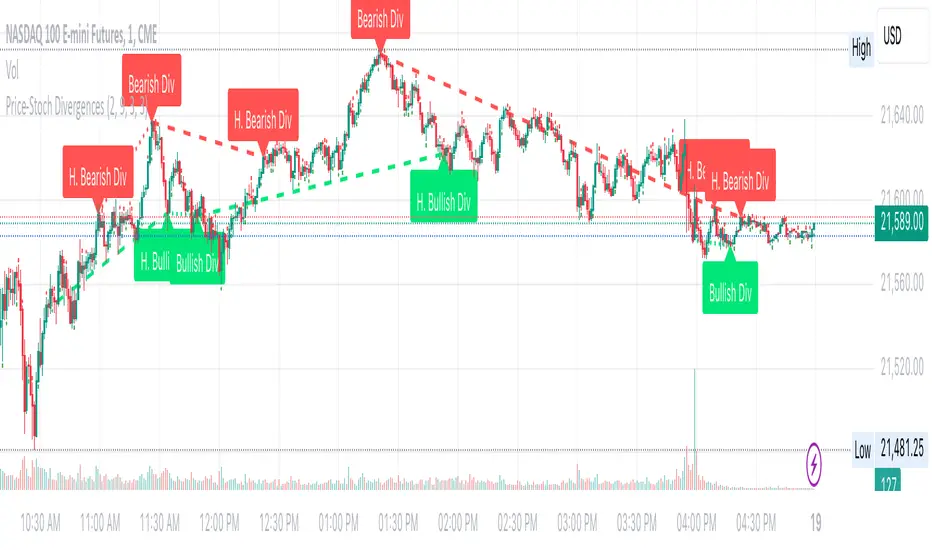
Bullish Divergence: A green horizontal line is drawn at the lowest price among the current bar and the previous 3 bars.
Bearish Divergence: A red horizontal line is drawn at the highest price among the current bar and the previous 3 bars.
Labeling & Visualization
For each identified divergence, the script places a label indicating whether it’s “Bullish Div,” “H. Bullish Div,” “Bearish Div,” or “H. Bearish Div.” This makes it easy to see exactly where divergences occur.
How to Use
Add the Indicator: Simply attach it to any chart. It will automatically detect and highlight divergences.
Interpretation: A bullish divergence may suggest potential upward price pressure, while a bearish divergence may hint at downward pressure. Hidden divergences often signal continuation of the prevailing trend.
Combine with Other Analysis: Divergences are not foolproof. It’s often wise to use them alongside other technical tools, such as support/resistance, volume analysis, or trend filters.
Notes & Disclaimer
Delay: The built-in pivot functions confirm pivot highs/lows after several bars, so divergences appear once those pivots are finalized. This is normal and helps avoid repainting signals prematurely.
Educational Use Only: This script is intended to provide visual guidance for divergence analysis. It does not constitute financial or investment advice. Always conduct thorough research and consider multiple factors before making any trading decisions.
No Guarantee: As with any technical tool, there is no guarantee of accuracy or future results. Divergence signals can fail in fast-moving or choppy markets.
Use this indicator as part of a broader strategy to better understand potential momentum shifts or continuations. Always practice responsible risk management. Enjoy and trade safe
Pine Script® indicator