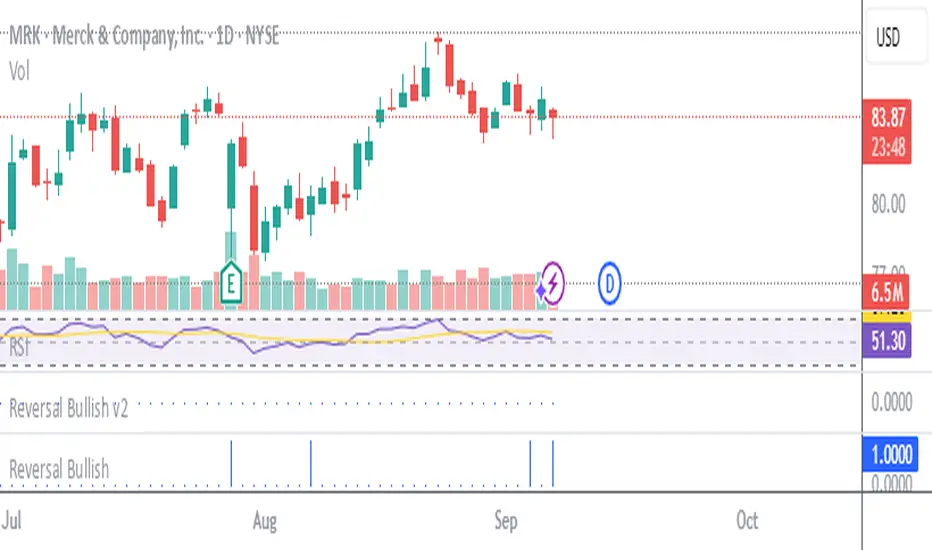
Stockbee Reversal Bullish v2Custom indicator for identifying stocks that meet the Stockbee's Reversal Bullish New criteria. This can be used as a standalone indicator or use it to screen for stocks in Pine Screener.Pine Script® indicatorby traderabhi8136
Stockbee Reversal BullishCustom indicator for identifying stocks that meet the Stockbee's Reversal Bullish criteria. This can be used as a standalone indicator or use it to screen for stocks in Pine Screener.Pine Script® indicatorby traderabhi8119
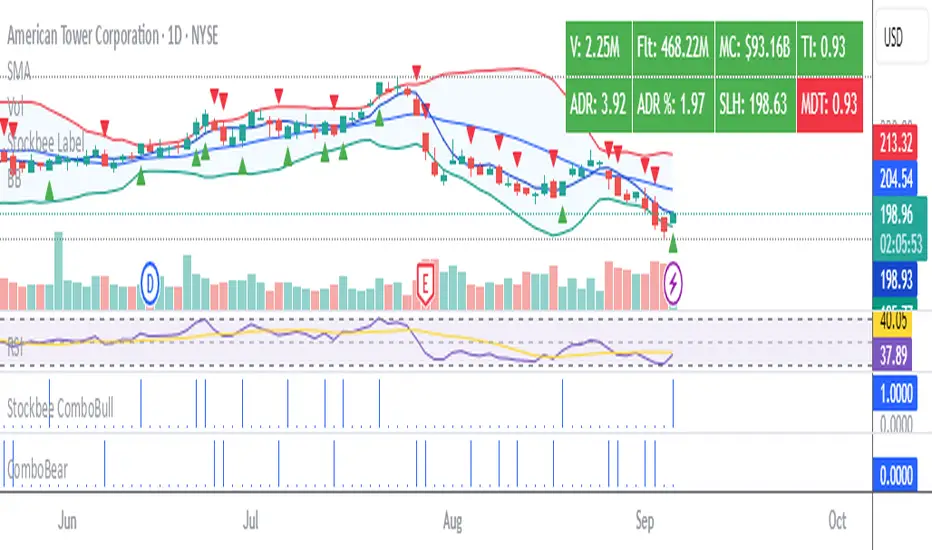
Stockbee ComboBearCustom indicator for identifying stocks that meet the Stockbee's ComboBear criteria. This can be used as a standalone indicator or use it to screen for stocks in Pine Screener. Pine Script® indicatorby traderabhi8141
ComboBearCustom indicator for identifying stocks that meet the Stockbee's ComboBear criteria. This can be used as a standalone indicator or use it to screen for stocks in Pine Screener.Pine Script® indicatorby traderabhi811111
Stockbee ComboBullCustom indicator for identifying stocks that meet the ComboBull criteria. This can be used as a standalone indicator or use it to screen for stocks in Pine Screener.Pine Script® indicatorby traderabhi81Updated 66
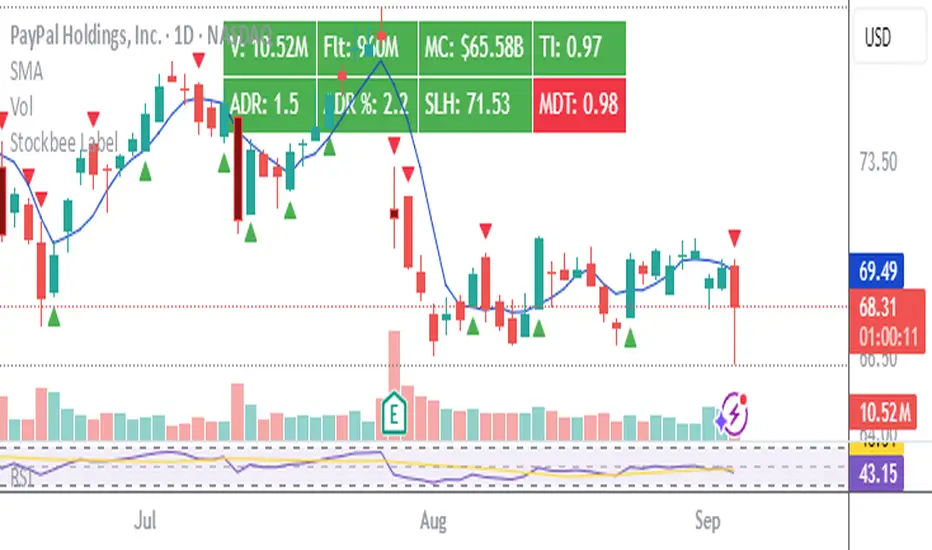
Stockbee LabelUnlock the full potential of your TradingView charts with this powerful indicator designed specifically for Stockbee methods. Instantly gain key market insights at a glance with a sleek, easy-to-read label displayed on your chart. This dynamic label provides critical data including Volume, Total Float, Market Capitalization, Trend Intensity, Average Daily Range (ADR), Half-Day Stop Loss level, and Modified Double Trouble (MDT) . Elevate your trading strategy with real-time, essential metrics all in one place—streamlining your decision-making and boosting your confidence in the market. Disclaimer: This indicator is inspired by and built upon the original concepts of Stockbee and EG. Pine Script® indicatorby traderabhi81Updated 11101
Stockbee 4% DaysStockbee 4% / -4% identifier. Helps with depicting mom bursts in either direction. I find it particularily helpful when I am looking to determine tightness and quality of a consolidation. You don't want more than one -4% day in a quality consolidation before a breakout.Pine Script® indicatorby SMGBTradesUpdated 1143
Stockbee Momentum BurstThis is a script to color code bars based on the bullish- and bearish combination. Bullish Combination Percent: Price >= 4% from yesterday and Volume today > Yesterday Dollar: Price >= 0.9 dollar from open Base Requirements - Price > Yesterday's close - Price > Open - Price is within 30% of high - Todays price range >= Yesterdays price range - Yesterday's move <= 2% - Volume >= 100 000 Bearish Combination Percent: Price <= 4% from yesterday and Volume today > Yesterday Dollar: Price <= 0.9 dollar from open Base Requirements - Price < Yesterday's close - Price < Open - Price is within 30% of low - Todays price range >= Yesterdays price range - Yesterday's move >= -2% - Minimum volume for each of last 3 days >= 100 000 Momentum Filter These are based on the 10 and 20 EMA crossover, where the former above would indicate upward momentum and below downward momentum. This can help to narrow down the color code to continuation phases. The linked option will override all other momentum filters, bullish candles will be displayed when EMA 10 > 20 and bearish candles when EMA 10 < 20.Pine Script® indicatorby StockLeaveUpdated 1515830