Cardistry ♠♥♦♣♠♥As always -No repaint, Signals are real time♦♣
First release version is not tunned, parameters need testing and manual tuning from users
Label meanings and color is self explanatory and pretty straight forward
Signals deviate from Candlestick sequences and Volatility
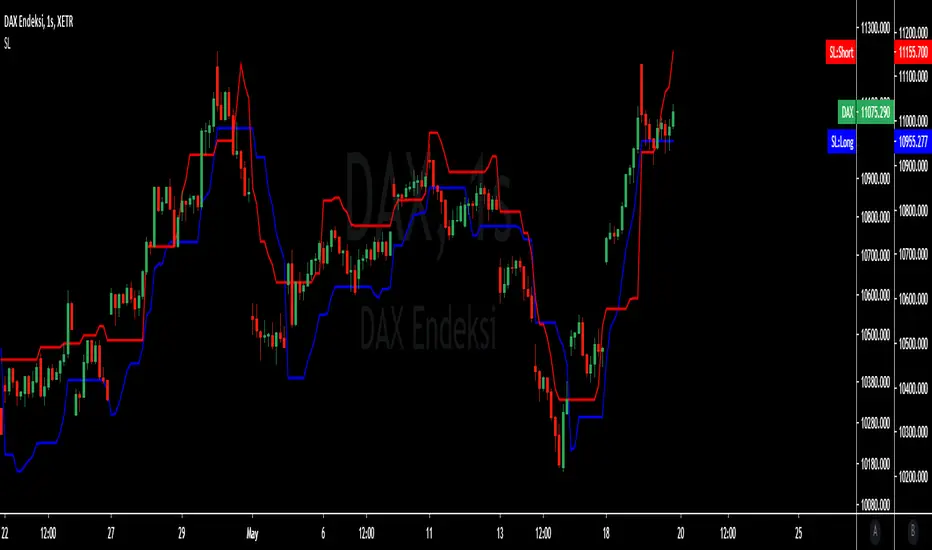
Stoploss

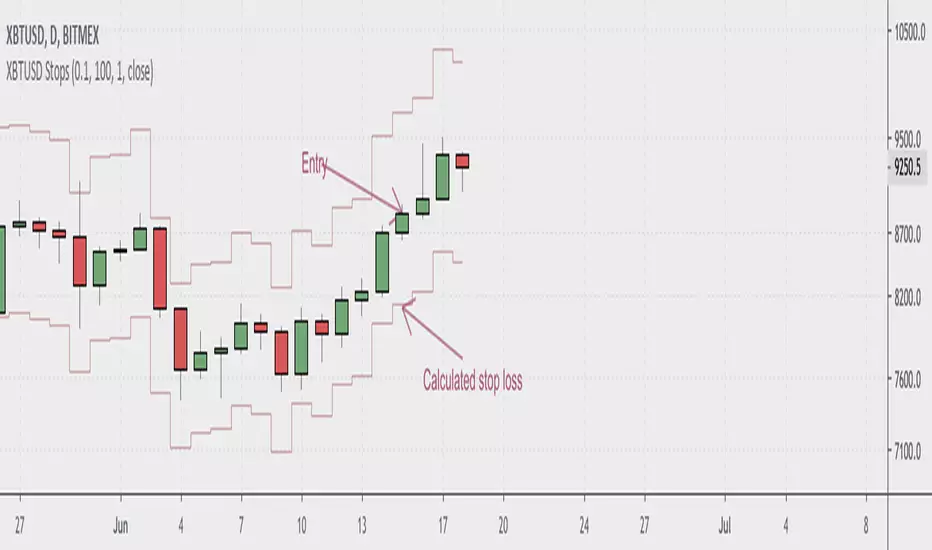
BitMex XBTUSD StopLossShows you where to place your stop loss when trading the Bitcoin swap and futures contracts on BitMex. Enter your account size, position size, and desired risk per trade in the indicator settings. If stop seems too tight, use a smaller position size. Most seamlessly used with cross leverage on BitMex. Make sure to keep an eye on the liquidation level for your trades.
Equilibrium - Strategy This is a straight forward strategy:
1. Buy at signal
2. Set stop-loss at red line
3. Sell at signal or when stop-loss triggers
Designed for 30min. crypto charts
Always backtest before use

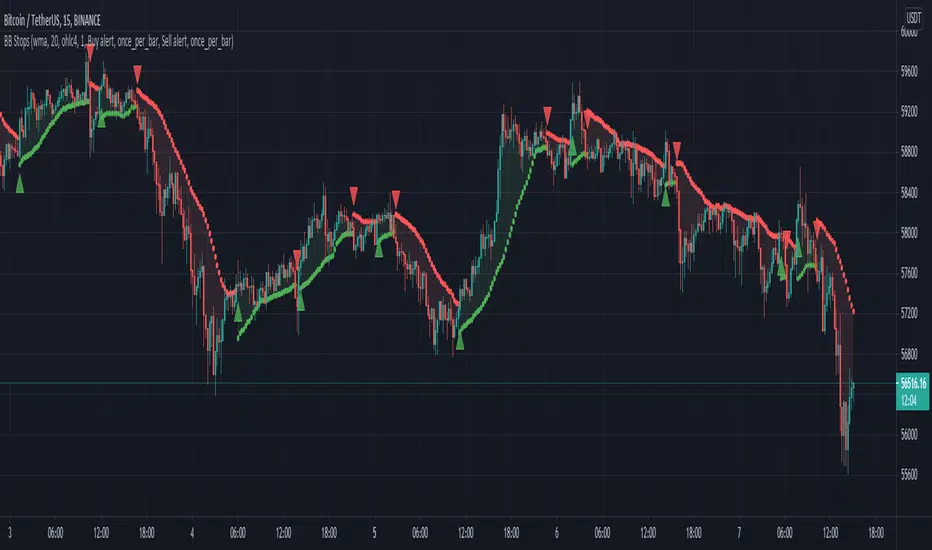
Bollinger Band stops - JDI didn't find a BB stops indicator on TV, so I wrote one myself.
You can select various ma types as a base anchor for the calculations.
This indicator can have various use cases similar to Supertrend or Parabolic SAR: as a trend indicator, as a training stop loss,...
JD.


TP/SL calculator (ATR)This calculates takeprofits and stoploss based on current ATR (average true range) and plots the targets as an overlay
www.oberon.at
Alternatively it can display a trailing stop loss target
www.oberon.at

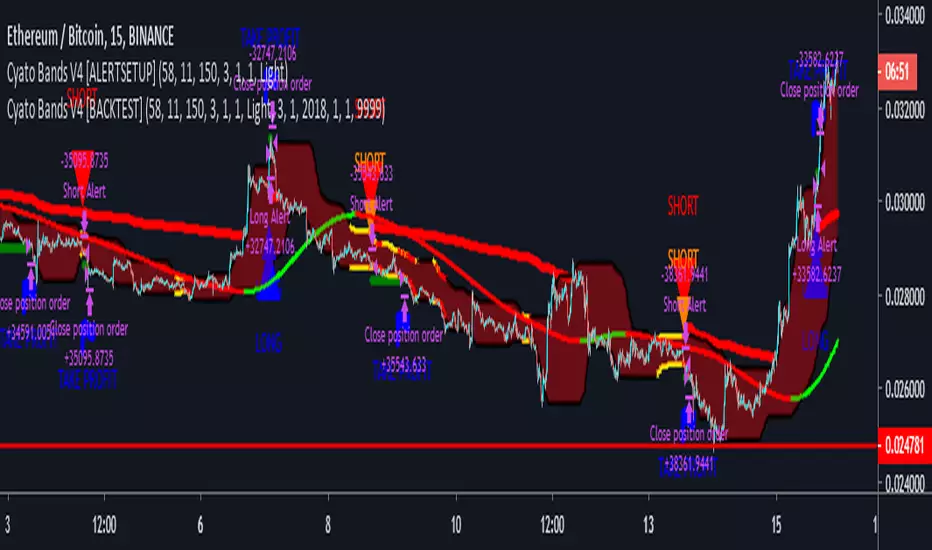
Cyatophilum Bands Pro Trader V4 [ALERTSETUP]> > PRESENTATION < <
This version includes a new feature, engineered to increase profitability.
About the backtest below:
Short + Long Strategy
0.05% Commission
10% of 10 000% equity per trade. Net Profit can be increased with a bigger % of equity.
Strategy data from 01/11/2019 to 30/04/2019
The Cyatophilum Bands, Trailing Stop Loss and Take Profit System are explained on here .
To automate the indicator, there are up to 8 different alerts that you can use:
1. LONG ENTRY
2. LONG EXIT
3. SHORT ENTRY
4. SHORT EXIT
5. TAKE PROFIT LONG
6. TAKE PROFIT SHORT
7. STOP LOSS LONG
8. STOP LOSS SHORT
The access to this indicator is included in the Cyatophilum Indicators pack available on my website .
To get a free trial, simply leave a comment, thank you very much for reading !
Previous version :
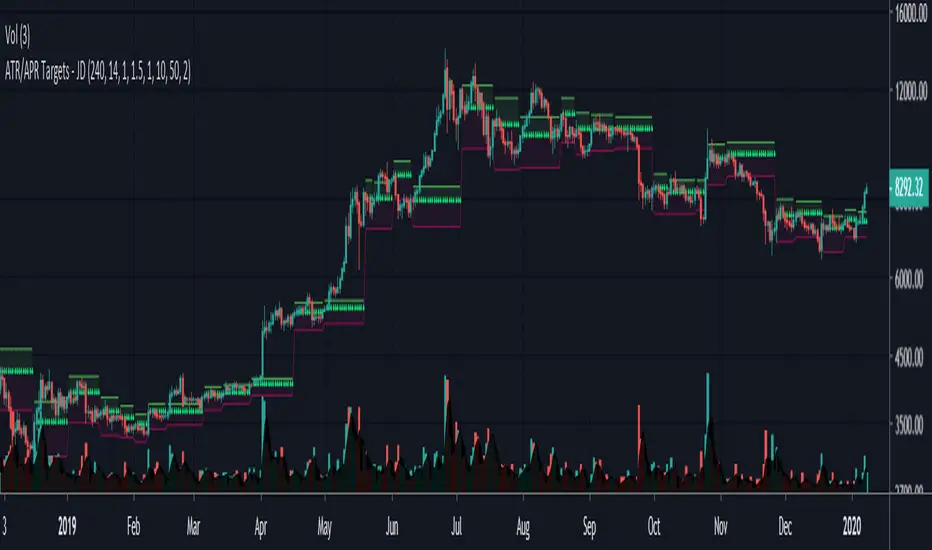
ATR Targets - JDA simple visual representation of ATR trading targets.
The indicator shows ATR targets (TP and SL) from the last swing points (if you entered there)
There is an option to chose targets for a long or short position.
JD.
#NotTradingAdvice #DYOR
I build these indicators for myself and provide them open source, to use for free to use and improve upon,
as I believe the best way to learn is toghether.
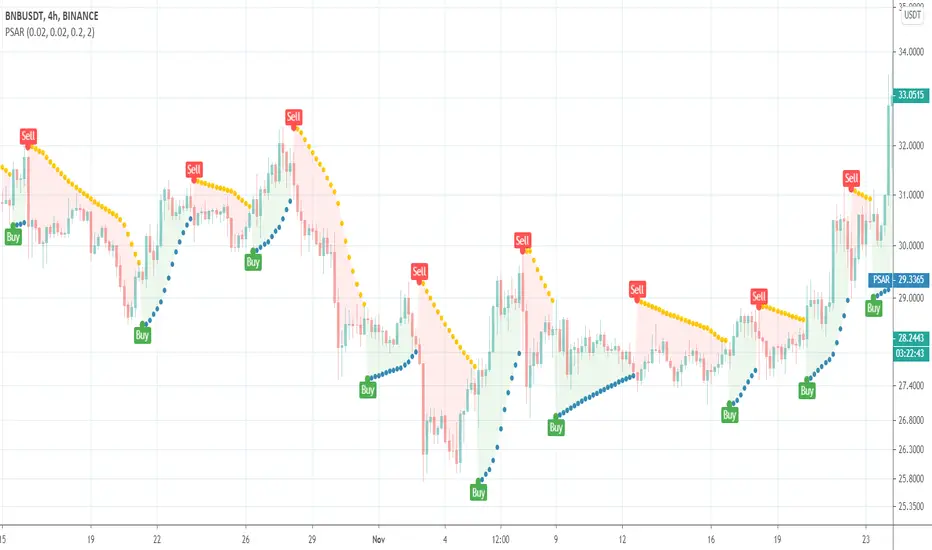
Parabolic SARThis is a redesign of the built-in Parabolic SAR indicator. I added a proper input system, an option to highlight initial points for both lines and an option to choose points width. So, customize it as you want.
Parabolic SAR was originally developed by J. Welles Wilder and described in his book "New Concepts in Technical Trading Systems" (1978). It is a trend-following indicator that can be used as a trailing stop loss.
To know which settings for PSAR are the most profitable on your instrument and timeframe you can use this tool
Profitable Parabolic SAR
Profitable SuperTrendHello friends,
This script is a powerful, non-repainting optimizer for the classic SuperTrend indicator — one of the most popular tools for trend-following and volatility-based trading. It automatically finds and applies the most profitable SuperTrend settings for each instrument and timeframe, removing the need for manual parameter tuning or guesswork.
🛠 How It Works
The indicator evaluates over 1,400 combinations of ATR Periods and Multipliers using a decision tree–based optimization algorithm .
Each configuration is backtested across the instrument's full history, and when a more profitable setup is identified, the indicator automatically switches to those values in real time — while preserving the standard SuperTrend logic.
It also supports commission customization for more realistic backtesting and includes an alert system that notifies you whenever a better parameter set is found.
This adaptive approach keeps the SuperTrend continuously tuned to evolving market conditions without repainting or distorting past data.
💡 Integrated Versions Explained
This all-in-one tool merges 3 complementary indicators:
• Profitable SuperTrend — A dedicated optimizer that runs in a separate window below your chart. It doesn’t produce buy/sell signals directly but analyzes your asset and timeframe to find optimal ATR settings. Results are visualized as two lines (purple and orange), with optional labels displaying the best parameter values. You can then manually apply these values to your standard SuperTrend.
• Self-Adjusting SuperTrend — A real-time overlay version that behaves like the standard SuperTrend but dynamically adjusts its parameters on the fly. It requires no manual setup and can be paired with the Profitable SuperTrend for full transparency over which values are currently active.
• Compact Self-Adjusting SuperTrend — A minimalist oscillator version that uses simple binary outputs: -1 for Sell and 1 for Buy. This format is ideal for filtering or integrating the adaptive logic into other trading systems.
Together, they form a complete adaptive suite that combines automation, flexibility, and precision — suitable for both discretionary and systematic traders.
🔥 Key Features
Adaptive optimization powered by a decision tree–based algorithm
Real-time switching to the most profitable SuperTrend parameters
Commission customization for realistic backtesting
Direction filter (Longs | Shorts | Longs & Shorts)
Optional analysis start date for focused historical testing
Smart alert when better settings are detected
Optional buy/sell labels and compact trend output
Clean and organized UI with improved workflow
If you'd like access or have any questions, feel free to reach out to me directly via DM.
👋 Good luck and happy trading!
Paid script

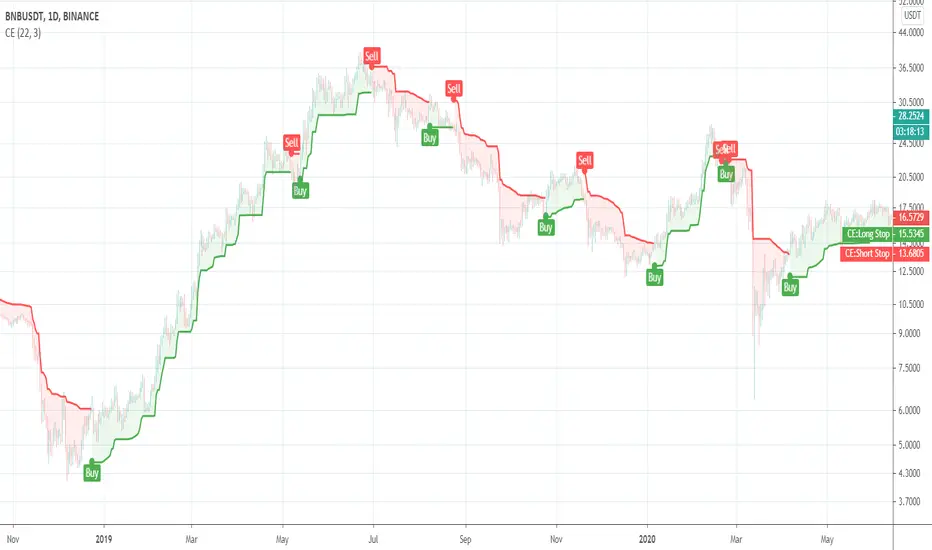
Chandelier ExitThis is a redesign of the Chandelier Exit indicator. It removes stupid transitions between Chandelier Exit' states and highlights initial points for both lines.
This indicator was originally developed by Charles Le Beau and popularized by Dr. Alexander Elder in his book "Come Into My Trading Room: A Complete Guide to Trading" (2002).
In short, this is a trailing stop-loss based on the Average True Range (ATR).
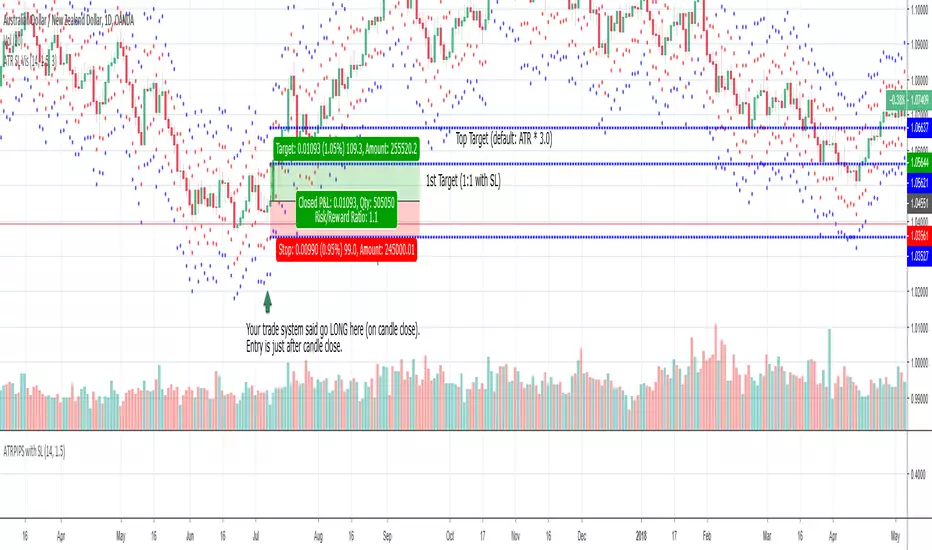
ATR SL Visualization (on chart)This indicator plots 2 sets of dots (and lines) based on your chosen ATR multiplier (Average True Range).
Generally, when trading on the daily timeframe a good rule of thumb is to use the ATR * 1.5 (the default setting of this indicator).
I created this indicator to quickly test other indicators but I also find it helpful in live trading.
How to use this indicator:
Your trade system provides an entry signal. The red dot (can be connected line in options) would be used as the stop loss for either a long or short.
Then the dot on the other side would be your first 1:1 target.
The blue line is the same ATR multiplier as a target (default but can be modified).
Using an additional tool like the horizontal ray can be helpful to see the exact location the SL might be hit or where the target might hit.
When drawing your ray ensure you’re using the right entry candle.
For instance, in a long scenario you would typically be entering a trade after your signal candle closes. So draw the ray at the point in price on the next candle for both stop loss and target.
Also use these dots (lines) as guides provides an easy way to plot SL and targets if you want to use the Long or Short tool.
For my trade systems I don’t use price targets (I exit when structure or indicators reveal to exit) but I do find it helpful to graph when testing. When something moves in my favor either the ATR or the ATR * 1.5 I take profit and typically move up my stop loss to break even or trailing.
The other strategy that could be possible but have not tested is as long as the SL is making a new high moving up a hard stop to the ATR SL each day the trade goes in your favor.
This should be obvious but if you want to use just the true ATR edit the multiplier to be 1.0
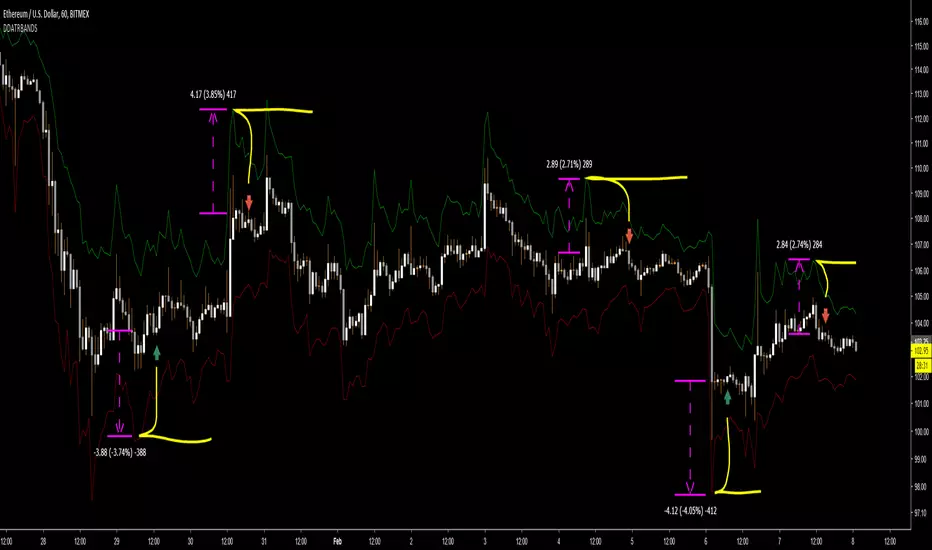
Average True Range (ATR %) Stop Loss CalculatorThis indicator takes the average of a series of ATR to calculate what I would consider an optimum stop loss placement represented in percentage (read below for full overview).
While the data is plotted what is most helpful are the actual numbers presented and for my charts I remove most of the plotting.
This indicator is most helpful on the daily timeframe but can be used for all timeframes such as the 4HR, 1HR or even 15M.
This indicator should not be used alone. It should be used in conjunction with proper price action analysis. It’s also a great indicator if you chart using Value Channels. Ideally you want your stop placement to be below at least one core Value Channel boundary range. In addition to standard support and resistance and some key moving averages the market respects. This also works best when trading with the prevailing BIAS of the instrument (bull or bear).
Cryptos: Generally, that means you’re buying on retracements that fit the end of a structured move. The other option is using this in a clear up trending market where the pull backs are clearly being supported with buying.
FOREX: I built another indicator for FOREX search: ATRPIPS with SL
WTI: Helpful but I have different rules for when I trade WTI. I rely upon VCs and diagnal VCs much more when trading this.
Equities: Helpful but with the increase of volatility as well as uncertainty of Bias of the market-- this should be used as more of a guide than
What is most important is the actual percentage numbers but I've found graphing 1-3 of the actual ATRs is helpful. The rest just uncheck the checkbox in the options.
Indicator Overview:
Value 1 - 3 Period ATR (maroon)
Value 2 - 7 Period ATR (green)
Value 3 - 30 Period ATR (blue)
Value 4 - 90 Period ATR (blue, bold)
Value 5 - 1 Period ATR (green)
Value 6 - 1 Period ATR (red)
Value 6 – Prime Stop Loss Placement (maroon). This is the average of all above ATRs multiplied by 1.5
Value 7 - Move Left (red). Experimental value. This is the difference between (prime stop loss) and 1 day period move. Two ways to use this value. Use as a tighter stop loss placement. The other option is to use as a retrace target for purchase and using the Prime Stop Placement value as you’re stop loss.
All ATRs use the LOW price of the period. After testing both the low and close I’ve settled on the low to capture the most volatility you will typically experience.
Once again, this indicator should be used in conjunction with your proven trade system.
Also, by knowing what the values are within the indicator you could just eye ball what would be the best stop placement depending on the ATR or 1 or 2 ATRs you find most represent the volatility of what you are trading.
I will be expanding on this indicator by bringing in average measured moves as well as volume analysis and most likely with color changes and modifications.
Background:
While using and refining my trade system I've noticed that most moves happen in 3 periods. So we start there. The 7 period is good for a 24 hour market such as crypto (although weekend trading can be a hit or miss) and to some extent FOREX. The longer periods of 30 & 90 are to smooth out the data set. The final value of the 1 period is to bring a little more recency to the calculation.
Why multiply the average by 1.5? I've found in my own trading and system I built to be the best placement (in conjunction with VCs) to ensure you're stop isn't to close and is within the instrument you are trading volatility .
I'm looking at making this more intelligent as well as take into account volume and structured moves.

DD ATR bandsThe top band is ATR added to candle high (with given length and multiplication). The bottom one is analogic.
Created for finding initial stop loss for entry on low timeframes. Use band value at last major high/low to place the stop loss at.
It shows prices with acceptable risk and a reasonable margin for market volatility.
ATR Pips with Stop LossThis indicator shares ATR pips and a calculated 1.5 x stop loss calculation.
1st number is ATR.
2nd number is ATR x 1.5 (a typical SL when trading daily time frame).
The plot lines are really not that important- it's the actual numbers.
What I do is uncheck the plot line checkboxes (ATR & SL) so it doesn't show up, that way I can reduce the indicator window.
This script is a modified script by ATR Pips . Kept the BB section for now as it might be useful, but doubt it.
Future updates:
- editable the multiple for SL
- static daily numbers (right now this shows the timeframe you are viewing, I'd keep that but add a static daily ATR so you have both)

DD ATR stop trailsATR based stop trails.
The top trail is basically lowest ATR since the last candle hit (with given length and multiplication) added to candle high.
The bottom trail is analogic.

LINEdicator - Trendanalysis toolThis indicator creates an trend channel based on an EMA/SMA combo and a Parabolc SAR indicator.
Watch for the peaks and the size of the red/green channel for possible trend change.
Can also be used as an Entry/Exit/Stop-Loss setting tool.

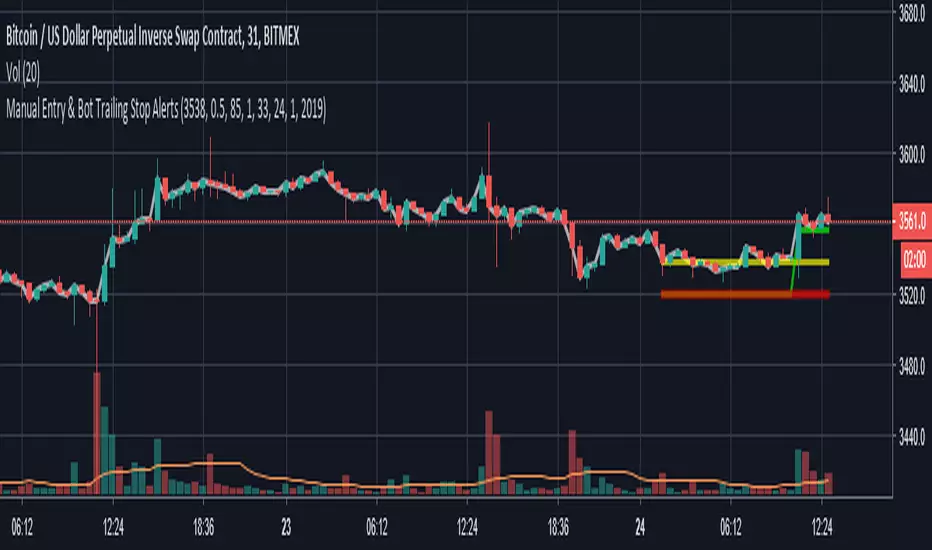
Manual Entry & Bot Trailing Stop AlertsHello all,
Another useful script & indicator with alerts enabled for trailing stoploss in your toolbox!
If you manually start a deal on a bot or even manual trade, you can set your chart time frame, enter the price and the time and date of your entry, then configure an Alert to fire using the “Close Long”/“Close Short” alert trigger.
This indicator features:
Definable Hard Stoploss by % - if price drops to hit this value, immediately trigger a close
Definable “Trail” value using Ticks (one Tick = lowest tradeable unit for your chart)
Supports Longs and Shorts!
Ideal for connecting to your 3commas BitMEX bots for EthUSD or XbtUSD
The indicator plots onto the chart various signals, Red is the Hard Stoploss value, Yellow is your Entry price, Green is the Trailing Stop and White is the live Price Tracker.
Please Note: When you add this indicator to your chart you need to click the Cog/Settings icon to configure it!
Let me know what you think!
Thanks,
Chris