Multi Straddle-Strangle ChartThis powerful indicator is designed for options traders who want to visualize and track the combined premium of multiple straddle and strangle strategies in a single, dedicated pane.
Quickly analyze and compare up to five different options strategies at a glance, directly on your chart. This tool is perfect for monitoring volatility, tracking potential profits/losses on a position, and spotting key support and resistance levels based on option premiums.
Key Features:
Plot Up to 5 Strategies: Simultaneously plot any combination of up to 5 straddles or strangles.
Real-Time Data: Fetches live data for both Call and Put options to give you an up-to-the-second view of the combined price.
Dynamic Symbol Generation: Automatically detects the underlying symbol (e.g., NIFTY, BANKNIFTY, stocks) and builds the correct option symbols based on your input.
Customizable Inputs: Easily configure the expiry date, strike prices and line colors for each of the 5 lines.
In-Chart Summary Table: A clean and clear table in the corner of your chart provides a quick summary of each enabled strategy and its current price.
Important Note on Usage:
This tool requires you to input a strike price in all fields, even if you do not plan to use all five lines. This is necessary because of a fundamental rule in the Pine Script language: every input must have a constant, non-empty default value. The indicator is optimized to only fetch data for the lines you have explicitly enabled with the "Enable Line X" checkbox.
Straddle

Straddle Charts - Live (Enhanced)Track options straddles with ease using the Straddle Charts - Live (Enhanced) indicator! Originally inspired by @mudraminer, this Pine Script v5 tool visualizes live call, put, and straddle prices for instruments like BANKNIFTY. Plotting call (green), put (red), and straddle (black) prices in a separate pane, it offers real-time insights for straddle strategy traders.
Key Features:
Live Data: Fetches 1-minute (customizable) option prices with error handling for invalid symbols.
Price Table: Displays call, put, straddle prices, and percentage change in a top-left table.
Volatility Alerts: Highlights bars with straddle price changes above a user-defined threshold (default 5%) with a yellow background and concise % labels.
Robust Design: Prevents plot errors with na checks and provides clear error messages.
How to Use: Input your call/put option symbols (e.g., NSE:NIFTY250814C24700), set the timeframe, and adjust the volatility threshold. Monitor straddle costs and volatility for informed trading decisions.
Perfect for options traders seeking a simple, reliable tool to track straddle performance. Check it out and share your feedback!

🧠 Options Strategy Dashboard (Straddle)________________________________________
🧠 STWP Options Strategy Dashboard (Long/Short Straddle)
Author: simpletradewithpatience
Markets: NSE (India)
Best timeframe: 1-second chart
Built with: Pine Script v5
________________________________________
📌 Overview
A real-time options strategy dashboard designed for NSE Straddles:
✅ Long Straddle → Buy ATM CE + Buy ATM PE
✅ Short Straddle → Sell ATM CE + Sell ATM PE
This tool provides a visual, tick-by-tick dashboard for monitoring:
Live premiums, real-time PnL, ROI, Greeks, and risk conditions — all in one screen.
It’s fully manual and built for educational & tracking purposes only — not for automation.
________________________________________
📌 Key Features
✅ Track Long & Short Straddles
✅ Live LTP tracking via dual symbol inputs
✅ Real-time PnL, breakeven, max profit/loss
✅ ROI & Risk:Reward calculation
✅ Smart Exit logic with context-based alerts
✅ Invalidation logic via Reversal Range breach
✅ Manual input of Greeks (Delta, Gamma, Theta, IV%)
✅ Greek-based warnings: Gamma Risk, IV Crush, Theta Decay
✅ Days to Expiry (DTE) tracking
✅ Fully customizable alert system
✅ Clean emoji-labelled dashboard UI
✅ Built for Indian NSE Options
✅ Requires 1-second chart for correct functioning
________________________________________
📌 Option Symbol Inputs (LTP Tracking)
✅ Call Symbol: ATM CE (same strike as Put)
✅ Put Symbol: ATM PE (same strike as Call)
✅ Symbol Tips: Use Tradingview dropdown to select NSE option symbols like NSE:RELIANCE25JUL3000CE and PE
⚠️ Providing valid option symbols is essential — all live data relies on them.
________________________________________
📌 Trade Setup Parameters
Spot Price at Entry
Strike Price (same for both legs)
Buy Price (for Long Straddle)
Sell Price (for Short Straddle)
Lot Size & Number of Lots
Loss Bearable Amount (₹) → Used by Smart Exit logic to trigger warnings
________________________________________
📌 Expiry Date Input
Expiry Year, Month, and Day
🎯 Used to calculate Days to Expiry (DTE) and enable:
⏱️ Expiry alerts like “Less than 2 Days”, “Theta Risk”, etc.
📉 Smart Exit logic dynamically adapts based on DTE
________________________________________
📌 Greeks (Optional)
🔹 Default: Leave Greeks empty
🔹 Optional: Input Delta, Gamma, Theta, IV for both Call & Put
🔍 Enables:
Net Delta, Gamma, Theta, IV
Greek-based alerts and visual verdict
🟢 Conservative 🟡 Moderate 🔴 Aggressive Risk
________________________________________
📌 Dashboard Display
📈 Strategy Type: Long or Short Straddle
💹 Entry Premiums & Live Net LTP
📊 Net Premium, Max Profit/Loss
📉 Real-time PnL (tick-level)
📐 Breakeven range
📊 ROI %, Risk:Reward & trade verdict
🚦 Smart Exit verdict: Hold, Exit Soon, or Book Loss
🔁 Reversal Range for invalidation
📆 Days to Expiry (DTE)
📐 Greek Data (if enabled) with Net & Avg values
⚠️ Greek Risk Verdict for managing directional exposure
________________________________________
📌 Alert System (Built-in Alerts)
🎯 Target Profit Hit
❌ Max Loss Reached
🛑 Loss Bearable Limit Breached
📍 Hold Signal
📉 Book Loss / Exit Soon
⏳ Expiry Nearing
⚠️ Reversal Breach (spot breaks outside expected range)
💥 High Gamma Risk (> ±0.05)
📉 High IV Alert (> 35%)
🚨 Combined Master Alert — if any key risk triggers
________________________________________
📌 Smart Exit System
⚙️ A dynamic, context-aware trade assistant
✅ Assesses price movement, expiry risk, and loss thresholds
✅ Provides real-time exit suggestions to prevent overholding
✅ Filters emotional decisions — encourages disciplined trading
________________________________________
📌 Reversal Exit Logic (For Straddles)
🔁 Detects directional invalidation
Reversal Range = ±35% of Total Premium around strike price
⚠️ If spot breaches this range, trade likely invalid — exit advised
📉 Works as directional filter for neutral strategies
________________________________________
⚠️ Important Notes
✅ Built for NSE Options – not suitable for other exchanges
✅ Designed only for Long/Short Straddles
✅ Use on 1-second chart only
❌ Will malfunction on higher timeframes
✅ For manual use only — no automation
✅ For educational and research use only
________________________________________
💬 How to Use This Dashboard
1️⃣ Select Strategy
Long Straddle (Buy Both Legs) or Short Straddle (Sell Both Legs)
2️⃣ Input Symbols
Use accurate NSE symbols for CE & PE
3️⃣ Enter Strike & Premiums
Same strike for both legs. Add Buy or Sell prices
4️⃣ (Optional) Enter Greeks
Add Delta, Gamma, Theta, IV for both legs
5️⃣ Set Expiry
Year, Month, Day — enables DTE alerts
6️⃣ Track Dashboard
Live PnL, Net Premium, ROI, Reversal Range, Smart Exit
7️⃣ Enable Alerts
Get push/email/sound notifications for PnL, expiry, and Greek risks
________________________________________
🤝 Final Note
This tool was built with patience and care by simpletradewithpatience to help fellow options traders trade more objectively, systematically, and confidently.
Feel free to share feedback on Tradingview.
Happy Trading! 📈
Stay disciplined. Stay smart.
________________________________________
🔠 Glossary
PnL – Profit & Loss
LTP – Last Traded Price
IV – Implied Volatility
DTE – Days to Expiry
ROI – Return on Investment
R:R – Risk to Reward Ratio
CE / PE – Call / Put Option
SEBI – Securities and Exchange Board of India
________________________________________
⚠️ Disclaimer
This script is for educational and research purposes only.
I am not a SEBI-registered advisor.
No buy or sell recommendations are made.
Trading options involves significant risk.
Use proper risk management and always consult a licensed advisor if in doubt.
The author is not responsible for any financial losses incurred.
By using this tool, you agree to these terms.
________________________________________

Straddle Charts - Live
Description :
This indicator is designed to display live prices for both call and put options of a straddle strategy, helping traders visualize the real-time performance of their options positions. The indicator allows users to select the symbols for specific call and put options and fetches their prices on a 1-minute timeframe, ensuring updated information.
Key Features :
Live Call and Put Option Prices: View individual prices for both call and put options of the straddle, plotted separately.
Straddle Price Calculation: The total price of the straddle (sum of call and put) is displayed, allowing for easy monitoring of the straddle’s combined movement.
Customizable Inputs: Easily change the call and put option symbols directly from the settings.
Use this indicator to stay on top of your straddle's value and make informed trading decisions based on real-time data.

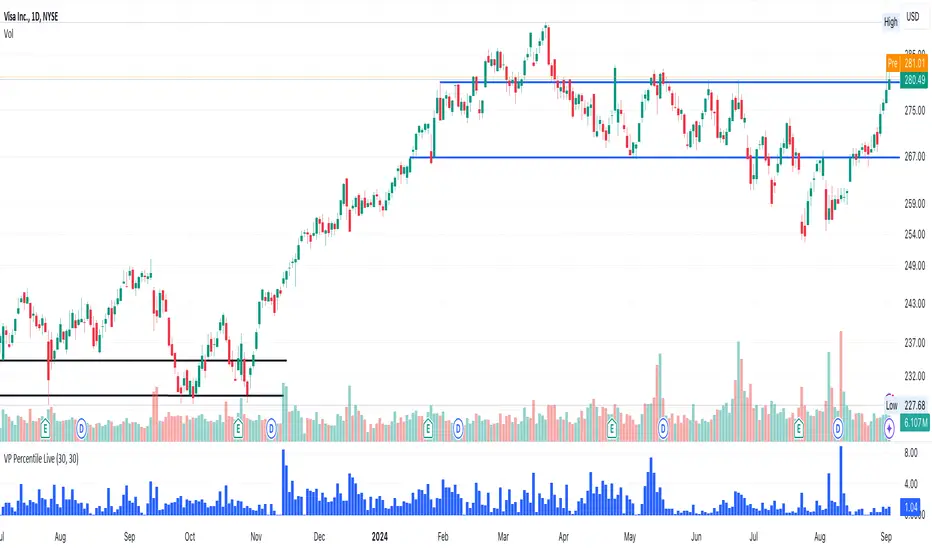
Volume-Price PercentileDescription:
The "Volume-Price Percentile Live" indicator is designed to provide real-time analysis of the relationship between volume percentiles and price percentiles on any given timeframe. This tool helps traders assess market activity by comparing how current volume levels rank relative to historical volume data and how current price movements (specifically high-low ranges) rank relative to historical price data. The indicator visualizes the ratio of volume percentile to price percentile as a histogram, allowing traders to gauge the relative strength of volume against price movements in real time.
Functionality:
Volume Percentile: Calculates the percentile rank of the current volume within a user-defined rolling period (default is 30 bars). This percentile indicates where the current volume stands in comparison to historical volumes over the specified period.
Price Percentile: Calculates the percentile rank of the current candle's high-low difference within a user-defined rolling period (default is 30 bars). This percentile reflects the current price movement's strength relative to past movements over the specified period.
Percentile Ratio (VP Ratio): The indicator plots the ratio of the volume percentile to the price percentile. This ratio helps identify periods when volume is significantly higher or lower relative to price movement, providing insights into potential market imbalances or strength.
Real-Time Data: By fetching data from a lower timeframe (e.g., 1-minute), the indicator updates continuously within the current timeframe, offering live, intra-candle updates. This ensures that traders can see the histogram change in real-time as new data becomes available, without waiting for the current candle to close.
How to Use:
Adding the Indicator: To use this indicator, add it to your chart on TradingView by selecting it from the Indicators list once it is published publicly.
Setting Parameters:
Volume Period Length: This input sets the rolling window length for calculating the volume percentile (default is 30). You can adjust it based on the desired sensitivity or historical period relevance.
Candle Period Length: This input sets the rolling window length for calculating the price percentile based on the high-low difference of candles (default is 30). Adjust this to match your trading style or analysis period.
Interpreting the Histogram:
The histogram represents the volume percentile divided by the price percentile.
Above 1: A value greater than 1 indicates that volume is relatively strong compared to price movement, which may suggest high activity or potential accumulation/distribution phases.
Below 1: A value less than 1 suggests that price movement is relatively stronger than volume, indicating potential weakness in volume relative to price moves.
Near 1: Values close to 1 suggest a balanced relationship between volume and price movement.
Application: Use this indicator to identify potential breakout or breakdown scenarios, assess the strength of price movements, and confirm trends. When volume percentile consistently leads price percentile, it might signal sustained interest and support for the current price trend. Conversely, if volume percentile lags significantly, it might warn of potential trend weakness.
Best Practices:
Multiple Timeframe Analysis: While the indicator provides real-time updates on any timeframe, consider using it alongside higher timeframe analysis to confirm trends and volume behavior across different periods.
Customization: Adjust the period lengths based on the asset’s typical volume and price behavior, as well as your trading strategy (e.g., short-term scalping vs. long-term trend following).
Complement with Other Indicators: Use this indicator in conjunction with other volume-based tools, trend indicators, or momentum oscillators to gain a comprehensive view of market dynamics.
[BCT] Option Pricing via Markov Chain Monte Carlo SimulationOverview:
This script offers a toolkit for quantitative options trading, using Monte Carlo simulations based on actual historical returns to model potential future price paths for underlying assets. A range of metrics related to options trading are also provided.
Monte Carlo Simulations:
The script employs Monte Carlo simulations to model future price paths based on the historical returns of the underlying asset. These simulated paths are represented as parabolas at the 2-sigma, 25th percentile, and median levels for quick reference.
Methodologies:
For calculating options prices at At-the-Money (or any user-selected strike), two methodologies are used:
Simple Averaging: Takes the mean of the simulated asset price paths.
Kernel Density Estimation (KDE): Applied to the simulated asset price paths to produce a smoothed estimate of its probability density function, thereby aiding in a more nuanced option price calculation.
Bootstrap Resampling:
Bootstrap resampling is specifically applied to the simulated asset price paths to generate an estimate of the standard deviation of the options prices. Note that while bootstrap methods are employed, they serve as statistical tools and do not guarantee statistical reliability.
Metrics Displayed:
Model-Estimated At-the-Money (or selected strike) Straddle Price
Model-Estimated At-the-Money (or selected strike) Call Price
Model-Estimated At-the-Money (or selected strike) Put Price
Model-Estimated Standard deviation for Option Prices from simulated price paths
Underlying Monte Carlo Simulation Results (represented as parabolas at the 2 sigma, 25 percentile and median)
This is not financial advice. Use at your own risk.
Disclaimer: Options trading carries a high level of risk and may not be suitable for all investors. This script is intended to serve as an educational tool and should not be considered financial advice. While designed to aid in decision-making, the script's indicators are not guarantees of performance or outcomes. Always conduct your own due diligence before making trading decisions.

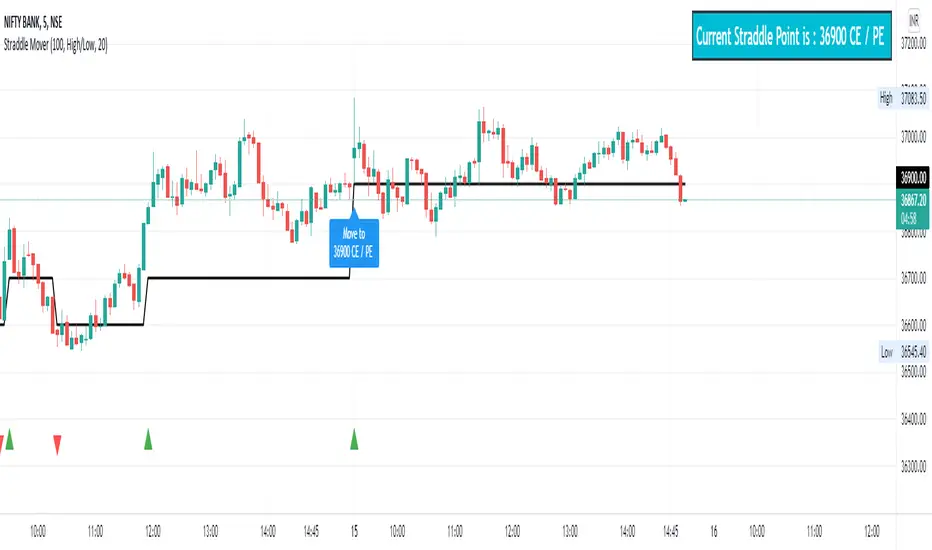
Straddle MoverStraddle Mover is an indicator especially made for option writer / seller who wants to do straddle and adjust the position based on the market trend / movement. It can be use for iron fly strategy too.
Settings: User must know the settings of the indicator before using.
First one is Option Strike Difference , user need to enter the correct option strike difference of the particular instrument / stock / indices, one can get it from option chain. For example, Nifty having 50 points differences in each option strike and bank nifty having 100 points. So, Nifty user must enter 50 and Bank nifty user must enter 100 in this setting.
Second is Straddle Type based on , user can choose the type of the straddle mover. There are two options to choose, 1) High/Low is based on current day high/low average near strike to make straddle and 2) Trend is based on recent N number of candle(s) average near strike to make straddle.
Third is Trend Length , default value is 20 which generally used in vwma , donchian channel and other trend finding indicators. User can change if need.
If user select high/low based type then length is not important.
Note : Option Strike Difference and Straddle type based on is very important setting to use this indicator.
User must do adjustments based on their own risk and strategy. This indicator is only for education purpose.
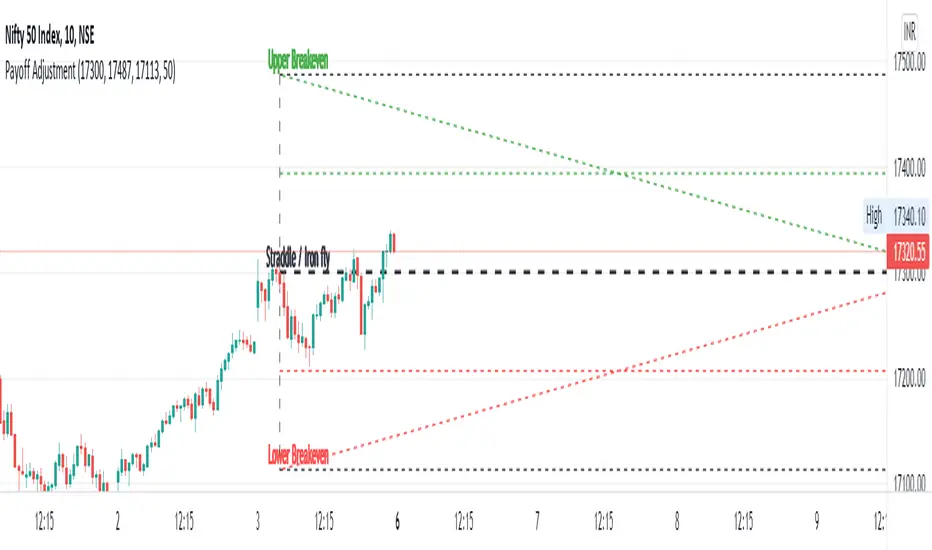
Straddle / Ironfly AdjustmentStraddle / Iron fly Adjustment is an indicator to assist (especially) Nifty / Bank Nifty Option Writers / Sellers (other instrument writers also) to draw their straddle / iron fly payoff diagram in the chart, mainly max profit and breakeven points and do adjustment based on the market movement.
Basic Idea: (My Conclusion for making this Indicator)
1) For Straddle / Iron fly writers need to adjust their position based on the market movement.
2) Here I give two adjustment ideas which one is my favorite method and another one is one of my friends is using.
a) Price Vs Time based Adjustment
I usually wait until price cross the price vs time line to do any adjustment. Generally, price vs time-based adjustment gives you more point to enter any adjustment in initial day/time when you created the straddle / iron fly. But one later it will reduce the range it become narrow.
b) Percentage based Adjustment
This method using by one of my friends which is based percentage between straddle / iron fly line and upper / lower breakeven points. Generally, he using 50 percentage. In this indicator we do have option to change the percentage between 25 to 100.
User must give inputs to see the straddle / iron fly diagram (Max Profit, Breakeven points, Adjustment, Percentage based adjust line and so)
This is not an intraday indicator and also its not suggesting you to take any buy/sell or straddle/iron fly positions. Its just giving an opportunity to draw a payoff diagram of for max profit and breakeven zone. And also helps to identify the adjustment based given scenario.
Happy Trading 😊
Saravanan Ragavan
0_dteUSAGE
This script guages the probability of an underlying moving a certain amount on expiration day, to aid the popular "0 dte" strategy. The script counts how many next-day moves exceeded a given magnitude in the past, under similar conditions. The inputs are:
mark_mode:
- "open": measures the magnitude as "open to close"--a true 0 dte.
- "previous close": for lazy people who don't want to wake up early. measures magnitude from the previous day's close.
move_mode:
- "percent": measures moves that exceed a given percentage.
- "absolute": measures moves that exceed a point value.
move-dir: measure only up moves, down moves, or both.
vol_model: the model for realized volatility. (may add more later).
min_vol: only measure moves when realized vol is above this value.
max_vol: only measure moves when realized vol is below this value.
precision: number of digits printed in the output table.
EXAMPLE:
- mark_mode: "previous close"
- move_mode: "percent"
- move_dir: "up"
- move_mag: 0.07
- vol_model: hv30
- min_vol: 0.2
- max_vol: 0.5
These settings will count the number of trading days that closed 7% higher than the previous day's close, when the previous day's realized volatility (annualized) was between 20% and 50%. The outputs are:
- current vol: green plot. Today's realized vol. Shown for convenience.
- max and min vol: red plots. Also shown for convenience.
- count: the number of days that exceeded the chosen magnitude, when the previous day's realized volatility was within the chosen bounds.
- total: the total number of days where realized volatility was within the chosen bounds
- probability: count / total. the percentage of days that exceeded the move when volatility was within the bounds.
- move: plotted as a purple line. purple "X" labels are plotted above
- bars where the move exceeded the magnitude threshold and volatility was in-bounds. a "hit".
CONCLUSION
This script is based on the idea that realized volatility has some bearing on future volatility. By seeing what happened in the past when volatility was close to its current value, we may be able to assess the probability that our short put will be in the money, tomorrow, and our account devastated.
NOTE: Unlike many of my other scripts, all percentages--both inputs and outputs--are given in fractional form. E.g., 0.01 means 1%.

Intrangle - Straddle / StrangleIntrangle is an indicator to assist Nifty / Bank Nifty Option Writers / Sellers to identify the PE / CE legs to Sell for Straddle and Strangle positions for Intraday.
Basic Idea : (My Conclusion for making this Indicator)
1) Last 10 Years data says Nifty / Bank Nifty More than 66% of times Index are sideways or rangebound (within 1% day) .
2) Mostly, First one hour high and low working as good support and resistance.
Once First one hour complete, this indicator will show Strangle High (CE), Strangle Low (PE) and Straddle (CE/PE).
Straddle:
If you want to do straddle strategy, sell at the money strike (CE/PE) when price comes near to the straddle line (black line),
Strangle:
If you want to do Strangle strategy, sell Strangle High (CE) and Strangle Low (PE) when price comes near to the straddle line (black line). Both Strangle High and Low will be out of the money when price near to the straddle line (black line).
Adjustment: option adjustment to be done based on the price movement. Adjustment purely up to the user / trader.
Note1: If price not comes to near straddle line after first hour, better to stay light…
Note2: If first hour not giving wide High / Low, don’t use strangle strike based on this indicator. Straddle can be done any day with require adjustment / hedge. This Indicator is purely for education purpose, user / trader has to be back-tested before their start using it.
This indicator will work in Nifty / Bank Nifty only. Best Time frames are 3/5/15 Mins. This is purely made for Intraday
Happy Trading 😊

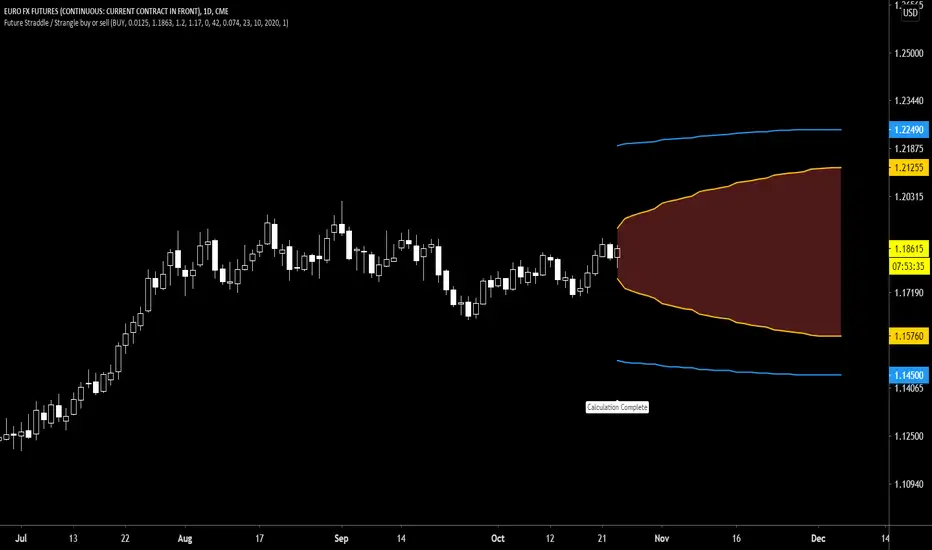
Future Straddle / Strangle buy or sell indicatorFuture Straddle / strangle buy or sell indicator developed by Chobotaru Brothers.
You need to have basic knowledge in option trading to use this indicator!
The indicator shows P&L lines of the options strategy. Use only for futures since the mathematical model of options for Future instruments is different from stocks. Plus, the days' representation in futures is also different from stocks (stocks have fewer days than futures ).
***Each strategy in options is based on different mathematical equations, use this indicator only for the strategy in the headline.***
What does the indicator do?
The indicator is based on the Black-Scholes model, which uses partial differential equations to determine the option pricing. Due to options non-linear behavior, it is hard to visualize the option price. The indicator calculates the solutions of the Black-Scholes equation and plots them on the chart so traders can view how the option pricing will behave.
How the indicator does it?
The indicator uses five values (four dominants and one less dominant) to solve the Black-Scholes equation. The values are stock price, the strike price of the option, time to expiration, risk-free interest rate, and implied volatility .
How the indicator help the users?
-View the risks and rewards so you can know the profit targets in advance which means you can compare different options in different strikes.
-View the volatility change impact so you can know the risk and the P&L changes in case of a change in the volatility over the life of the option before you enter the trade.
-View the passage of time impact so you can know where and when you could realize a profit.
-Multi-timeframes so you can stay on the same chart (Daily and below).
All these features are to help the user improve his analysis while trading options.
How to use it?
The user needs to obtain from the “option chain” the following inputs:
-Buy or sell (the strategy)
- Straddle/strangle price bought/sold: enter the price that you bought/sold one options strategy.
-Instrument price when bought/sold: the stock price when you bought/sold the options strategy.
-Upper strike price: the upper strike price of the options strategy.
-Lower strike price: the lower strike price of the options strategy.
-Interest rate: find the risk-free interest rate from the U.S. DEPARTMENT OF THE TREASURY. Example: for 2% interest rate, input: 0.02.
-Days to expire: how many days until the option expires.
-Volatility: the implied volatility of the option bought/sold. Example: for 45% implied volatility , input: 0.45.
-Day of entry: A calendar day of the month that the option bought/sold.
-Month of entry: Calendar month the option bought/sold.
-Year of entry: Calendar year the option bought/sold.
-Risk to reward: Profit/loss line defined by the user. Minimum input (-0.95) ; maximum input (3).
Example: If the strategy was bought, -0.95 means, 95% of the options strategy value is lost (unrealized). If the strategy was bought, 3 means, the risk to reward is 3.
After entering all the inputs, press Ok and you should see “Calculation Complete” on the chart.
The user should not change the entry date and days to expire inputs as time passes after he entered the trade.
How to access the indicator?
Use the link below to obtain access to the indicator
Straddle / strangle buy or sell indicatorStraddle / strangle buy or sell indicator developed by Chobotaru Brothers.
You need to have basic knowledge in option trading to use this indicator!
The indicator shows P&L lines of the options strategy. Use only for stocks since the mathematical model of options for Future instruments is different from stocks. Plus, the days' representation in futures is also different from stocks (stocks have fewer days than futures ).
***Each strategy in options is based on different mathematical equations, use this indicator only for the strategy in the headline.***
What does the indicator do?
The indicator is based on the Black-Scholes model, which uses partial differential equations to determine the option pricing. Due to options non-linear behavior, it is hard to visualize the option price. The indicator calculates the solutions of the Black-Scholes equation and plots them on the chart so traders can view how the option pricing will behave.
How the indicator does it?
The indicator uses five values (four dominants and one less dominant) to solve the Black-Scholes equation. The values are stock price, the strike price of the option, time to expiration, risk-free interest rate, and implied volatility .
How the indicator help the users?
-View the risks and rewards so you can know the profit targets in advance which means you can compare different options in different strikes.
-View the volatility change impact so you can know the risk and the P&L changes in case of a change in the volatility over the life of the option before you enter the trade.
-View the passage of time impact so you can know where and when you could realize a profit.
-Multi-timeframes so you can stay on the same chart (Daily and below).
All these features are to help the user improve his analysis while trading options.
How to use it?
The user needs to obtain from the “option chain” the following inputs:
-Buy or sell (the strategy)
- Straddle/strangle price bought/sold: enter the price that you bought/sold one options strategy.
-Instrument price when bought/sold: the stock price when you bought/sold the options strategy.
-Upper strike price: the upper strike price of the options strategy.
-Lower strike price: the lower strike price of the options strategy.
-Interest rate: find the risk-free interest rate from the U.S. DEPARTMENT OF THE TREASURY. Example: for 2% interest rate, input: 0.02.
-Days to expire: how many days until the option expires.
-Volatility: the implied volatility of the option bought/sold. Example: for 45% implied volatility , input: 0.45.
-Day of entry: A calendar day of the month that the option bought/sold.
-Month of entry: Calendar month the option bought/sold.
-Year of entry: Calendar year the option bought/sold.
-Risk to reward: Profit/loss line defined by the user. Minimum input (-0.95) ; maximum input (3).
Example: If the strategy was bought, -0.95 means, 95% of the options strategy value is lost (unrealized). If the strategy was bought, 3 means, the risk to reward is 3.
After entering all the inputs, press Ok and you should see “Calculation Complete” on the chart.
The user should not change the entry date and days to expire inputs as time passes after he entered the trade.
How to access the indicator?
Use the link below to obtain access to the indicator

Rate Of Change Earnings Move - ROCEMRate Of Change Earnings Move
What is it and how does it work?
The Rate of Change Earnings Move indicator or ROCEM is an indicator designed for giving the user an idea of how much a stock has moved up or down in past earnings reports. This is ideal for options traders who can use ROCEM to calculate whether or not their long straddles are actually probable of happening.
How it works
The indicator measures the absolute value rate of change and then calculates the average rate of change for the day of the earnings report for the past 8 earnings reports (2 years). It then takes the current stock price and finds the upper and lower price based on the average rate of change for past earnings.
I have also included a moving average (purple line), use this to see if the current rate of change is higher than usual.
Additionally, earnings reports are marked with a red x on the indicator.
How to trade ROCEM
This is primarily made for options trading so I will be explaining how it can be used for that. It is not suited for traditional stock trading as it does not determine a market direction.
Select a stock with an upcoming earnings
Enter your per leg commissions in the indicator if you want it to calculate new upper and lower prices (makes it easier to determine if the options trade will pass the breakeven when commissions are factored in)
Compare your long straddle breakevens with the upper and lower prices of the indicator. If the upper breakeven is smaller than the upper price in ROCEM and the lower breakeven is larger than the lower price in ROCEM, then a long straddle position could be considered a reasonable trade based on past earnings performance.
