Previous Price Action## Previous Price Action - Market Structure Visualization Tool
**Three time-segmented boxes for enhanced market structure analysis:**
🟢 **240 Candles Box (Green)** - Historical context (candles -240 to -120)
🟡 **120 Candles Box (Yellow)** - Medium-term trend (candles -120 to -10)
🔴 **10 Candles Box (Red)** - Recent price action (last 10 candles)
**Key Features:**
- Non-overlapping time segments for clear trend analysis
- Uniform height based on 240-candle range for easy comparison
- 50% transparency to maintain chart readability
- Ideal for identifying momentum vs mean reversion conditions
**Perfect for:**
- Crypto day trading and scalping
- Market regime identification (trending vs choppy)
- Entry timing and trade management
- Duration of trend analysis
**Settings:** Fully customizable colors, transparency, and individual box toggle switches.
Structure

Morning Structure – Live 30 Min Range📝 Description:
This indicator captures the morning price structure by tracking the high and low during the first 30 minutes after market open (default: 9:30 AM to 10:00 AM, New York time).
🔧 How it works:
At market open, it begins tracking the highest high and lowest low
The high and low lines are dynamic and update in real-time during the first 30 minutes
Once the 30-minute range completes, the lines freeze at their final values
Lines extend horizontally across the rest of the session to mark the "Morning Range"
✅ Key Features:
Tracks live price action during the morning session
Freezes the structure after 30 minutes (or user-defined)
Automatically resets each new trading day
Built-in timezone setting (America/New_York) to align with standard U.S. market hours
Clean visual lines that scroll naturally with the chart
⚙️ Use Cases:
Identify morning breakout zones
Define support and resistance early in the session
Combine with breakout, fade, or range-trading strategies
⚠️ Note:
This version does not include alerts or labels, by design (clean and focused).
Those can be added easily for custom strategies.

FVG Candle HighlighterThis indicator highlights only the true Fair Value Gap (FVG) creator candle — the middle candle in a 3-bar FVG formation — with zero clutter.
🔹 Bullish FVG: Candle is colored if price gaps above the high two bars back
🔹 Bearish FVG: Candle is colored if price gaps below the low two bars back
✨ No boxes. No zones. Just pure, visual price-action accuracy.
🔧 Powered by Pine Script v6
🧠 Based on institutional-style FVG logic
🎯 Ideal for Smart Money / ICT / Order Block strategies

smc bullrider 1.0The smc bullrider 1.0 indicator is specifically crafted for mapping market structures. It excels in clearly recognizing type of Points Of Interest (SCOB) offering traders a straightforward and effective method to analyze market movements. It helps identify strategic entry points with precision.
🟠 Exploring Structure Mapping.
🔹This indicator presents a distinctive method for examining the market structure, emphasizing liquidity through the concept of 'Inducement'. Inducement plays a pivotal role in pinpointing essential structural indicators in the market, including Higher Highs (HH), Higher Lows (HL), Lower Lows (LL), and Lower Highs (LH).
🔹Consider Inducement as a strategically placed trap near supply or demand zones. It lures in eager buyers or sellers before the actual zone is reached, effectively creating liquidity. To validate an inducement, it must signify a legitimate pullback.
🔹A valid scenario arises when the price either sweeps or closes beyond the high or low of the preceding candle. In this context, the candle's color, whether bullish or bearish, holds no significance, and both situations are deemed valid. Inside bars are disregarded unless they meet this specific criterion. The indicator facilitates this process by automatically highlighting valid pullbacks with a distinctive gray round label.
🔹This feature serves not only as a visual guide but also as a vital tool for effortlessly comprehending market movements, offering a clear and visual representation of ongoing market trends
🟣 Understanding POI Functionality
🔹Single Candle Order Block (SCOB): Leveraging single-candle mitigation proves to be a powerful method for incorporating multiple entries into your successful trades.
🔵 How to Utilize the smc bullrider 1.0 Indicator:
🔹The smc bullrider 1.0 Indicator is crafted to elevate your trading strategy by pinpointing crucial order blocks and market signals. Below is a guide on how to make the most of the different components of the smc bullrider 1.0 Indicator:
🔹SCOB (Single Candle Order Block):
Application: SCOB is well-suited for scaling into a position. It is best utilized to increase positions when the market responds to OB or OB-EXT, signaling a potential reversal.
🟢Here's how to use it.
🔹Market Structure Drawing
This diagram depicts significant market indicators, such as instances of ascending prices (Higher Highs - HH) or descending prices (Lower Lows - LL). It serves as a valuable visual tool for comprehending the dynamics of market behavior
PICTURE (DIAGRAM)
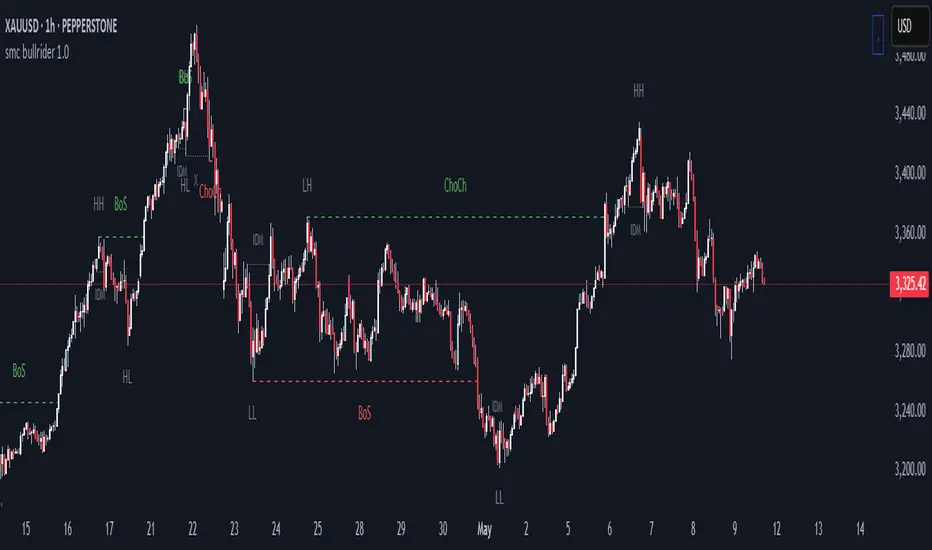
Live Chart Example: Our indicator efficiently dissects market structure, showcasing the 'Inducement' concept with precision in real-time trends—highlighting HH, HL, LL, and LH
PICTURE (REAL CHART)
Valid Pullback ( IDM ):
Valid Pullback Example: This image illustrates a common situation where the price extends beyond the high or low of the preceding candle, signifying a valid pullback. Pay attention to the identifiable gray dotted line label marking the inducement point.
PICTURE (DRAW/REAL)
Single Candle Order Block (SCOB)
The provided chart showcases the SCOB in a real trading setting, highlighting its effectiveness in optimizing trades.
🟡 Summary
🔹smc bullrider 1.0 Indicator distinguishes itself in the realm of market analysis, with a distinct focus on structure mapping and high-probability Point of Interest (POI).
Furthermore, it provides a visual representation of three key areas for each market move: discount, premium, and the equilibrium area at 50%. Its innovative approach involves scrutinizing market structure using the 'Inducement' concept, a pivotal strategy for identifying vital structural markers and steering
Vietnamese Market Structure With CountersThis indicator is designed to track Market Structure with Swing-Low Breakdowns and Swing-High Breakups specifically tailored for the Vietnamese stock market, though it can be applied elsewhere too. By default, it uses a 10-period EMA to dynamically detect key turning points in price action and count significant breakdowns or breakups from previous swing levels.
As an open source, you can modify the source code to match your needs.
What it does:
Detects when price breaks below previous swing lows or above previous swing highs.
Plots swing levels for both highs and lows.
Displays labeled counters on the chart to show how many consecutive breakdowns or breakups have occurred.
Helps traders identify trend shifts and possible exhaustion in moves.
Why it's useful:
This tool is great for visually tracking market momentum and structure changes — especially in trending or volatile environments. It emphasizes structure over indicators, helping you understand price behavior in a simplified, intuitive way.
License:
This script is published under the Mozilla Public License 2.0. Feel free to use, modify, and contribute!
Created with care by @doqkhanh.
If you find it useful, consider leaving a comment or sharing it with others!

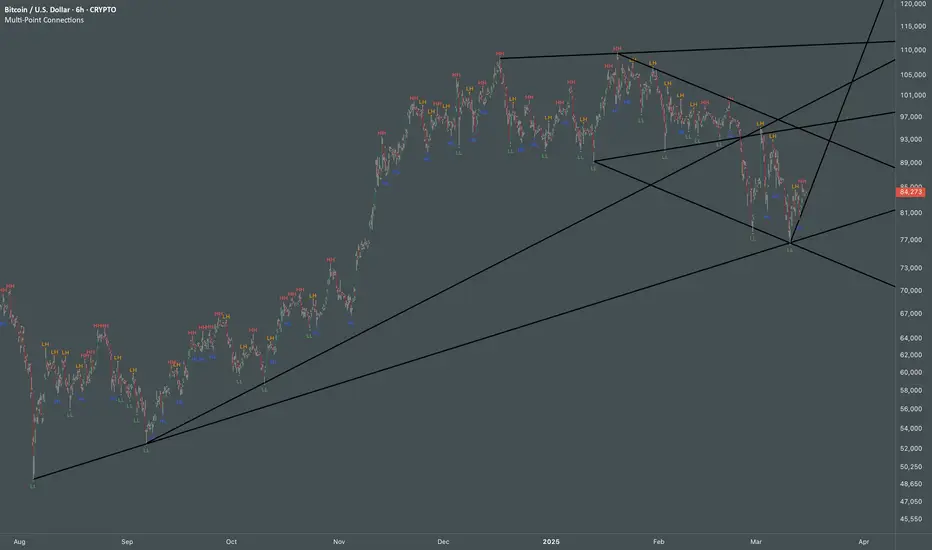
Multi Swing Point ConnectionsMulti Swing Point Connections — Tool for custom Highs & Lows structure mapping. This indicator allows to create fully customizable connections between multiple types of swing points, offering advanced visual structure of price dynamics.
Features:
Dynamic Swing Detection using adjustable pivot period.
Connect up to 8 swing relationships, with individual controls for swing points: 🔴 Higher High, 🟠 Lower High, 🔵 Higher Low, 🟢 Lower Low
Countback customization (steps for historical/future reference)
Optional enabling/disabling per connection
Visual Structure Mapping with configurable line color and width.
Perfect for identifying key structure shifts
Mapping trending vs consolidating phases
Building your own internal order flow frameworks
Inputs:
Swing Period: Defines how many bars to the left/right are used to detect pivot highs/lows.
Line Customization: Adjust style, width and color for visual clarity.
Connection Parameters: Select which swing types to connect, and control how far back and forward to look when making the connection.
Connection Examples:
HH to LH - Mapping potential bearish transition. Often signals weakening bullish momentum and a potential bearish shift in structure.
LL to HL - Mapping potential bullish transition. Suggests buyers stepping in earlier and potential bullish momentum building.
HL to LH (or LH to HL) - these can indicate sideways structure — often in consolidating or compressing price action depending on custom steps.
HH to HH (or LL to LL) - Connecting successive HHs or LLs visualizes higher highs in uptrends or lower lows in downtrends — a classic trend-following perspective.
HL to HL (or LH to LH) - Connecting successive HLs (or LHs) can highlight the “internal” structure between impulse legs, often defining minor trend channels or short-term ranges within the larger trend.
MTF Fractals [RunRox]🔽 MTF Fractals is a powerful indicator designed to visualize fractals from multiple timeframes directly on your chart, highlight liquidity sweeps at these fractal levels, and provide several additional features we’ll cover in detail below.
We created this indicator because we couldn’t find a suitable tool that met our specific needs on TradingView. Therefore, we decided to develop a valuable indicator for the entire TradingView community, combining simplicity and versatility.
⁉️ WHAT IS A FRACTALS?
In trading, a fractal is a technical analysis pattern composed of five consecutive candles, typically highlighting local market turning points. Specifically, a fractal high is formed when a candle’s high is higher than the highs of the two candles on either side, whereas a fractal low occurs when a candle’s low is lower than the lows of the two adjacent candles on both sides.
Traders use fractals as reference points for identifying significant support and resistance levels, potential reversal areas, and liquidity zones within price action analysis. Below is a screenshot illustrating clearly formed fractals on the chart.
📙 FRACTAL FORMATION
Here’s how fractals form depending on your chosen setting (3, 5, 7, or 9):
▶️ 3-bar fractal – forms when the central candle is higher (for highs) or lower (for lows) than one candle on each side.
▶️ 5-bar fractal – forms when the central candle is higher or lower than two candles on both sides.
▶️ 7-bar fractal – forms when the central candle is higher or lower compared to the three candles on each side.
▶️ 9-bar fractal – forms similarly but requires four candles on each side, making the fractal significantly more reliable and robust.
A higher number of bars ensures stronger fractal levels, highlighting more significant potential reversal points on the chart.
Now that we’ve covered the theory behind fractal formation, let’s explore the indicator’s functionality in more detail.
Below, I’ll explain each feature clearly and illustrate how you can effectively utilize this indicator in your trading.
🕐 MULTI-TIMEFRAME FRACTALS
We realized that displaying fractals only from the current timeframe isn’t always convenient, so we’ve introduced Multi-Timeframe Fractals into this indicator.
Now you can easily display fractals from higher timeframes directly on your current chart, providing you with broader market context and clearer trading signals.
Fractals from Current Timeframe – Fractals identified directly on the chart’s current timeframe.
Fractals from Higher Timeframes – Fractals sourced from higher timeframes and displayed clearly on your current chart for enhanced market perspective.
📈 FRACTAL LINES
Since fractals represent areas of high liquidity, we’ve added an option to extend fractal levels horizontally as Fractal Lines across your chart.
This feature allows you to clearly visualize critical liquidity areas from higher timeframes, directly on your current timeframe chart, as demonstrated in the screenshot below.
With this approach, you can clearly visualize significant fractal levels from higher timeframes directly on your current chart - for example, projecting fractals from the 1-hour (1H) timeframe onto a 3-minute (3m) chart. ✅ This helps you easily identify critical liquidity areas and potential reversal zones without the need to switch between multiple timeframes.
💰 LIQUDITY SWEEP (LIQUDITY GRAB)
To enhance your trading experience, we’ve introduced a feature that clearly identifies liquidity sweeps of fractal levels.
A Liquidity Sweep occurs when a candle closes beyond a fractal line, leaving a wick that pierces through it, signaling that liquidity has been collected at this level.
Below, you’ll find two examples illustrating this functionality:
▶️ Fractal lines from the current timeframe
▶️ Fractal lines projected from higher timeframes
The first example illustrates liquidity being swept from fractals on the current timeframe .
Here, the candle clearly closes beyond the fractal line, leaving a wick through it. This indicates a liquidity sweep at the fractal level, visually highlighting a potential reversal or continuation opportunity directly on your chart.
In the second example, fractals from the higher timeframe are projected onto your current chart.
When a candle on your current timeframe closes beyond an HTF fractal line - leaving a wick through this level - the indicator highlights it clearly. This signals to traders a potential reversal zone, indicating that liquidity has been swept, and price may reverse or significantly react from this area.
You can also enable the display of additional labels on the chart. These labels clearly mark liquidity sweeps at fractal levels, making it easier to visually identify potential reversal points directly on your chart.
⚙️ SETTINGS
Below are the indicator settings with detailed explanations for each parameter.
🔷 Bars in Fractal – Number of candles to the right and left required to form a fractal.
🔷 Fractal Timeframe – Select the timeframe from which you want to display fractals on the current chart.
🔷 Max Age, bars – Number of bars during which the fractal will remain active.
🔷 Show Fractal Line – Display or hide fractal lines.
🔷 Line Style – Choose the style of the line displayed on the chart.
🔷 Line Width – Thickness of the fractal line.
🔷 High Fractal – Style and color of bearish fractals.
🔷 Low Fractal – Style and color of bullish fractals.
🔷 Fractal Label Size – Select the size of fractal labels.
🔷 Show Sweep Labels – Option to display labels when a liquidity sweep occurs.
🔷 Label Color – Color and transparency of the area marked on the chart during a sweep.
🔷 Shade Sweep Area – Show or hide the sweep area shading.
🔷 Area Color – Color and transparency settings for the sweep area.
🔶 We’d love to hear your feedback and any suggestions for additional features you’d like to see in this indicator. We’ll be happy to consider your ideas and continue improving the indicator!

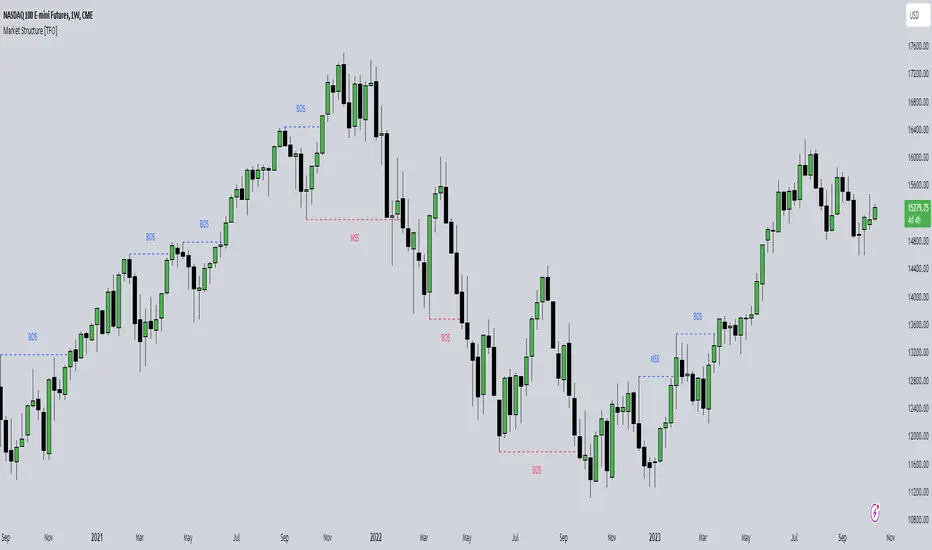
Market Structure HH, HL, LH and LLMarket Structure Indicator (HH, HL, LH, LL) – Explanation and Usage
Overview:
This indicator is designed to detect and visualize market structure shifts by identifying Higher Highs (HH), Higher Lows (HL), Lower Highs (LH), and Lower Lows (LL). It plots a ZigZag structure to mark trend changes, helping traders analyze price swings and market direction.
Indicator Logic:
The indicator operates based on ZigZag swing points to define trend shifts and structure changes.
Identifying Market Swings:
It finds local highs and lows using the ZigZag Length (zigzag_len), which defines how many bars back to check for a new swing high/low.
If the current high is the highest over zigzag_len periods, it marks it as a swing high.
If the current low is the lowest over zigzag_len periods, it marks it as a swing low.
Determining Market Structure:
Uptrend: Higher Highs (HH) & Higher Lows (HL)
Downtrend: Lower Lows (LL) & Lower Highs (LH)
The script continuously tracks the last two highs (h0, h1) and last two lows (l0, l1) to classify the current market structure.
Visual Elements:
ZigZag Line (Optional): Connects major swing highs and lows for trend visualization.
Labels (HH, HL, LH, LL):
HH (Higher High) – Price is making new highs → Uptrend Continuation.
HL (Higher Low) – Price forms a higher bottom → Uptrend Confirmation.
LL (Lower Low) – Price is making new lows → Downtrend Continuation.
LH (Lower High) – Price forms a lower top → Downtrend Confirmation.
Breakout Confirmation with Fibonacci Factor (Optional)
The indicator includes an option to confirm breakouts using the fib_factor, which ensures price moves beyond a certain retracement level.
How to Use This Indicator in Trading:
1. Identifying Trends & Trend Reversals
Uptrend: Look for a sequence of HH and HL.
Downtrend: Look for a sequence of LL and LH.
Trend Reversal: If price transitions from HH-HL to LH-LL, it signals a shift from an uptrend to a downtrend (and vice versa).
2. Confirming Entry & Exit Points
Buy Entry (Long Position)
Enter after a Higher Low (HL) is confirmed in an uptrend.
Combine with support zones or moving averages for confirmation.
Sell Entry (Short Position)
Enter after a Lower High (LH) is confirmed in a downtrend.
Combine with resistance zones or moving averages for confirmation.
Exit Strategy
Exit long trades when price fails to make a HH and forms an LH instead.
Exit short trades when price fails to make a LL and forms an HL instead.
3. Spotting Breakouts & Order Blocks
The Fib Factor setting allows traders to filter false breakouts by confirming price movement beyond a retracement threshold.
Potential Order Blocks can be identified by looking at the last major swing point before a breakout.
Benefits of This Indicator for Traders
✅ Trend Identification: Helps traders quickly determine if the market is in an uptrend or downtrend.
✅ Clear Market Structure Labels: Easily visualizes Higher Highs, Higher Lows, Lower Highs, and Lower Lows.
✅ Avoids Noise: The ZigZag algorithm removes small fluctuations and focuses on significant market movements.
✅ Assists with Entry & Exit Decisions: Provides objective signals for trend continuation or reversals.
✅ Works in All Markets: Useful for stocks, forex, crypto, and futures trading.
Would you like me to add additional features like Order Blocks, Breakout Confirmation, or Alerts to improve this indicator? 🚀

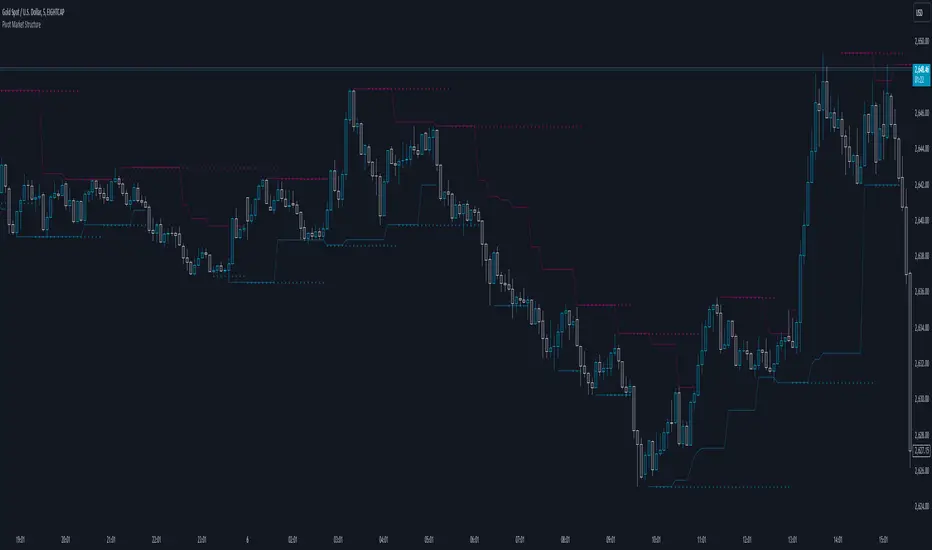
Pivot Market StructureDescription and Features
This script is designed to enhance technical analysis by identifying key market structure levels. It uses a price action trail (based on the last highest/lowest price) and pivot points to track market trends, offering insights into potential reversal zones or trend continuation signals.
How the Script Works
High/Low Trail Logic: The script includes a trail mechanism that compares the current price with the last highest and lowest price, determining whether the price has breached these levels. This helps pinpoint key price action events and potential trend shifts. Unlike pivot points the price action trail is more responsive changes within the market structure.
Step Size and Length for High/Low Trail:
- The Step Length parameter defines how many bars are used to compare the current price against the last highest/lowest price, providing a measure of price extremes.
- The Length parameter determines the number of bars considered for calculating the highest/lowest price since the last price action event (either price surpassing a previous high or dipping below a previous low).
Pivot Point Calculation: Pivot Point Highs are calculated by the number of bars with lower highs on either side of a Pivot Point High calculation. Similarly, Pivot Point Lows are calculated by the number of bars with higher lows on either side of a Pivot Point Low calculation. The script draws a line from/to every calculated pivot point to highlight market structure extremes. It can optionally extend these pivot lines to the left for added context, providing historical reference for decision-making.
Summary
By combining both pivot analysis and price action trailing techniques, the script provides a comprehensive view of a pivot point based market structure.
Swing Structure Scanner [LuxAlgo]The Swing Structure Scanner Indicator is a dashboard type indicator which displays a Consolidated "High/Low-Only" view of swing structure, with the capability to retrieve and display swing points from up to 6 different tickers and timeframes at once.
🔶 USAGE
This indicator displays swing structure data from up to 6 unique tickers or timeframes; Each graph represents the current swing structure retrieved from the requested chart/s.
Each swing graph displays the current live swing point positioning relative to the previous swing points. By analyzing the different formations, patterns can more easily be recognized and found across multiple tickers or timeframes at once.
This indicator serves as a nifty tool for confluence recognition, whether that's confluence throughout market tickers, or confluence through higher timeframes on the same ticker.
Alternatively, viewing the relative positioning of each swing point to each other, should give a clearer idea when higher lows or lower highs are formed. This can potentially indicate a newly forming trend, as well as serving as a warning to watch for breakouts.
The swing length can be changed to align with each individual's strategy, as well as a display look back can be adjusted to show more or less swing points at one time.
The display is fairly customizable, it is not fixed to 6 symbols at all times and can be minimized to only display the number of symbols needed; Additionally, the display can be set to vertical mode or horizontal(default) to utilize as needed.
Note: Hover over the swing point in the dashboard to get a readout of the exact price level of the swing point.
🔶 SETTINGS
Swing Length: Set the swing length for the structure calculations.
Swing Display Lookback: Sets the number of swing points (Pairs) to display in each Swing Graph display.
Symbols: Sets the Timeframe and Symbol for each Swing Graph.
Vertical Display: Display the Swing Graphs up and down, rather than side to side.
Scaling Factor: Scales the entire indicator up or down, to fit your needs.

Market StructureThis is an advanced, non-repainting Market Structure indicator that provides a robust framework for understanding market dynamics across any timeframe and instrument.
Key Features:
- Non-repainting market structure detection using swing highs/lows
- Clear identification of internal and general market structure levels
- Breakout threshold system for structure adjustments
- Integrated multi-timeframe compatibility
- Rich selection of 30+ moving average types, from basic to advanced adaptive variants
What Makes It Different:
Unlike most market structure indicators that repaint or modify past signals, this implementation uses a fixed-length lookback period to identify genuine swing points.
This means once a structure level or pivot is identified, it stays permanent - providing reliable signals for analysis and trading decisions.
The indicator combines two layers of market structure:
1. Internal Structure (lighter lines) - More sensitive to local price action
2. General Structure (darker lines) - Shows broader market context
Technical Details:
- Uses advanced pivot detection algorithm with customizable swing size
- Implements consecutive break counting for structure adjustments
- Supports both close and high/low price levels for breakout detection
- Includes offset option for better visual alignment
- Each structure break is validated against multiple conditions to prevent false signals
Offset on:
Offset off:
Moving Averages Library:
Includes comprehensive selection of moving averages, from traditional to advanced adaptive types:
- Basic: SMA, EMA, WMA, VWMA
- Advanced: KAMA, ALMA, VIDYA, FRAMA
- Specialized: Hull MA, Ehlers Filter Series
- Adaptive: JMA, RPMA, and many more
Perfect for:
- Price action analysis
- Trend direction confirmation
- Support/resistance identification
- Market structure trading strategies
- Multiple timeframe analysis
This open-source tool is designed to help traders better understand market dynamics and make more informed trading decisions. Feel free to use, modify, and enhance it for your trading needs.

Ultra Market StructureThe Ultra Market Structure indicator detects key market structure breaks, such as Break of Structure (BoS) and Change of Character (CHoCH), to help identify trend reversals. It plots lines and labels on the chart to visualize these breakpoints with alerts for important signals.
Introduction
This script is designed to help traders visualize important market structure events, such as trend breaks and reversals, using concepts like Break of Structure (BoS) and Change of Character (CHoCH). The indicator highlights internal and external price levels where the market shifts direction. It offers clear visual signals and alerts to keep traders informed of potential changes in the market trend.
Detailed Description
The indicator focuses on detecting "market structure breaks," which occur when the price moves past significant support or resistance levels, suggesting a potential reversal or continuation of the trend.
.........
Type of structure
Internal Structure: Focuses on smaller, shorter-term price levels within the current market trend.
External Structure: Focuses on larger, longer-term price levels that may indicate more significant shifts in the market.
.....
Key events
Break of Structure (BoS): A market structure break where the price surpasses a previous high (bullish BoS) or low (bearish BoS).
Change of Character (CHoCH): A shift in market behavior when the price fails to continue in the same direction, indicating a possible trend reversal.
Once a break or shift is detected, the script plots lines and labels on the chart to visually mark the breakpoints.
It also provides alerts when a BoS or CHoCH occurs, keeping traders informed in real-time.
The indicator can color the background and candles based on the market structure, making it easy to identify the current trend.
.....
Special feature
At news events or other momentum pushes most structure indicators will go into "sleep mode" because of too far away structure highs/lows. This indicator has a structure reset feature to solve this issue.
.........
Detects Break of Structure (BoS) and Change of Character (CHoCH) signals.
Marks internal and external support/resistance levels where market trends change.
Provides visual cues (lines, labels) and real-time alerts for structure breaks.
Offers background and candle color customization to highlight market direction.

Confirmed market structure buy/sell indicatorOverview
The Swing Point Breakout Indicator with Multi-Timeframe Dashboard is a TradingView tool designed to identify potential buy and sell signals based on swing point breakouts on the primary chart's timeframe while simultaneously providing a snapshot of the market structure across multiple higher timeframes. This dual approach helps traders make informed decisions by aligning short-term signals with broader market trends.
Key Features
Swing Point Breakout Detection
Swing Highs and Lows: Identifies significant peaks and troughs based on a user-defined lookback period.
Breakout Signals:
Bullish Breakout (Buy Signal): Triggered when the price closes above the latest swing high.
Bearish Breakout (Sell Signal): Triggered when the price closes below the latest swing low.
Visual Indicators: Highlights breakout bars with colors (lime for bullish, red for bearish) and plots buy/sell markers on the chart.
Multi-Timeframe Dashboard
Timeframes Monitored: 1m, 5m, 15m, 1h, 4h, 1D, and 1W.
Market Structure Status:
Bullish: Indicates upward market structure.
Bearish: Indicates downward market structure.
Neutral: No clear trend.
Visual Table: Displays each timeframe with its current status, color-coded for quick reference (green for bullish, red for bearish, gray for neutral).
Operational Workflow
Initialization:
Sets up a dashboard table on the chart's top-right corner with headers "Timeframe" and "Status".
Swing Point Detection:
Continuously scans the main timeframe for swing highs and lows using the specified lookback period.
Updates the latest swing high and low levels.
Signal Generation:
Detects when the price breaks above the last swing high (bullish) or below the last swing low (bearish).
Activates potential buy/sell setups and confirms signals based on subsequent price movements.
Dashboard Update:
For each defined higher timeframe, assesses the market structure by checking for breakouts of swing points.
Updates the dashboard with the current status for each timeframe, aiding in trend confirmation.
Visualization:
Colors the bars where breakouts occur.
Plots buy and sell signals directly on the chart for easy identification.

BOS TRADER [v 1.0] [Influxum]The name of the tool, BOS Trader, comes from the abbreviation BOS, which stands for Break Of Structure. In simple terms, this tool identifies situations where a change in market structure occurs after liquidity has been grabbed. Following the structural change, it looks for a point where the balance between buyers and sellers will be tested, potentially continuing the price movement in the direction of the structural break.
The goal of this tool is to identify areas where a trader can look for potential entry opportunities based on their entry rules and filters. In our own research, we found that while this tool is not a standalone strategy, it provides a statistical advantage that stems from the nature of the market itself. If you expect the market to reverse at a certain price level against a short-term, medium-term, or long-term trend, that reversal must logically begin with a change in structure – i.e., its break. BOS Trader then highlights the zone where you can expect a strong reaction from traders speculating on the continuation of price in the direction of the break.
Another important piece of the puzzle is the concept of liquidity. Liquidity grabs are generally considered by traders to be events that can trigger market direction changes. That's why BOS Trader is complemented with multiple ways to identify liquidity in the market from a Price Action perspective. We have explored the liquidity concept in depth in our other tools – the Liquidity Tool and Liquidity Strategy Tester – so we won’t go into too much detail on liquidity settings here.
🟪 Pivots
Liquidity can be found beyond pivot extremes – the highest candles in a series of candles. The pivot liquidity setting specifies how many candles must be before and after the pivot candle with a lower high for a pivot high or a higher low for a pivot low. A pivot high is the local highest point of the last 31 candles (15 before the pivot candle, the pivot candle itself, and 15 after). Another option is to set the time period in which the pivot extreme must occur. For example, you can differentiate between pivot highs of the Asian or London session.
🟪 % Percent Change
This setting is based on the well-known Zig Zag indicator and confirms swing highs or swing lows when there is a certain percentage change in price. This helps filter out noise that can occur when the market consolidates and randomly creates pivot highs or lows that aren’t significant.
🟪 Session High/Low
Many popular strategies are based on liquidity defined as the price range of a specific trading session. This doesn't have to be London, Asia, or New York sessions, but could be, for instance, the first hour of the New York session, and so on.
🟪 Day High/Low, Week High/Low, Month High/Low
As the name suggests, liquidity is often defined by the high/low of the previous day, week, or month. These price levels are watched by many market participants, and it's reasonable to expect reactions at these levels. That’s why we included this option in the BOS tool.
Tip for Traders
To avoid common issues with setting the correct session time, we have added the BG option to the tool – the ability to display a background for the configured trading session. This makes it easy to verify that your trading session is set correctly in relation to your time zone.
Delete grabbed liquidity
If a liquidity level is breached by price, it becomes invalid. For those who prefer to keep their charts clean and uncluttered, there is an option to delete grabbed liquidity. This way, only untraded, valid liquidity lines will be visible on the chart.
Bars after liquidity grab
A liquidity grab should be a significant event that triggers a reaction from market participants. To ensure this is a real response to liquidity rather than random market behavior, we added a time test to the BOS tool. A structural break must occur within a specified time after the liquidity grab. You can define this time in the tool as the number of bars after which the structural break is still considered valid following the liquidity grab.
🟪 AOI (Area of Interest) Settings
Initially, it's important to note that there are two main options for setting the behavior of the AOI. The first option is to fix its duration by the number of bars – Duration, and the second is to keep the AOI valid until it is traded through – Extended.
Duration
Since we expect a quick reaction to the liquidity grab, we also expect a fast pullback to the AOI and a swift response of traders. Our research has shown that the strongest reactions typically occur within a maximum of 15 bars from the formation of the AOI (fractally across timeframes). Therefore, this value is set as the default. However, we recommend considering not just the speed of the reaction but also its intensity. After the set number of bars, the AOI stops extending further.
Extended
We have noticed that price has a tendency to return to the AOI even after a longer period and react again. For this reason, we included the option in the BOS tool to extend the AOI into the future, with the ability to freely adjust the Max AOI Length.
🟪 AOI Size Mode
There are two options for setting the size of the AOI. Either it can be calculated as a percentage of the swing size (% of swing) in which the structural break occurred (the default setting is 30%), or you can set a different concept for the AOI size. For example, the well-known Optimal Trade Entry model. Custom values can be set in the FIBO Levels option, where you can define either preferred Fibonacci values or values based on your own criteria.
🟪 Trading Session (signals + alerts + visibility)
The main goal of our tools is to make it easier for traders to identify patterns and opportunities in the market and allow them to be alerted to their occurrence. The time for AOI plotting after a liquidity grab is combined into a single Trading Session function. This controls both the AOI plotting and when the tool will send alerts. All of this is aimed at helping traders avoid spending the entire day in front of their monitors, waiting for trading opportunities. Here, too, you can use the BG feature to plot a background on the chart showing the current session.
🟪 Trading within session range
We found that some traders have difficulty navigating the many AOIs plotted during times when the market consolidates and creates numerous false breakouts. Therefore, we included an option in the BOS tool to track only structural changes at the price extremes of the current day and trading session. The tool will not plot structural changes for internal liquidity grabs (within the session range), but only for external liquidity grabs (highest highs and lowest lows of the session or liquidity from previous days).
Visuals
The BOS tool is, of course, supplemented with the option to customize the appearance of all its components according to your preferences.

Market structure[TradeHub]Short Term Low(STL): A swing low, which is surrounded by candles with lows higher from the low of the central candle.
Short Term High(STH): A swing high that is surrounded by candlesticks with highs lower than the centre candlestick.
Intermediate Term Low (ITL): A level on a price chart where the price dips to a relatively lower point compared to the surrounding prices within an intermediate timeframe.
Intermediate Term High (ITH): A level on a price chart where the price peaks to a relatively higher point compared to nearby prices over an intermediate period.
Long Term Low (LTL): An Intermediate Term Low (ITL) that is flanked by higher Intermediate Term Lows (ITLs) on both sides, suggesting a potential major trend reversal and marking a possible long-term shift.
Long Term High (LTH): An Intermediate Term High (ITH) that is bordered by lower Intermediate Term Highs (ITHs) on either side, signaling a possible major reversal and indicating a long-term trend change.
This script is programmed to automatically detect these formations on a price chart. It identifies ITH/ITL and LTH/LTL points to help traders and analysts easily understand the market structure and spot potential turning points. These patterns are commonly used to make decisions regarding trade entries and exits.
It's important to keep in mind that although these concepts are based on recurring patterns in historical price movements, trading and investing in financial markets carry significant risks. Having a thorough knowledge of technical analysis, risk management, and market behavior is crucial before making trading choices.
Advantages:
- Ability to select any number of neighbouring candles to determine STH / STL
- Showing STH/STL on the whole chart history
- Large ITH/ITL/LTH/LTL chart history

LIT_Globas_sys - Liquidity Inducement Theorem (SMC, IDM)LIT_GLOBAL_SYS Trading Tool Documentation, is a comprehensive market analysis tool that includes all components needed for trading according to Liquidity Inducement Theorem (LIT). LIT differs from classical trading methods and is considered a highly effective and profitable strategy.
What can LIT_GLOBAL_SYS do?
--- Market Structure
The main feature of Liquidity Inducement Theorem is building the correct structure, specifically construction taking into account inducement (IDM). Thus, a new HH or LL can only form when the price has taken the first correct pullback - inducement (IDM), and after this, we understand the location of BoS (break of structure) and CHoCH (change of character).
LIT_GLOBAL_SYS automatically and perfectly displays the correct structure following all LIT rules. Looking at the indicator, a trader always understands which range the price is currently in and where it's trending at the moment. The indicator also shows dynamic (live) levels, providing a clear understanding of the market structure in real-time.
The indicator settings allow customization of each structural element according to trader preferences. For example, you can change the style, color, and shape of structural objects.
--- Correct Pullbacks and Inside Bars
In Liquidity Inducement Theorem, correct pullbacks are fundamental. The structure, order blocks, liquidity levels, order flow, and single candle order blocks (CSOB) are all built based on pullbacks.
What is a pullback?
- When the next candle updates the low of the previous candle, we can finish drawing an upward pullback
- We can start drawing a downward correct pullback when the next candle updates the low of the previous candle
- The downward movement will continue until the opposite occurs - updating the high of the previous candle
There are complexities in determining pullbacks - these are inside bars. In Liquidity Inducement Theorem, inside bars are completely ignored!
For example, in an upward movement, at some point, candles may stop updating the high and low of the previous candle and remain within the boundaries of the previous candle. Theoretically, there could be any number of such candles from 1 to infinity. In such cases, it's important to wait for the price to exit the mother candle (the candle after which other candles remained within its high and low range).
LIT_GLOBAL_SYS easily handles this and displays both pullbacks and inside bars correctly.
--- Order Blocks and Fair Value Gaps (FVG)
In Liquidity Inducement Theorem, order blocks are defined differently from classical order blocks:
1. The order block must take liquidity from the previous candle
2. The order block must have Fair Value Gaps (FVG) before it
3. Inside bars are completely ignored for both Order Blocks and FVG
4. If an OB fulfills the first condition (taking liquidity from the previous candle) but doesn't have FVG before it, this block is moved forward along the candles until there is an imbalance before it
There are two most important order blocks in LIT strategy:
1. Inducement order block (idm ob) - the first order block after Inducement
2. Extreme order block (Ext ob) - the first order block before CHoCH
LIT_GLOBAL_SYS perfectly displays correct order blocks and Fair Value Gaps following all rules. It offers full customization options:
- Specify the number of displayed OBs
- Disable all order blocks except idm ob and Ext ob
- Change block frame color and style
- Disable or modify text display in blocks
--- Single Candle Order Block (Scob)
Rules for building Scob:
1. The candle takes liquidity from the previous candle and closes within the body of the previous candle
2. The candle following the Scob candle must close its body below the previous candle
3. Scob forms in continuation of the trend movement
4. Scob completely ignores inside bars
LIT_GLOBAL_SYS accurately displays Scob as triangles and fully ignores inside bars both left and right. The menu allows complete customization of display and quantity of displayed Scobs.
--- Liquidity Lines, Order Flow, and Three-Minute Rule
Auxiliary functions include:
- Liquidity Lines -
Each pullback is marked with a line, showing where unclosed liquidity exists. Completed lines can be hidden to help predict price movement and enter trades correctly.
- Order Flow -
The indicator implements order flow by drawing a line when a pullback is broken (closed by body) in the opposite direction until the second touch. If price moves away without a second touch, the line remains, showing unclosed OF and potential price return zones.
- Three-Minute Rule -
Some LIT traders use the three-minute rule: price manipulations in the last and first three minutes of each 15-minute candle are additional entry factors, especially in the last quarter of an hourly candle. LIT_GLOBAL_SYS displays this rule only on the one-minute timeframe with symbols below for M15 and H1.
--- Trading Sessions, PDH/PDL, and EMA
The system includes:
- Trading sessions (Tokyo, Frankfurt, London, New York) with customizable time settings
- Previous Day High and Previous Day Low (pdh/pdl) levels
- Exponential Moving Average (EMA) with adjustable length
- Equilibrium display between current BoS and CHoCH levels
--- Alert System
LIT_GLOBAL_SYS includes all necessary alerts for Liquidity Inducement Theorem:
1. SCOB
2. EMA
3. BoS, ChoCh, Sweep
4. IDM
5. IDM OB and Ext OB
Users can simply check the desired alerts in the menu and activate them to receive notifications when price reaches specified zones.

[DarkTrader] Swing OrderflowSwing Orderflow is a indicator that helps traders detect key swing highs and lows in price action. It is designed to enhance your charting experience by highlighting important support and resistance levels while providing clear visual cues on market structure changes. By tracking swing pivots and price trends, this indicator enables traders to make more informed decisions regarding potential entry and exit points in the market.
This indicator is inspired by @Fractalyst Indicator :
The core functionality of the script revolves around detecting swing highs and lows based on a customizable swing period. It identifies these pivots by comparing price movements over a specific time window, marking the points where price either peaks or bottoms out. Swing highs are plotted as resistance levels when the price breaks above a certain threshold, while swing lows are plotted as support levels when price breaks below it. These key points are represented with dotted lines and labels on the chart for easy reference.
Indicator In Use :
Swing High Calculation
A swing high occurs when the high of a specific bar (or candle) is greater than the highs of the surrounding bars within a defined range (called the swing period).
Function used to find the highest price within a specified range : ta.highest(period)
If the current price is greater than the highest price of this period, it's marked as a potential swing high.
A swing high generally represents a resistance level, where the price has reached a peak before declining.
Swing Low Calculation
A swing low occurs when the low of a specific bar is lower than the lows of the surrounding bars within the swing period.
Function used to find the lowest price within a specified range : ta.lowest(period)
If the current price is lower than this lowest price, it's identified as a swing low.
Swing lows represent support levels, where the price reaches a bottom before bouncing back.
These points are plotted on the chart, and the script also tracks whether price breaks above the swing high or below the swing low to determine trends or possible reversals.
BSL (Buy Side Liquidity)
BSL represents the Buy Side Liquidity, where traders are expected to have their buy orders (usually stop-loss orders for short positions).
When the price reaches a swing high, traders who are short may have stop orders placed above this level. Once these levels are breached, the script identifies this as a liquidity area where stop orders get triggered, causing potential upward price movement.
The script marks the swing high with a "BSL" label and line to indicate this key resistance and liquidity zone.
SSL (Sell Side Liquidity)
SSL refers to the Sell Side Liquidity, where traders place sell orders (usually stop-loss orders for long positions).
Swing lows are important levels where traders holding long positions place their stop orders. When the price drops below a swing low, it triggers these sell orders, causing potential downward price movement.
The script marks the swing low with an "SSL" label and line, signaling this key support and liquidity zone.
In essence, BSL and SSL represent areas where liquidity is pooled, making them critical points in price action. These liquidity areas, when breached, often lead to aggressive price moves, allowing traders to anticipate trends.

ziksfx Structure - LiteInspired by the 'mentfx Structure' indicator created by Anton (mentfx) on TradingView, I have developed my own unique version of the market structure indicator, enhancing it with features that resonate with my personal trading style and offer additional insights into market behaviour.
In the spirit of Anton's original concept, my indicator incorporates the fundamental idea of "sells before buys" for bullish ranges and "buys before sells" for bearish ranges. This methodological approach is designed to mirror the activities of large market participants who typically offload positions before accumulating again in a bullish context, and accumulate before offloading in a bearish context.
The "ranges" displayed on the chart represent historical and updated highs and lows, reflecting the structural delivery of price across any timeframe. This approach assumes that in a bullish range, the market is likely to sustain upward momentum until it reaches a new high or experiences a significant "sell before buy" scenario, and conversely in a bearish range.
Key Enhancements and Features:
Immediate Break of Structure (BOS) Recognition: This feature promptly updates the high/low to the candle that triggers a BOS, providing a more agile response compared to the original mentfx Structure's approach of waiting for a swing high/low to set the range. This adaptation allows me for quicker adaptation to the market's unfolding narrative.
Market Stage Visualization: By seamlessly integrating with the structure tracking, my indicator presents the current 'Market Stage,' offering a clear stage of the current market's phase, which is crucial for informed trading decisions. The core methodology for determining market stages is derived from the foundational concepts established by mentfx.
Moving Average Integration: The inclusion of a Moving Average (MA) within the indicator adds a layer of trend confirmation, reinforcing decisions based on market structure with established trend analysis techniques. You can use EMA or SMA.
Customizable Session Settings: Tailor the indicator to focus on specific market hours, enhancing its utility for session-based trading strategies and backtesting efficiency.
Triple M: The Triple-M feature is also included in this indicator, which provides a visual representation of the market's momentum and potential reverse.
ATR: Utilizes the Average True Range (ATR) to estimate stop loss levels, providing a data-driven method to manage risk in accordance with current market volatility.
Watermark: Displays the name of the ticker and the current timeframe directly on the chart for easy reference, ensuring clarity and orientation when analyzing multiple instruments or timeframes.
How It Works:
When a range is assigned as being bullish, it will continue updating the high until a new high is created after the bos (= the new high of the range) and will not update or change until a candle's body, open's or close's above it - which will re-update the high and update the low. The low will be updated based on the last time price had a candle (open or closure) below a previous candle low, and then will find the lowest low after the rule was met to assign a low (the idea here is to locate the last major "sell before buy" and showcase that range. And this will occur vice versa, where: when a range is assigned as bearish, it will continue updating the low until a true low is created (=low of the range) and will not update or change until a candle's body, open's or close's below it - which will reupdate the low and update the high. The high will be updated based on the last time price had a candle (open or closure) above a previous candle high, and then will find the highest high after the rule was met to assign a high (once again, the idea being to locate the last major "buy before sell" and showcase price as existing in that range.)
A high is considered as a high that has a lower high to its left and to its right. And a low is considered as a low that has a higher low to its left and to its right. These high and low are used to determine the final high or low of a Bullish or Bearish range (respectively).
Range Determination: The indicator assesses the market momentum and assigns a Bullish or Bearish state based on the most recent directional break.
High/Low Rules Adaptation: In a Bullish range, indicator updates the high if a candle's body, not just the wick, exceeds the current high. This subtle yet significant change allows for a more conservative and potentially more accurate portrayal of bullish sentiment.
Dynamic Updating: As the market evolves, the indicator recalibrates the high and low lines based on the latest price movements, ensuring that you always have the most current and relevant data.
The indicator is not merely a trend-following or scalping tool. It leverages a distinct interpretation of market behavior, focusing on the last major "sell before buy" in Bullish ranges and "buy before sell" in Bearish ranges. By doing so, it aims to pinpoint the true sentiment behind price movements, offering traders a more grounded basis for anticipating market trends.
Of course, a special acknowledgment is due to Anton for his foundational work and the insightful knowledge he's giving day-by-day. The principles of his structure tracking method and market approach have significantly influenced the creation of this indicator, which now carries those insights forward, adapted through the lens of my personal trading philosophy.

BigBeluga - Smart Money ConceptsSmart Money Concepts (SMC) is a comprehensive toolkit built around the around the principles of "smart money" behavior, which refers to the actions and strategies of institutional investors.
SMC transcends traditional technical analysis by delving deeper into this framework. This approach allows users to decipher the actions of these influential players, anticipate their potential impact on market dynamics, and gain insights beyond just price movements.
This all-in-one toolkit provide the user with a unique experience by automating most of the basic and advanced concepts on the chart, saving them time and improving their trading ideas.
🔹Real-time market structure analysis simplifies complex trends by pinpointing key support, resistance, and breakout levels.
🔹Advanced order block analysis leverages detailed volume data to pinpoint high-demand zones, revealing internal market sentiment and predicting potential reversals. This analysis utilizes bid/ask zones to provide supply/demand insights, empowering informed trading decisions.
🔹Imbalance Concepts (FVG and Breakers) allows traders to identify potential market weaknesses and areas where price might be attracted to fill the gap, creating opportunities for entry and exit
🔹Swing failure patterns help traders identify potential entry points and rejection zones based on price swings
🔹Liquidity Concepts, our advanced liquidity algorithm, pinpoints high-impact events, allowing you to predict market shifts, strong price reactions, and potential stop-loss hunting zones. This gives traders an edger to make informed trading decisions based on multi-timeframe liquidity dynamics
🔶 FEATURES
The indicator has quite a lot of features that are provided below:
Swing market structure
Internal market structure
Mapping structure
Discount/Premium zone
Adjustable market structure
Strong/Weak H&L
Sweep
Volumetric Order block / Breakers
Fair Value Gaps / Breakers (multi-timeframe)
Swing Failure Patterns (multi-timeframe)
Deviation area
Equal H&L
Liquidity Prints
Buyside & Sellside
Sweep Area
Highs and Lows (multi-timeframe)
🔶 BASIC DEMONSTRATION
The preceding image illustrates the market structure functionality within the Smart Money Concepts indicator.
Solid lines: These represent the core indicator's internal structure, forming the foundation for most other components. They visually depict the overall market direction and identify major reversal points marked by significant price movements (denoted as 'x').
Dotted lines: These represent an alternative internal structure with the potential to drive more rapid market shifts. This is particularly relevant when a significant gap exists in the established swing structure, specifically between the Break of Structure (BOS) and the most recent Change of High/Low (CHoCH). Identifying these formations can offer opportunities for quicker entries and potential short-term reversals.
Sweeps (x): These signify potential turning points in the market where liquidity is removed from the structure. This suggests a possible trend reversal and presents crucial entry opportunities. Sweeps are identified within both swing and internal structures, providing valuable insights for informed trading decisions.
🔶 USAGE & EXAMPLES
The image above showcases a detailed example of several features from our toolkit that can be used in conjunction for a comprehensive analysis.
Price rejecting from the bullish order block (POC), while printing inside a bullish SFP and internal structure turning bullish (Internal CHoCH).
The image further demonstrates how two bearish order blocks could potentially act as resistance zones when prices approach those levels. These areas might also offer attractive locations to place take-profit orders.
The price has reached our first take-profit level, but is exhibiting some signs of weakness, suggesting a potential pullback which could put the trade at higher risk.
On the other hand, the price action currently exhibits strong bullish sentiment, suggesting favorable entry points and a potential upward trend.
The price has now fully reached our take-profit zone and is also exhibiting bearish confluence, indicating a potential price reversal or trend shift.
🔶 USING CONFLUENCE
The core principle behind the success of this toolkit lies in identifying "confluence." This refers to the convergence of multiple trading indicators all signaling the same information at a specific point or area. By seeking such alignment, traders can significantly enhance the likelihood of successful trades.
In the image above we can see a few examples of the indicator used in confluence with other metrics included in the toolkit.
Liquidity Prints within order blocks
SFP close to the POC
Sweep in liquidity close to a fair value gaps
These are just a few examples of what applying confluence can look like.
🔶 SETTINGS
Window: limit calculation period
Swing: limit drawing function
Internal: a period of the beginning of the internal structure
Mapping structure: show structural points
Algorithmic Logic: (Extreme-Adjusted) Use max high/low or pivot point calculation
Algorithmic loopback: pivot point look back
Premium / Discount: Lookback period of the pivot point calculation
Show Last: Amount of Order block to display
Hide Overlap: hide overlapping order blocks
Construction: Size of the order blocks
Fair value gaps: Choose between normal FVG or Breaker FVG
Mitigation: (close - wick- avg) point to mitigate the order block/imbalance
SFP lookback: find a higher / lower point to improve accuracy
Threshold: remove less relevant SFP
Equal h&L: (short-mid-long term) display longer term
Any Alert(): Trigger alerts based on the selected inputs
Paid script

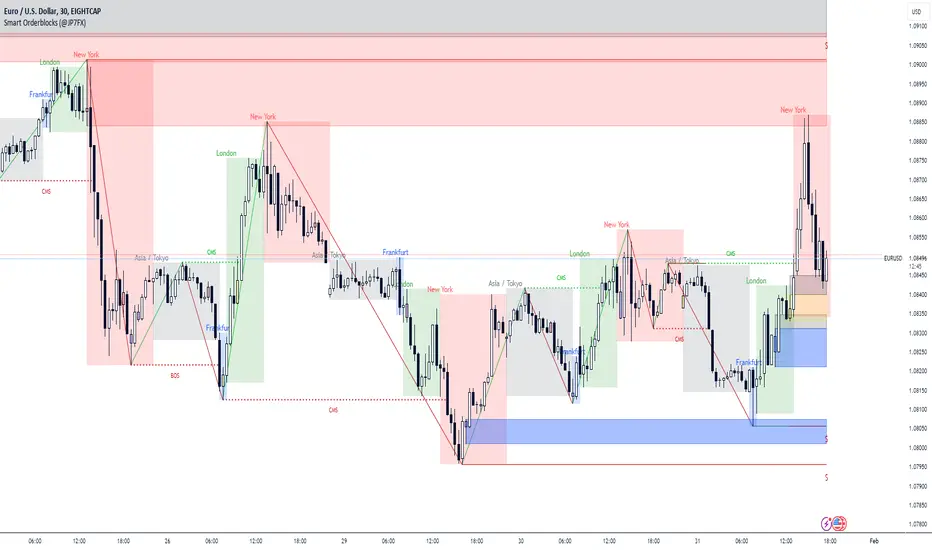
Smart Orderblocks / Supply and Demand (@JP7FX)
"Smart" Order Block Supply and Demand Indicator – a tool inspired by Smart Money Concepts and designed to complement your trading style.
It's not about perfection, but rather about enhancing your trading insights and catching things you might have missed.
Keep in mind that the structural representation here is subjective, just like many other indicators. It's more of a guide to help you navigate the market.
While it doesn't explicitly include Imbalance / FVG, you have the flexibility to use additional Imbalance /FVG indicators, including my own, to complement the insights drawn from Supply and Demand zones.
This indicator offers customisation options like trading ranges, allowing you to mark Killzones and tailor it to your preferences. Explore liquidity levels, 50% retracement lines, and personalize the colors and lines to match your unique chart setup.
Guide below on how the "Hidden" Zones are created!
Trade Safe :)
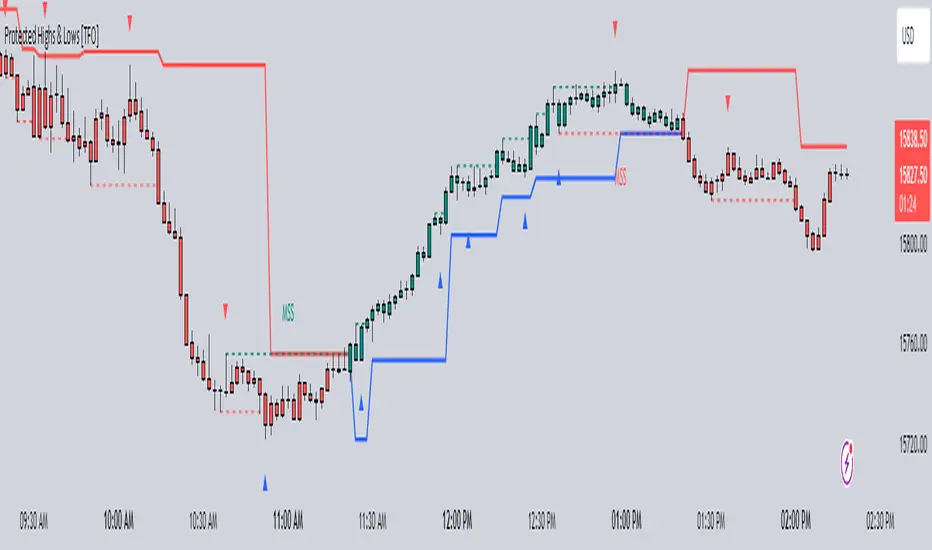
Protected Highs & Lows [TFO]This indicator presents an alternative approach to identify Market Structure. The logic used is derived from learning material created by @DaveTeaches
When quantifying Market Structure, it is common to use fractal highs and lows to identify "significant" swing pivots. When price closes through these pivots, we may identify a Market Structure Shift (MSS) for reversals or a Break of Structure (BOS) for continuations. The main difference with this "protected" logic is in how we determine the pivots/levels that are utilized to determine a valid MSS or BOS.
Nonetheless, the significance of our swing pivots is still governed by the input Pivot Strength parameter, which requires valid swing pivots to be compared to this many bars to the left and right of them. This is an optional parameter as it is traditionally set to 1 by default.
When identifying a BOS: When price closes below a valid swing low, we look back from the current bar to find the highest high that was made in that range. This becomes our protected high; similarly, when price closes above a valid swing high, we look back from the current bar to find the lowest low that was made in that range, which then becomes our protected low.
Note these valid highs and lows are the first swing pivots created after a MSS/BOS. For example, when price makes a bullish BOS/MSS and then trades away, a swing high is formed. This first swing high is what needs to be traded through to see a valid BOS.
When identifying a MSS: If the current trend is bearish and we're looking for a bullish reversal, we would need price to close above the most recent protected high. When this happens, we still look back to find the lowest low that was created in that range, and make that our new protected low. Likewise when looking for a bearish reversal, price would need to close below the most recent protected low, which would then give us a new protected high as a result (the highest point in that range).
The Trend Candles option allows users to easily visualize the current state of Market Structure with bullish and bearish colors. Users may also show BOS and MSS labels if desired.
Show Protected Highs & Lows will annotate the protected highs and lows, just note that the labels themselves are plotted in the past due to the lookback function required to identify them.
Lastly, the Show Protected Trail option will draw a line to essentially indicate a trailing stop-like line to denote the most recent protected low (if bullish) or protected high (if bearish).
I am simply a student of Dave's concepts, so please feel free to leave feedback if you are familiar with his concepts and have suggestions/improvements.
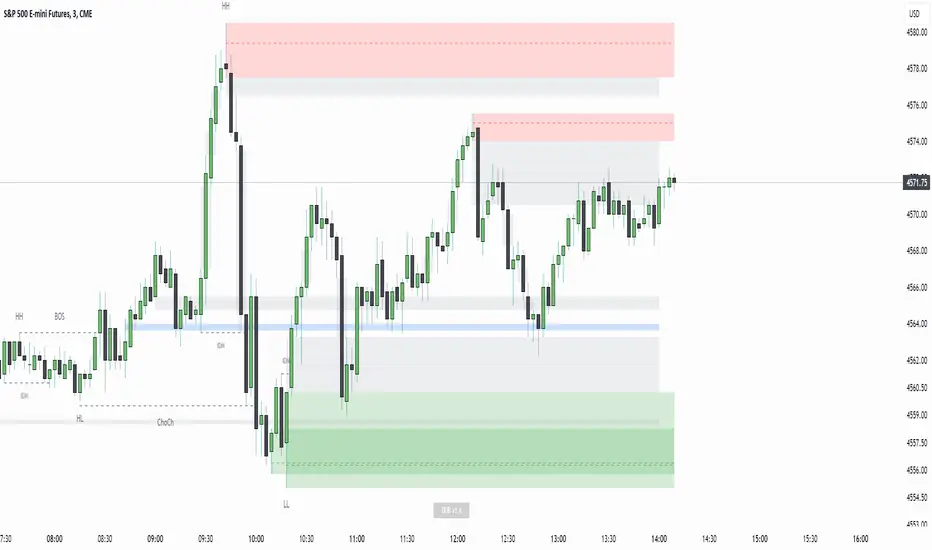
Displacement Order Blocks ~ DOB [Liquidity_Pro]Displacement Order Blocks (DOB)
This indicator shows order blocks with displacement (FVG required) and leans heavily on ICT’s generous and insightful teachings to define midlines for FVG, IFVG, and order blocks. The market structure definitions follow TradingHub’s (TH) rules filtering out inside bars.
It offers alerts for price in order block, liquidity sweep, break of structure (BOS), change of character (CHoCH), and inducement (IDM).
The TH model was chosen because it's programmatic allowing clear structure definitions that allow us to mark inducements (S/O to @albatherium for publishing the first TH market structure indicator).
TH’s Single Candle Order Block (SCOB) rules have also been helpful in refining order block definition, for example in the Transfer case. ICT fans will see when back testing this, that it moves the focus closer to the FVG.
In developing this indicator, we've tried to offer great aesthetic flexibility, to keep the chart uncluttered and to avoid exceeding Trading View’s limitations on boxes and lines. It's also configured to work reasonably well on both light and dark background charts:
We hope this indicator can serve as a teaching tool for ICT’s price action insights and SMC market structure concepts. For this, we've included optional labels for various order block types:
I = inside bar. The bars that follow the order block have been ignored – you will see the number of ignored bars shown after a hyphen. The idea is that inside bars fall in the shadow of a more important candle and can’t be relied on for defining a trade.
S = standard case. The order block candle takes liquidity from the previous candle and is followed immediately after by an FVG on the next candle. This differs technically from the ICT “last down-close/last up-close” order block concept. In practice, this choice has very little impact on ICT trading, because the ICT trader is entering on the FVG anyway.
T = transfer case. This is an order block that has been transferred from the candle that takes liquidity to the candle just prior to the FVG. When you back test this, you will see it is a high probability choice.
TZ = tweezer. This is an option you can turn off that fills a hole in TH teachings. It bypasses the requirement for an order block to take liquidity from the previous candle in the case of equal h/ls. The result is that you will find 2 candle order blocks with equal highs and lows (also known as tweezer tops/bottoms) show on your chart. You will note that every tweezer is a wick on a higher timeframe.
W = wick. this is a big wick candle that we call an order block without requiring an FVG. The presumption is that the displacement is contained within the wick itself on a lower timeframe.
* Asterisk denotes an extreme order block.
Finally, we trade with this indicator (using it together with our Daye Quarterly Theory ~ DQT free indicator, taking trades when price reaches an extreme FVG or order block during a Q2 manipulation).
We will continue developing it along with other indicators we have not yet published. So please boost if you like this and follow us for updates. Also please let us know what new features you would like to see.
Market Structure [TFO]The purpose of this indicator is to provide a simple approach to Market Structure. When price is closing over swing highs, we may categorize that as bullish structure; and when price is closing below swing lows, we may categorize that as bearish structure.
We can easily find swing highs and lows via the following built-in Pine Script functions:
ta.pivothigh()
ta.pivotlow()
We can pass in our Pivot Strength parameter to determine the size/significance of these pivots. The lowest value of 1 will validate a swing high when a given high is larger than that of 1 bar to the left and right of it. A pivot strength of 3, for example, would validate a swing high only when a high is larger than that of the 3 bars to the left and right of it, making it much more selective.
In any case, we can simply track the most recent swing highs and lows and check for when price through them. Enabling the Show Pivots option will mark all the swing highs and lows that are being considered for future structure breaks.
If the trend is bearish and we begin closing over swing highs, that would mark a Market Structure Shift (MSS). If the trend is already bullish and we are closing over swing highs, that would mark a Break of Structure (BOS), and vice versa for bearish conditions. MSS essentially signifies reversals in Market Structure while BOS signifies continuations.
Users may also create alerts for Any/Bull/Bear BOS or MSS. Simply create a new alert, select this indicator, and select the desired BOS or MSS criteria.