Supertrend

Supertrend Explorer First_40This indicator was brought by Kıvanç Özbilgiç. I only modified it to search for 40 stocks on BIST. The other stocks are listed as Second_40, Third_40 and Fourth_40.

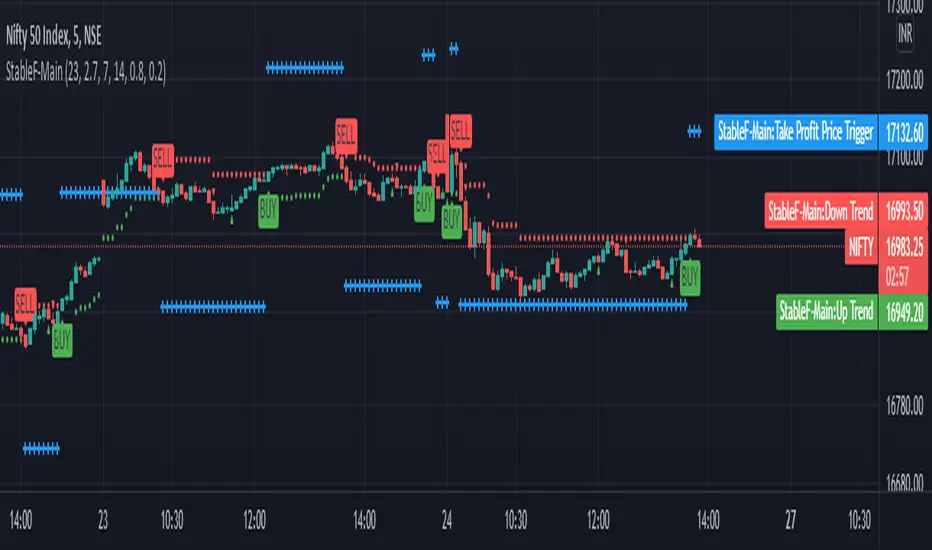
StableF-MainIt is combination of Built in Super trend and Adx with take profit
uptrend is considered when +dmi is above -dmi and +dmi is above 25 and adx is above 25 and supertrend gives Buy
downtrend is considered when -dmi is above +dmi and -dmi is above 25 and adx is above 25 and supertrend give sell
use fibo for target by taking as previous swing high and swing low
-supertrend crossover is referred as buy plotshape
-supertrend cross under is referred as Sell plotshape
-keep stoploss at dot line of supertrend
-adx-dmi crossover (+dmi crossed above -dmi) is shown by Triangle Up symbol
-adx-dmi crossunder( -dmi crosses below +dmi) is shown by Triangle down symbol
--Cross symbol with blue line with linewidth 2 is referred as Take profit
--combine this with adx -dmi setting with 7 and 14
----disclaimer-----
used free built in supertrend and adx so u can use same setting in other broker or in trading view
not responsible for any loss or gain
-only for educational purpose
Trailing Stoploss Bottom ActivationThe Basics
The indicator is visible on the chart as circles above and below the bar.
It will trigger an alert when the current price goes below, the low of the previous candle.
Or an alert when current price goes above, the high of the previous candle.
The indicator can be used as a trailing stoploss for (DCA/ TV) bots.
The distance between the circles and candlesticks can be adjusted. If the user prefers to set an alert e.g. a few ticks lower than the candle bottom.
What Makes It Different
The user can preset the price (of the asset e.g. BTC), where it will start looking for the condition: current price is below previous candle low (when in long position). Current price is above previous candle high (when short).
Example
In the chart above MATIC/BUSD the user has drawn a blue line at 1.70. Since there is where he expects resistance.
The user has a long position (bought at the green arrow.) The user wants to start trailing at price 1.70.
The alert will only trigger when the following conditions are met:
Condition 1 - Crossed 1.70
Condition 2 - Current candle price is below previous candle low.
In the chart above price crossed above 1.70 on 26th Oct. Current candle price (at that moment) went below previous candle low on 27th Oct, indicated with a red arrow. Here the alert will go off at 1.659 BUSD (indicated in pink).
It ignores the other two lows, indicated with orange arrows. Because condition 1 is not met.
It is possible to use multiple time frames at the same time. Some time frames might not be available depending on your Tradingview subscription.
Final Words
Disclaimer: Please use it with care and at own risk. The owner of this indicator is not liable for any financial losses.
Past performance is no guarantee of future returns.

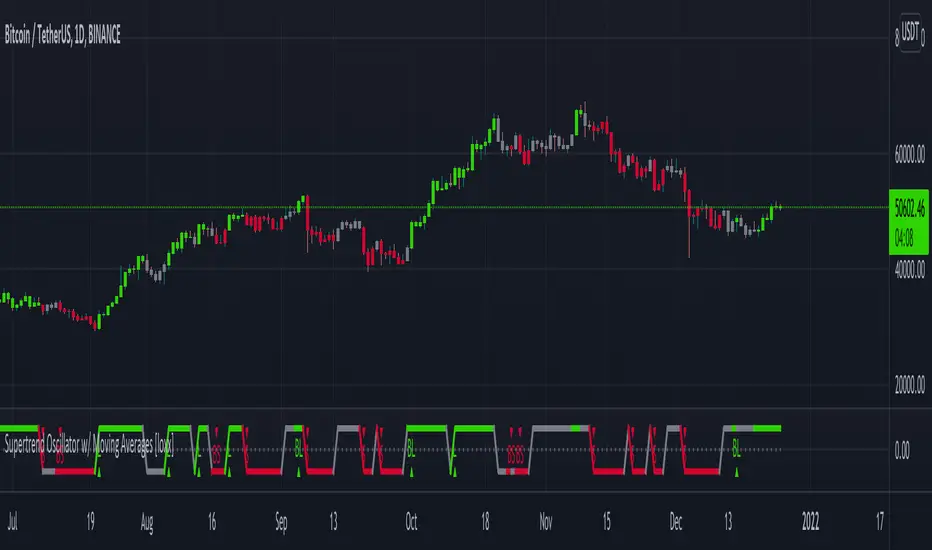
Supertrend Oscillator w/ Moving Averages [loxx]Supertrend Oscillator w/ Moving Averages
Supertrend Oscillator with configurable inputs for either standard or moving average inputs
Features
-Includes the folowing moving averages
ALMA
DEMA
DONCHIAN
EDSMA
EMA
FRAMA
HMA
INSTANT
JMA
KAMA
Kijun v2
LSMA
MAMA
McGinley
MF
RMA
SMA
SSMA
T3
TEMA
TRIMA
VWMA
WM
ZLEMA
-Baseline filtering internal to indicator
-Has logic to account for post signal baseline crossover rules
-Has both short and long signals
-Colors background
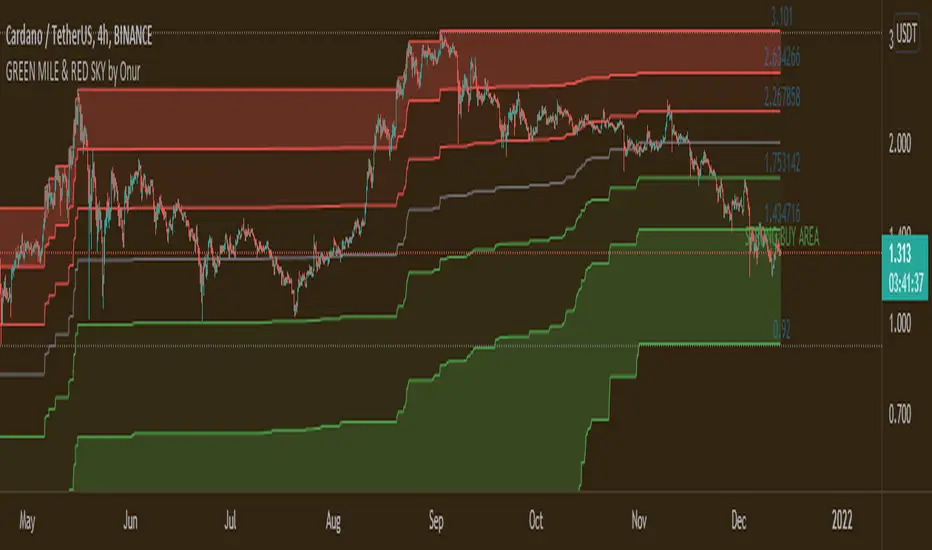
GREEN MILE & RED SKY by OnurThis indicator is the upgrated version of "GREEN MILE by Onur". Indicator shows fibonacci buying + selling levels due to the past 3500 (adjustable and 1500 by default) candles. Prices in the dark green area is a strong buying signal. Prices in the dark red areas is strong selling signal
Decreasing period value makes indicator effective from long term to short term.
Works harmoniously with MACD & RSI indicators.
Supertrend w/ HMA Averages [loxx]The Supertrend w/ HMA Averages Indicator is a trend following indicator which is based on the concept of using the ATR as a basis for identifying trend direction. It is a modification of the classic Supertrend Indicator, which instead of plotting a line based on price action, it plots a line based on a short-term moving average line. This indicator is preset to use the HMA with length 12, also using ohlc4 as the price point used for the calculation. It is also preset to use an ATR of 12 periods and an ATR multiplier of 0.66.
-HMA Only, for now
-Bar color change
-All options of regular Supertrend

Supertrend - Ladder ATRThis is a supertrend with slight twisted concept which can be very benefecial in strong trending markets to reduce stop loss distance and exit slightly quicker.
⬜ Concept
▶ When the instrument is trending up, regular ATR shows high values if there are big green candles. This affect the stoploss distance in regular supertrend which leads to wide stops or delayed lagging. When you are in long trade, what matters for stoploss is how much a negative candle can move within bar. Hence, using ATR derived only based on red candles is more beneficial for trailing stops on long signals. Same applies to short trades where using ATR derived from only green candles is more efficient than overall ATR.
▶ ATR will be minimal when the volatility is less and ATR will increase with volatility. That means, once you are in trade, the trailing of stoploss also will vary based on ATR (or volatility). With regular ATR and supertrend, chances of stop loss distance widening is high with increased volatility even though stoploss levels will not move down. This again poses the risk of higher drawdown during trade closure and also keeps in the trade during ranging market. To avoid this, the second trick we are using here is only to reduce the atr stoploss difference when in trade. That is, when in long trade and negative candles ATR is increasing, we will not consider that. We will consider the new ATR only if it is lesser than previous bar ATR.
Effect of these changes on the trending market is quite visual. Lets take example of USDTRY
Settings are quite simple and does not vary much from regular supertrend settings.

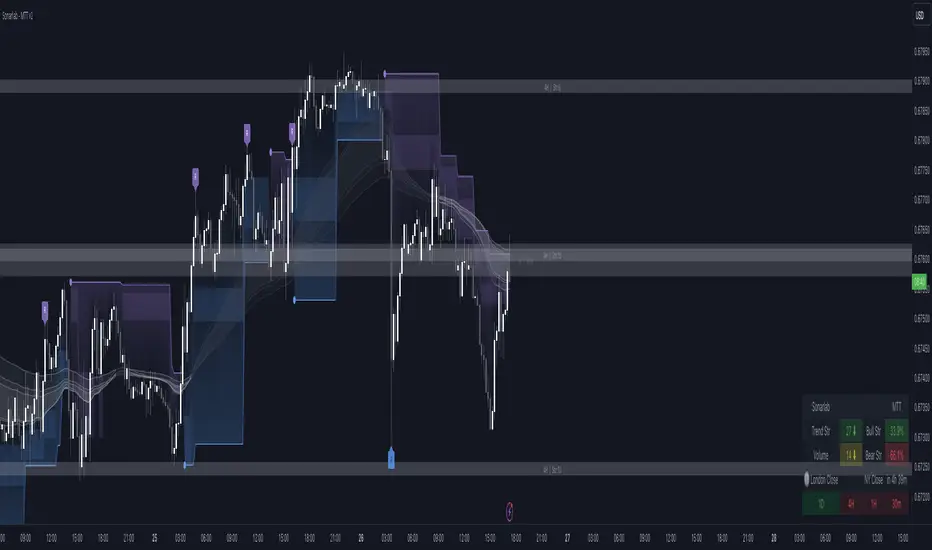
Multi Trend Tool - SonarlabVersion 1 (releasing new updates every 2 weeks
The Sonarlab Liquid Script included a lot of indicators at once, so you have all the tools you need in hand reach.
Features:
01_ Revision Band (Reversal Cloud)
The reversal cloud can be used for many options. These zones can be great areas to take profit or find early entries to use alongside the confirmation or contrarian signals.
02_Supply & Demand Levels / Imbalances (still need some improvement)
The driving force behind changes in price is supply and demand. When there are more buyers than sellers, the market price will move up. Conversely, when there are more sellers than buyers, the market price will move down. When buyers and sellers are more or less even, the market will range. Know where the world’s biggest buyers & sellers are entering and exiting their trades, so you can too.
03_Support and Resistance (Multi Timeframe)
04_Trading Dashboard
Get a quick overview of the current market situation.
- Multi Timeframe Trend Structures
- Volatility %
- Trend Strength %
- Directional Bias: Strong/ Weak/ Neutral
- Trading Sessions
05_Imbalances
See Imbalances within a wink of an eye. Draw them out and make better decisions using those zones (those zones needs to be filled.)
06_Filter options
Filter the signals with Moving averages or with a second trend structure
07_Trend Lines
08_Pivot Highs and Lows
09_Alerts
Even the option to automate the signals true 3Commas (Please wait for our Strategy version of this indicator before using this function).
10_Reduce Risk/ Exit Points
Grey circles on the chart
A lot of things can be changed and customize as you want. You can change/set:
- Colors of Body and Top/Bottom Wicks separately
- Moving Average Values
- Supply and demand values
- Trend Line values
- Colors of the shapes
Sonarlab can be adjusted To All Trading Styles to simply create your own, unique trading strategies around this Powerful Indicator.
Support
For questions, you can reach out on discord or send us a private message on Tradingview or discord group.
We kindly suggest you to test this indicator out on a demo account first.
Close to SupertrendMany a times, we have seen that the price closing in towards supertrend reverses.
This indicator gives signal that identifies high / low of any candle if near the down / up supertrend line by a defined margin using arrow signals.
I've simply re-used readily available supertrend indicator source code and just modified it to these signals. So, almost all of the source code is not mine.
Enter the short / long position when arrow signal appears.
SL / trend reversal will be mandatorily at close of a candle above or below the supertrend line, and the supertrend changes direction.
Hope this indicator comes handy for you.

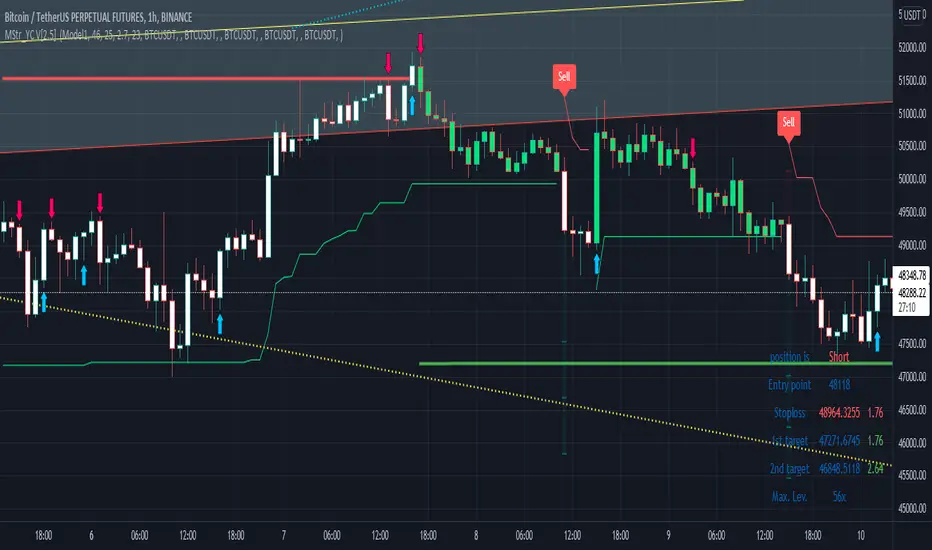
Buy and Sell with Master_in_chart-ind. [V1]This script indicates the Buy and Sell positions on your chart. In addition, it shows entry price , stop loss and possible targets on the chart. The same information are shown in a table where you can find the position type (long/short) in green and red color, entry point, stop-loss (always in red) and targets.
The targets are defined by Risk to Reward ratios 1:1, 1:1.5 and 1:2.
the labels appears when the all conditions are satisfied.
Interesting part of the script is the alert function. Here one can set the script for different
securities and activate alert in TV.
In summary, one can change and tune the setting of the indicator easily by clicking on the gear icon. In the setting, there are four sections. First section sets the slop-loss. Second section activates and shows the super trend indicator. Third section is designed to tune the signals. Finally, you can apply the script on five different symbols at different time-frames. Here you can set alarm to alert you the signals.
I hope you enjoy it!
Multiple Indicators ScreenerA screener for multiple indicators with nice table output.
I was asked many times to update custom screener to display results in a table form. This way it looks much better.
You can play with background colors depend on values you're looking for.
In the screener, for example, I'm highlighting overbought/oversold RSI values, big ADX levels and trend of the Supertrend.
In parameters you can change settings for all indicators and change/disable tickers if 40 is too many for you.
There is only 1 function that calculates all these indicators. Potentially you can change and even add more indicators to this function.
Writing code for these kind of screener is a bit time consuming, so I even created a code generator in Python for these kind of indicators :) .
Disclaimer
Please remember that past performance may not be indicative of future results.
Due to various factors, including changing market conditions, the strategy may no longer perform as well as in historical backtesting.
This post and the script don’t provide any financial advice.

SuperTrend+ CleanedSimilar to SuperTrend+ which allows for confirmation bars.
Differences:
Limited to SMA calculation of average true range.
Can filter outlier volatility.
Can apply a standard deviation to the ATR value.

True BarcolorHeikin Ashi can be useful for understanding trend based on price action but it doesn't take volume in context. Here I have tried to use volume for understanding true bar color and ultimately true trend analysis. It can also help you in not getting trapped in sudden shakeouts. Also, you can use it for averaging of your existing position.
Conditions used:
Relative closing price
Relative volume against previous bar and overall moving average of volume
Volume analysis
Trend analysis

ZigZag Chart with SupertrendHello All,
This script creates Zigzag Chart by using Zigzag waves, so it's timeless chart meaning that no time dependency on X-axis. Optionally it can calculate & show Zigzag Supertrend or Simple Moving Average. Also it can change bar colors of the main chart by trend direction of Zigzag Supertrend.
As seen below, each zigzag wave is a candle on Zigzag chart:
You have a few options and using these options you can find best settings for the securities/timeframes.
You can change Zigzag period, if you change Zigzag Period then all zigzag and the chart is recalculated/reconstructed.
You have option to show Zigzag Supertrend or Zigzag Moving Average, the options you have;
- You can change ATR Length and ATR multiplier for supertrend
- You can change Length for Simple Moving Average
You can change Zigzag candle & wick colors using options. Also you have option to change bar colors according to Zigzag Supertrend direction.
As it's timeless chart, below you can see how/when bar colors and Zigzag Supertrend change:
You can see Simple Moving Average of the Zigzag Candles:
You can play with ATR length and multiplier to find best supertrend:
You can play with the candle & wick colors:
Enjoy!

7 Moving Averages [Plus]Moving Averages are price based, lagging (or reactive) indicators that display the average price of a security over a set period of time. A Moving Average is a good way to gauge momentum as well as to confirm trends, and define areas of support and resistance. Essentially, Moving Averages smooth out the “noise” when trying to interpret charts. Noise is made up of fluctuations of both price and volume. Because a Moving Average is a lagging indicator and reacts to events that have already happened, it is not used as a predictive indicator but as an interpretive one for confirmations and analysis.
Bollinger Bands (BB) are a widely popular technical analysis instrument created by John Bollinger. The BB consist of a band of three lines which are plotted in relation to security prices. The line in the middle is usually a Simple Moving Average (SMA) set to a period of 20 days (the type of trend line and period can be changed by the trader; however a 20 day moving average is by far the most popular). The SMA then serves as a base for the Upper and Lower Bands which are used as a way to measure volatility by observing the relationship between the Bands and price. Typically the Upper and Lower Bands are set to two standard deviations away from the SMA (The Middle Line); however the number of standard deviations can also be adjusted by the trader.
This script shows 6 moving averages and Bollinger Bands.
Features:
- Standard MA inputs.
- MA type.
- MA period.
- MA source.
- MA resolution (time frame).
- MA Offset.
- Forecasting : forcasted prices are calculated using our MAType and MASource for the MAPeriod.
- Trail: Show only candles not included in the MA calculation.
The color of MA1 depends on the chosen strategy, by default this is the 3EMA strategy. You can also select "Pivot Point Supertrend" or "Ichimoku Trend"
Added "Parabolic Stop and Reverse (PSAR)" . The PSAR is a time and price technical analysis tool primarily used to identify points of potential stops and reverses. In fact, the SAR in Parabolic SAR stands for "Stop and Reverse". The indicator's calculations create a parabola which is located below price during a Bullish Trend and above Price during a Bearish Trend.
Added "Linear Regression Channel" which can be correctly plotted on logarithmic charts. A linear regression channel consists of a median line with 2 parallel lines, above and below it, at the same distance. Those lines can be seen as support and resistance. The median line is calculated based on linear regression of the closing prices but the source can also be set to open, high or low. The height of the channel is based on the deviation of price to the median line. Extrapolating the channel forward can help to provide a bias and to find trading opportunities.

Keltner Center Of Gravity Channel ( KeltCOG )I have the ambition to create a ‘landscape’ which enables the user to see the ‘mood’ of the market about the price of an instrument, simply by looking where the candles go. Prices are a simple phenomenon , they go up or down or stay the same. This is represented quite well for the short term by a candle. I recommend to study candle patterns. Prices not only fluctuate but also trend up, down or go sideways. The user should analyze this by determining the COG (Center Of Gravity) and the ‘normal’ current range by using the historical data in a lookback period.
As a COG the center line of a Donchian Channel is often used. I.m.o. a COG should be a zone, in this channel I use the gray zone of my Donchian Fibonacci Channel, The ‘normal’ range is a multiple of Average True Range, as used in a Keltner Channel. Combining the two can give a cumbersome result, as one can see in my Keltner Fibonacci Channel. In this KeltCOG channel I solved this by not using all Fibonacci levels and by making the Keltner lines strictly parallel to the nearest COG line. To do this, I use the fact that the COG lines have horizontal stretches, there I make the Keltner lines horizontal too. Only where the COG lines change value, the Keltner lines are recalculated. This way the channel gets a very regular shape with three clear zones.
Interpretation of a chart by using the KeltCOG channel.
Overbought: If the candles go higher then the blue zone, the market is hyper enthusiast, creating an overbought situation. This is often followed by a reversion to the COG.
Uptrend: If the candles form in the blue zone, the market is enthusiast and willing to pay more.
Hopeful: If the candles form in or near the upper uncolored zone, the market is hopeful and is thinking about paying more. Sometimes prices go a little up.
Content: If the candles form in the gray zone, which represents COG, the market is happy with the current prices, so these move sideways
Disappointed: If the candles form in or near the lower uncolored zone, the market is disappointed and contemplates paying less, sometimes prices go a little down.
Downtrend: If the candles form in red zone, the market doesn’t like the instrument at all, rejects the current price and is only prepared to pay less.
Oversold: If the candles form below the red zone, the market overdoes its disgust, creating an oversold situation, often followed by a reversion to the COG.

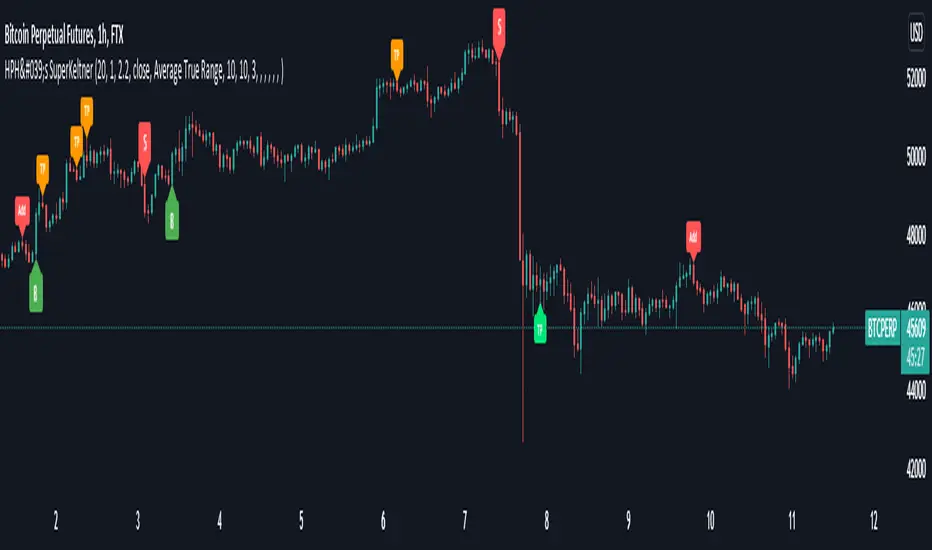
HPH's SuperKeltnerThis indicator combines the Supertrend (to determine the main trend direction) with two Keltner channels (used for add and take profit signals) to construct a trend trading system.
These are the available settings:
General
UseTrendChange ➞ toggle trend change alerts and labels
UseAdds ➞ toggle add to position alerts and labels
UseTakeProfits ➞ toggle take profit alerts and labels
PrematureAdds ➞ toggle adding to position as soon as the add channels are left (default is false, so the add signal will only fire once the channels are re-entered)
PrematureTakeProfits ➞ toggle taking profit as soon as the tp channels are left (default is false, so the tp signal will only fire once the channels are re-entered)
Visualization
Show Add Keltner ➞ toggle display of the channels used for adding to the position
Show TP Keltner ➞ toggle display of the channels used for taking profit
Show SuperTrend ➞ toggle display of the Supertrend
Keltner
Standard Keltner channels settings except for the fact that there are two different multipliers. The Keltner TP Multiplier should generally be bigger than the Keltner Add Multiplier , as the channels are hit differently in trending markets. I recommend you to use the visualization settings to show the channels and adjust the settings to your liking.
Supertrend
Standard Supertrend settings, nothing to add here.
Alerts
Use the alert messages to customize what alert text the indicator will send. This makes it possible to use the script to automate trading bots.
By default, the alerts are sent after the candle has closed. This ensures that no repainting is happening. If you like the risk, you can toggle the corresponding WaitFor Confirmation if you wish to receive the signals earlier (max. once per bar).
Enjoy!
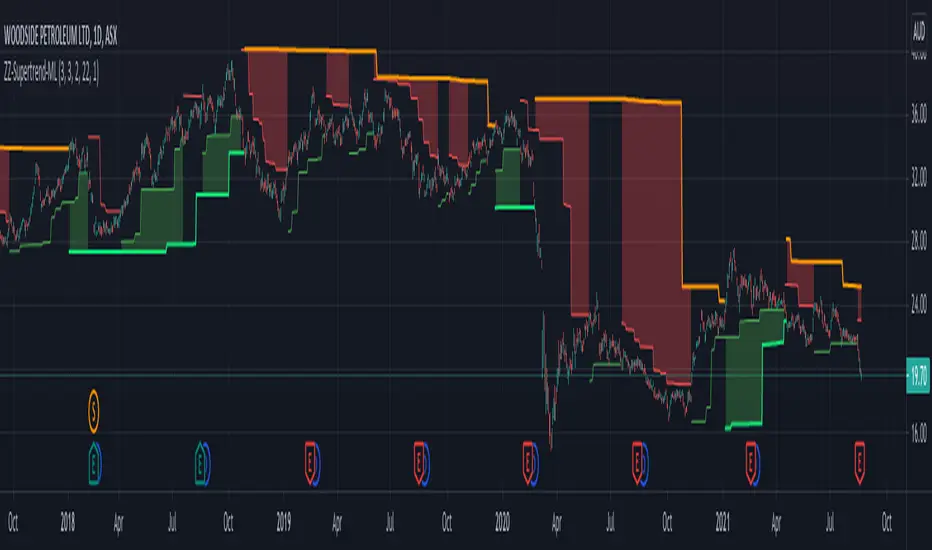
Multilevel ZigZag SupertrendVery much similar to :
I have slightly changed code to accommodate multiple zigzags. Also removed possibility of external source to keep it simple.
Indicator shows 2 Level zigzag based supertrends. Second zigzag used is multi level zigzag and hence, this acts as higher timeframe filter and can be considered as overall trend bias.
SuperTrend+ DuoUses two SuperTrend+ indicators to signal when a change in trend is confirmed.
By using a minor trend within the major, a pullback after a turning point can signal a more optimal entry.
See SuperTrend+ for more details.

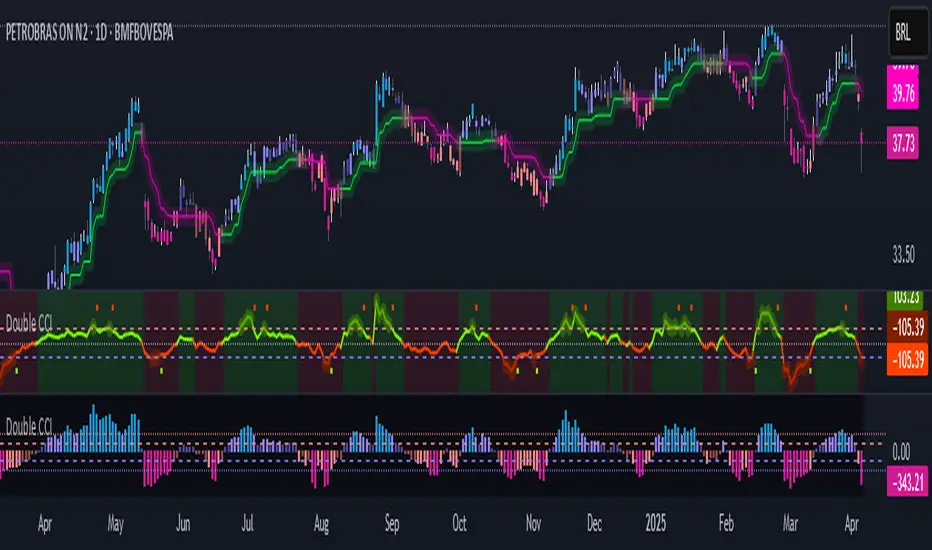
Double CCIThe Commodity Channel Index (CCI) is a momentum oscillator used in technical analysis primarily to identify overbought and oversold levels by measuring an instrument's variations away from its statistical mean. Besides overbought/oversold levels, CCI is often used to find reversals as well as divergences. Originally, the indicator was designed to be used for identifying trends in commodities, however it is now used in a wide range of financial instruments.
There are several steps involved in calculating the CCI. The following example is for a typical 14 Period CCI:
CCI = (Typical Price - 14 Period SMA of TP) / (.015 x Mean Deviation)
Typical Price (TP) = (High + Low + Close)/3
Constant = .015
The Constant is set at .015 for scaling purposes. By including the constant, the majority of CCI values will fall within the 100 to -100 range.
Mean Deviation:
1) Subtract the most recent 14 Period Simple Moving from each typical price (TP) for the Period.
2) Sum these numbers strictly using absolute values.
3) Divide the value generated in step 2 by the total number of Periods (14 in this case).
Overbought and Oversold conditions can be used in their more traditional sense to identify future reversals . Remember true overbought/oversold thresholds values can and often do vary between instruments.
During a Bullish Trend , price crossing above the overbought threshold may indicate strong confidence in the move and price will continue to rise.
During a Bearish Trend , price crossing below the oversold threshold may indicate strong confidence in the move and price will continue to fall.
The first option is a modified CCI indicator that uses the "Arnaud Legoux Moving Average" instead of the SMA, and the source uses the VWAP instead of the HLC3. Added to this version an option to calculate CCI with different types of moving averages:
Green dots mean they are overbought
Orange dots mean they are oversold
Added a "SuperTrend Background" based on the modified CCI indicator:
Bull event = CCI crossing over the 0 line
Bear event = CCI crossing below the 0 line
Added a signal as EMA (modified CCI, signal length)
The second option is a standard CCI indicator that shows a coloured histogram of important levels, giving a good visual of the CCI levels. Added to this version is an extra coloured level +/-200 and an option to use Traditional CCI calculations according to user @JustUncleL
LEVELS:
Aqua: Greater than 200.
Lavender: Greater than 100 and less than 200.
Dark Lavender: Greater than 0 and less than 100.
Dark Coral: Less than 0 and greater than -100.
Coral: Less than -100 and greater than -200.
Light Red: Less than -200.
[blackcat] L1 Tether LineLevel: 1
Background
Omega Research proposed Tether line in June 2000. I utilized it in fast-slow line form to follow trend.
Function
Due it can provides good support and resistance, using it as "moving average" fast-slow line form can provide very stable golden cross and dead cross signal.
You can adjust parameters to fit for your trading pair and use it and compare it with Supertrend indicator.
Key Signal
Tether_fast --> Tether Fast Line.
Tether_slow --> Tether Slow Line.
Remarks
This is a Level 1 free and open source indicator.
Feedbacks are appreciated.

Super_Macd_Alerts_EMA_publicQuickly find market caps, risk management and predict the timing of contrarian tensions.
By automatically receiving trend changes, we support trend follow, push and return strategies simply and quickly.
Make the most of this all-in-one system and take your trading style one step further.
・ Main functions
MACD slope change signal (UP / DN)
MACD hidden divergence signal (HL / HS)
Histogram divergence signal (vertical background: blue / pink)
You need to use signals without going against the trend.
·idea
Recommended for use with Elliott Wave, SUPER TREND
・ Chart example
WTI Crude Oil Futures | HS Signal Before Crash
GOLD CFD 1D
2021/7/1
UP signal before returning to the UP trend
2021/8/5
HS signal before the crash
BTCUSD 4H
2021/08/10
Signals to use: UP / HL on uptrend, Histogram divergence (pink)
