MTF OB Supply Demand ZonesHello everyone,
This exceptional indicator provides you with visual representations of bullish and bearish order blocks or supply and demand zones across multiple timeframes. In simple terms, bullish order blocks are represented by a small red candle followed by a large red candle, while bearish order blocks are depicted as a small green candle followed by a large red candle. Supply and demand zones are drawn by using order blocks.
Features:
Display order blocks from up to three different timeframes.
Customize the maximum number of boxes shown and the colors of the zones.
Choose from three different modes: OB (Order Block), Extended OB, and Supply/Demand.
Mode Descriptions:
OB: Includes the body of the candle.
Extended OB: Encompasses the body and wick of the candle.
Supply/Demand: Covers the body, wick, and half the body of the large candle.
Usage:
Ensure that charts 2 and 3 are set to a higher timeframe. For modes 2 and 3, it’s recommended to reduce the maximum number of boxes shown. The zones or boxes are transparent, allowing for overlap. This feature aids in identifying reversal zones or confirmed zones. The more intense the color, the stronger the confirmation. If a green zone overlaps a red zone (or vice versa), it signifies a reversal zone.
Thank you for checking out this indicator!
---
Additional Information:
Order blocks refer to specific price areas where large market participants, such as institutional traders, have previously placed significant buy or sell orders. These clusters of orders can impact price movement, liquidity, and market sentiment.
Order blocks are a strategic approach to identifying key levels of support and resistance based on the behavior of institutional traders. These key levels are then utilized as entry or exit points for trades.
An order block is an area where there has been a large concentration of limit orders awaiting execution. These blocks are identified on a chart by observing previous price action and pinpointing areas where the price experienced significant movement or abrupt changes in direction.
Order blocks are used in the following popular trading philosophies:
Smart Money Concepts (SMC)
Inner Circle Trading (ICT)
Price Action
---
Credits to: @AGFXTRADING
Supplyandemandzones

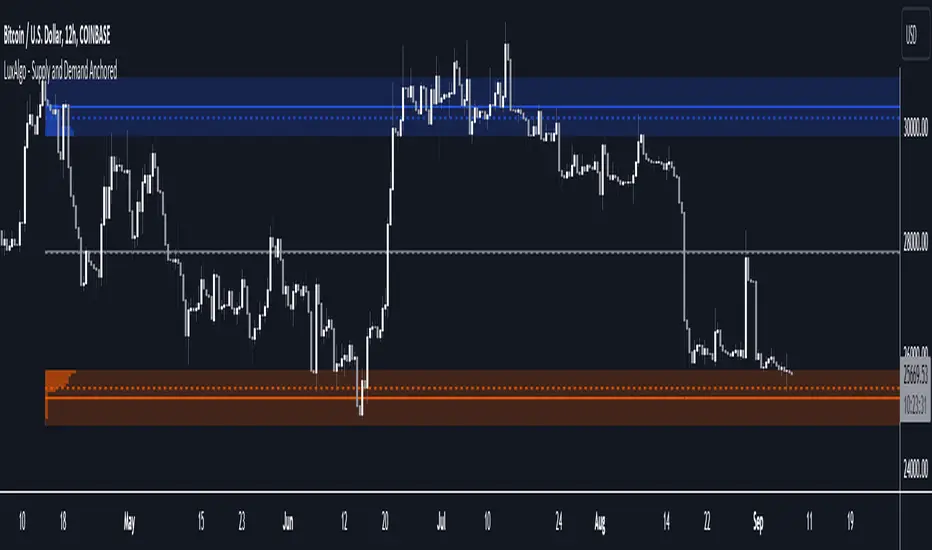
Supply and Demand Anchored [LuxAlgo]The Supply and Demand Anchored indicator is an anchored version of the popular Supply and Demand Visible Range indicator. Once adding the indicator to the chart, users need to manually select the starting and ending points for the indicator's calculation. The estimated supply/demand zones are then extended.
🔶 USAGE
The proposed indicator makes use of the same method highlighted in previous posts (see related scripts section below) to estimate supply and demand zones.
When adding the indicator to the chart, users will be prompted to select a starting and ending point for the calculation of the supply and demand zones, click on your chart to select those points.
Once calculated, each zone/level will be extended to the right of the chart. These can be used as support/resistance zones. Clicking on one of the graphical elements of the indicator or the indicator title will highlight the starting and ending calculation points, these can be dragged to be set at different locations.
🔶 SETTINGS
Threshold %: Percentage of the total visible range volume used as a threshold to set supply/demand areas. Higher values return wider areas.
Resolution: Determines the number of bins used to find each area. Higher values will return more precise results.
Intra-bar TF: Timeframe used to obtain intra-bar data.
🔶 RELATED SCRIPTS
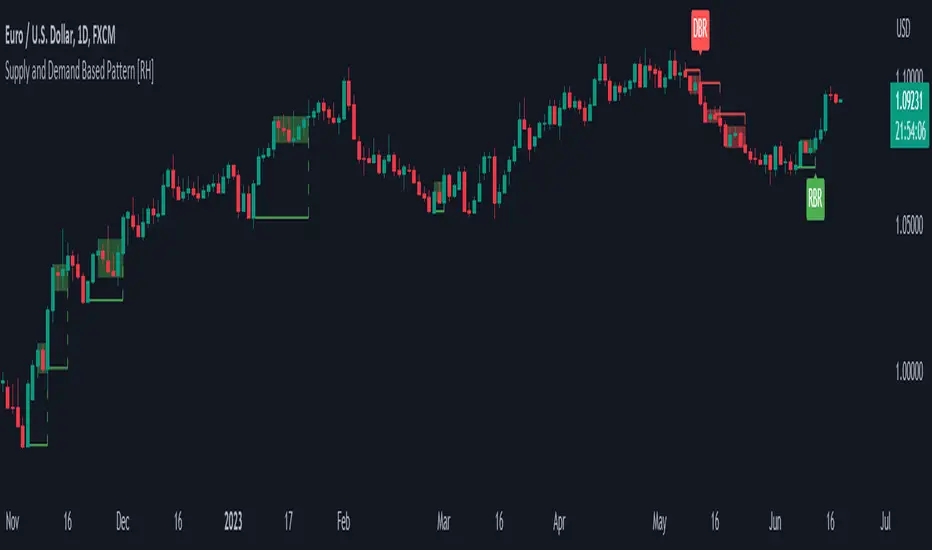
Supply and Demand Based Pattern [RH]This indicator focuses on detecting RBR and DBD patterns, which signify periods of increased momentum and potential continuation or reversal of the prevailing trend.
The RBR pattern consists of a rally (upward movement), followed by a base (consolidation or retracement), and then another rally. It suggests that the upward momentum may persist and provide trading opportunities.
On the other hand, the DBD pattern comprises a drop (downward movement), followed by a base, and then another drop. It indicates that the downward momentum might continue, offering potential shorting opportunities.
Bullish(RBR) example:
Bearish(DBD) example:
1. The bullish (RBR) and bearish (DBD) patterns share the same underlying logic, only differing in their directionality.
2. For both RBR and DBD patterns, the first rise/drop can consist of one or multiple candles. However, in the case of multiple candles, all candles must exhibit a bullish nature for RBR and a bearish nature for DBD.
Example:
3. It is a prerequisite for the first rise/drop to include at least one candle with a defined percentage of health, as determined by the user.
4. The base, following the first rise/drop, may comprise one or multiple candles.
Example:
5. To maintain consistency, the base is not allowed to retrace beyond 80%, although this value can be adjusted by the user.
6. Similar to the first rise/drop, the second rise/drop in both RBR and DBD patterns can consist of one or multiple candles. However, all candles within this phase must demonstrate a bullish nature for RBR and a bearish nature for DBD.
7. Confirmation of the bullish (RBR) pattern occurs when a candle closes above the high of the first rise. Conversely, the bearish (DBD) pattern is confirmed when a candle closes below the low of the first drop.
Example:
Alerts can be set for all bullish and bearish pattern or for the first pattern in the range of similar pattern.
Volume-based Support & Resistance Zones-V1 By Trade Mastership™ The all-new Support & Resistance Zones indicator, which has been upgraded to offer traders more powerful features and functionality. This innovative indicator identifies high-volume fractal lows or highs to create zones based on the size of the wick for that timeframe's candle. This makes it easy for traders to visualize which price levels are the most significant for either a trend continuation or a reversal when zones are broken and retested.
The original script for this indicator was created by Trade Mastership, with additional modifications by L N Behera. Credit goes to both of them for the majority of the logic behind this script. Since then, the script has been improved with several changes, including:
Changing the default S/R lines from plots to lines, and giving users the option to change between solid, dashed, or dotted lines for both S/R lines
Adding additional timeframes and more options for TF1, beyond the current TF. Now, users have four timeframes to plot S/R zones from
Giving users the option to easily change the line thickness for all S/R lines
Making it easier to change the colors of S/R lines and zones by consolidating the options under settings (rather than under style)
Adding extensions to active SR Zones to extend all the way right
Adding the option to extend or not extend the previous S/R zones up to the next S/R zone
Adding optional timeframe labels to active S/R zones, with left and right options, as well as the option to adjust how far to the right the label is set
Fixing an issue where the higher timeframe S/R zone was not properly starting from the high/low of fractal. Now, any higher timeframe S/R will begin exactly at the High/Low points. Note that this may not work perfectly on stocks, and if a fractal high/low is too many bars in the past, it will revert to a default max bars back to avoid script errors.
Adding a function to prevent S/R zones from lower timeframes displaying while on a higher timeframe. This helps clean up the chart quite a bit.
Creating arrays for each timeframe's boxes and lines so that the number of S/R zones can be controlled for each timeframe and limit memory consumption.
Adding new alert options and customized alert messages
Here's how this indicator works: it looks for fractal highs or fractal lows with volume that pierces above the volume's Moving Average. This moving average value can be modified in the settings for each timeframe. The fractal highs will be confirmed with three successive higher highs followed by two successive lower highs and vice versa for the fractal lows. The zone is created from the fractal high/low and the close of the candle for whatever timeframe you selected. The bigger the zone, the more significant that zone is.
Traders can disable any zone, change the zones to show lines only, and modify all the colors, transparencies, and thickness of lines for all the zones. To create alerts, traders can enable the types of alerts they want for each timeframe in the indicator's settings. After applying changes, right-click on one of the zones on the chart, and click "Add Alert on Vol S/R Zones." You do not need to add a title, as the correct alert messages are already built-in.
The latest update has migrated the script to Pine Script Version 5 and added a higher number of total boxes/lines to show on the chart. It has also increased the max bars count to the maximum Pine Script allows, enabling traders to utilize as many bars as possible when drawing the left side of SR zones that are very far back on the chart. Additionally, the update fixed issues where the indicator would not load on 1 minute and 3-minute charts unless higher timeframe SR zones

Trend Reversal System with SR levelsHello All,
This is the Trend Reversal System with Support/Resistance levels script. long time ago I published it as closed source but now I upgraded it and and published as open-source with a different name. I hope it would be useful for you all while trading/analyzing.
The script has some parts in it: Setup, Count, SR levels, Risk levels & Targets . Now lets check them:
Setup Part: it has two part, Buy or Sell Setup. one of them can be active only. Buy setup: if current close checks if current is lower/equal than the close of the 5. bar. if yes then the script increases number of buy setup. and if it reaches 9 then the script checks if current low is lower/equal than the lows of last 3. and 4. bars, or if the low of the last bar is lower/equal than the lows of last 3. and 4. bars. if yes then the script increases the buy setup by 1. if these conditions met then it puts the label 'S' , same for Sell setup. S labels on both setup are potential reversals.
Count Part: If buy or sell setup reaches the 9 then Count part starts from 1. lets see buy count: If current close is lower/equal than the low of the 3. bar and buy count is lower than 12 or low of the bar 13 is less than or equal to the close of bar 8 then buy count increase or it's completed. if it's completed then the script puts C label, and it's potential reversal. of course there are some conditions that can cancel the count buy/sell or recycle/restart.
By using Setup and Count levels the script can show Support/Resistance Levels, Risk levels & Targets. SR levels are potential reversal levels.
Lets see some example screenshots:
Support/Resistance levels:
Potential Reversal levels and how setup/counts are shown:
Count part can recycle and the script shows it as 'R' , ( you can see the conditions for Recycle in the script ):
Count can be cancelled and and it's shown as 'x'
If the scripts find 9 on Setup or 13 on Count then it checks if it's a good level to buy/sell and if it decides it's good level then it shows TRSSetup Buy/Sell or TRSCount Buy/Sell and also shows the target. in following example the script checks and decide it's a good level to take long position. it can be aggressive or conservative, Conservative is recommended.
Enjoy!

VWAP Supply and Demand ZonesThis is my 1st indicator enjoy.
Description of the VWAP Supply and Demand Zones indicator:
This indicator uses the Volume Weighted Average Price (VWAP) to identify potential supply and demand zones in the market. The VWAP is a popular indicator that shows the average price of a security weighted by volume over a specified period of time. It can be used as a benchmark to measure the efficiency of trading and to identify trends and price levels.
The indicator plots the VWAP as a blue line on the chart, and also plots two other lines above and below it, which represent the upper and lower bounds of the supply and demand zones. The width of these zones can be adjusted by changing the “Zone Width” input parameter.
The indicator also plots shapes on the chart to mark when a supply or demand zone is formed. A supply zone is formed when the price crosses above the VWAP and then falls back below it, indicating that there is more selling pressure than buying pressure at that level. A red triangle is plotted above the bar where this happens, and a red zone is drawn between the previous close and previous VWAP values.
A demand zone is formed when the price crosses below the VWAP and then rises back above it, indicating that there is more buying pressure than selling pressure at that level. A green triangle is plotted below the bar where this happens, and a green zone is drawn between the previous close and previous VWAP values.
The supply and demand zones can be used as potential areas of support and resistance, where traders can look for reversal or continuation signals. For example, if the price enters a supply zone from below, it may indicate that sellers are willing to sell at higher prices, which could lead to a bearish reversal. Conversely, if the price enters a demand zone from above, it may indicate that buyers are willing to buy at lower prices, which could lead to a bullish reversal.
The indicator can be applied to any timeframe or market, but it may work better on higher timeframes where volume data is more reliable. It can also be combined with other indicators or tools to confirm or filter signals.

Support and Resistancewhat is "Support and Resistance"?
it is a support and resistance indicator.
what it does?
it draw support and resistance zones on the chart.
how it does it?
It determines the zones where the price leaves with a big candle after going horizontal for a while as support or resistance zones according to the price movement direction. while doing this, it compares the size of the candles and the elapsed time.
how to use it?
Red zones represent resistance and green zones represent support. You can buy in the support zone or sell in the resistance zone. my advice is to make your own interpretation by taking into account the price movement with different indicators. they are considered useful if there is a closure beyond the zones. otherwise, they continue to be shifted to the right.
notice: As new zones are created, old ones may disappear. so it might be wise to draw boxes using drawing tools where the old zones are.
Support and resistance are very important concepts for technical analysis. so I am thinking of updating and improving this indicator many times in the long run. but I couldn't wait long to post it.
examples:

Support Resistance Channels/Zones Multi Time FrameHello All,
For long time I have been getting a lot of requests for Support/Resistance Multi Time Frame script. Here ' Support Resistance Channels/Zones Multi Time Frame ' is in your service.
This script works if the Higher Time Frame you set is higher than the chart time frame. so the time frame in the options should be higher than the chart time frame.
The script checks total bars and highest/lowest in visible part of the chart and shows all S/R zones that fits according the highest/lowest in visible part. you can see screenshots below if it didn't make sense or if you didn't understand
Let see the options:
Higher Time Frame : the time frame that will be used to get Support/Resistance zones, should be higher than chart time frame
Pivot Period : is the number to find the Pivot Points on Higher time frame, these pivot points are used while calculating the S/R zones
Loopback Period : is the number of total bars on higher time frame which is used while finding pivot points
Maximum Channel Width % : is the percent for maximum width for each channel
Minimum Strength : each zone should contain at least a 1 or more pivot points, you set it here. (Open/High/Low/Close also are considered while calculating the strength)
Maximum Number of S/R : the number of maximum Support/Resistance zones. there can be less S/Rs than this number if it can not find enough S/Rs
Show S/R that fits the Chart : because of we use higher time frame, you should enable this option then the script shows only S/Rs that fits the current chart. if you disable this option, all S/R zones are shown and it may shrink the chart. also you may not see any S/R zone if you don't choose the higher time frame wisely ;)
Show S/R channels in a table : if you enable this option (by default it's enabled) then lower/upper bands of all S/R zones shown in a table ( even if it doesn't fit the chart ). you can change its location. zones are sorted according to their strengths. first one is the strongest.
and the other options is about colors and transparency.
Screenshots before and after zoom-out:
after zoom-out number of visible bars and highest/lowest change and it shows more S/R zones that fits the current chart!
if you see Support Resistance zone like below then you should decrease ' Maximum Channel Width ' or you should set higher time frame better:
You can change colors and transparency:
You can change Table location:
Alerts added :)
P.S. I haven't tested it so much, if you see any issue please drop a comment or send me message
Enjoy!

Supply and Demand - Order Block - Energy CandlesSupply and Demand - Order Block - Energy Candles
Description
An experimental script, designed as a visual aid, to highlight the last up or down candle before a fractal break. We can assume these candles where the point of origin that generated enough strength to break recent structure. By using them as reference points, traders are expected to follow their own set of rules and mark higher probability supply and demand zones in the area.
How to use:
Expect a potential retest in these areas, and if they fail, a potential retest in the opposite direction. The greater the number of times a zone is tested, the more likely it is to break. A fresh zone that has not yet been tested will have a higher probability of a bounce.
Fractal period and candle break type can be personalised in settings. Can be used on all timeframes (higher the better).
Indicator in use:
Extras:
An option to flip candle colours if current price is above or below them has been added.

Volume Profile and Volume Indicator by DGTVolume Profile (also known as Price by Volume) is an charting study that displays trading activity over a specified time period at specific price levels. It is plotted as a horizontal histogram on the finacial isntrumnet's chart that highlights the trader's interest at specific price levels.
The histogram is used by traders to predict areas of support and resistance. Price levels where the traded volume is high could be assumed as support and resistance levels.
Price may experience difficulty moving above or below areas with large bars. Usually there is a great deal of activity on both the buy and sell side and the market stays at that price level for a great deal of time
It is advised to use volume profile in conjunction with other forms of technical analysis to maximize the odds of success
Light version of Volume Profile is added to Price Action - Support & Resistance by DGT
