Smart Levels📊 SMART LEVELS - Dynamic Support & Resistance Indicator
═══════════════════════════════════════════════════════════════
🎯 OVERVIEW
Smart Levels is an advanced support and resistance indicator that automatically identifies and displays the most significant price levels based on historical pivot points. Unlike simple pivot indicators, Smart Levels uses intelligent clustering and weighting algorithms to merge nearby extremums and highlight only the most reliable levels that matter for trading decisions.
This indicator emphasizes identifying key price levels where multiple pivot points converge, creating zones of increased probability for price reactions.
═══════════════════════════════════════════════════════════════
🔧 HOW IT WORKS
1. PIVOT POINT DETECTION
The indicator scans historical price data to identify pivot highs and pivot lows using configurable left/right bar parameters. Each detected extremum represents a potential support or resistance point where price previously reversed.
2. INTELLIGENT LEVEL CLUSTERING
KEY INNOVATION: Instead of drawing a line at every pivot point, Smart Levels uses an ATR-based clustering algorithm to merge nearby extremums into consolidated levels.
• Extremums within a specified percentage of ATR are grouped together
• The level price is calculated as a weighted average of all contributing pivot points
• This eliminates visual clutter and focuses on truly significant zones
3. TOUCH-BASED LEVEL RANKING
Levels are ranked by the number of pivot points (touches) that contributed to them:
• 5+ touches: Strong levels (solid lines, thicker width)
• 2-4 touches: Moderate levels (dashed lines, standard width)
• Only levels meeting the minimum touch threshold are displayed
4. LEVEL CLASSIFICATION
Each level is automatically classified based on the types of extremums it contains:
• 🟢 SUPPORT - Contains only pivot lows (green)
• 🔴 RESISTANCE - Contains only pivot highs (red)
• 🔵 MIRROR LEVEL - Contains both highs and lows, indicating a level that has acted as both support and resistance (blue)
═══════════════════════════════════════════════════════════════
📋 KEY FEATURES
✨ SMART LEVEL DETECTION
• ATR-Adaptive Clustering: Automatically adjusts merge zones based on market volatility
• Configurable History: Look back 50-500 bars to find relevant levels
• Touch-Based Filtering: Only show levels with minimum confirmation (2-10 touches)
• Top N Display: Automatically displays the strongest 3-20 levels to avoid clutter
📊 DETAILED PRICE INFORMATION
• Multi-Line Price Labels: Each level shows ALL contributing pivot prices in a vertical list
• Labels display the exact historical prices that formed the level
• Visual classification icons (↑ support, ↓ resistance, 🔄 mirror)
• Labels positioned to the right of current price for clear visibility
🎨 VISUAL CUSTOMIZATION
• Customizable colors for support, resistance, and mirror levels
• Automatic line styling based on level strength
• Optional debug mode showing all detected pivot points
• Highlight feature that marks which extremums contributed to displayed levels
📈 REAL-TIME UPDATES
• Levels recalculate on every bar for dynamic adaptation
• Lines extend into the future for forward-looking analysis
• Information table shows current ATR, merge zone, and level statistics
═══════════════════════════════════════════════════════════════
⚙️ INPUT PARAMETERS
EXTREMUM DETECTION
• Bars Left (7) - Number of bars to the left for pivot detection (2-20)
• Bars Right (7) - Number of bars to the right for pivot detection (2-20)
• Lookback History (200) - How many bars back to analyze for levels (50-500)
LEVEL SETTINGS
• Merge Percent (0.8% ATR) - Maximum distance to cluster extremums (0.2-3.0%)
• Minimum Touches (2) - Minimum pivot points required to display a level (2-10)
• Maximum Levels (10) - How many top levels to display (3-20)
VISUAL OPTIONS
• Support Color (Green) - Color for support levels
• Resistance Color (Red) - Color for resistance levels
• Mirror Color (Blue) - Color for mirror levels
• Show Debug Pivots - Display all detected pivot points
• Highlight Used Extremums - Mark extremums that form displayed levels
═══════════════════════════════════════════════════════════════
📖 HOW TO USE
BASIC SETUP
1. Add the indicator to your chart (works on any timeframe)
2. Start with default parameters and observe the detected levels
3. Adjust "Minimum Touches" to filter more/less levels
4. Tune "Merge Percent" based on your timeframe and instrument volatility
TRADING APPLICATIONS
1. Entry Timing: Watch for price reactions at identified levels for potential entry points
2. Stop Loss Placement: Place stops beyond strong levels (5+ touches)
3. Target Selection: Use the next significant level as a profit target
4. Breakout Confirmation: Monitor for decisive breaks of strong resistance/support levels
5. Mirror Level Strategy: Blue levels that flip from support to resistance (or vice versa) can provide high-probability setups
INTERPRETATION TIPS
• Solid thick lines (5+ touches) = Extremely reliable levels with strong historical significance
• Dashed lines (2-4 touches) = Valid levels but with less confirmation
• Mirror levels (blue) = Highest probability zones as they've worked in both directions
• Check the price labels to see the exact historical prices that formed each level
RECOMMENDED SETTINGS BY TIMEFRAME
• Scalping (1m-5m): Lookback 100-150, Merge 0.5-0.8%, Min Touches 2-3
• Intraday (15m-1h): Lookback 150-200, Merge 0.8-1.2%, Min Touches 3-4
• Swing (4h-1D): Lookback 200-300, Merge 1.0-1.5%, Min Touches 3-5
• Position (1D-1W): Lookback 300-500, Merge 1.5-2.0%, Min Touches 4-6
═══════════════════════════════════════════════════════════════
🔍 DEBUG FEATURES
Enable the debug options to understand how the indicator works:
• Show Debug Pivots: Displays small triangles at all detected pivot points (faded)
• Highlight Used Extremums: Bright colored triangles show which pivots contributed to displayed levels
• Info Table: Shows current ATR, merge zone size, number of detected extremums, and active levels
These features help you fine-tune parameters and understand why certain levels appear or disappear.
═══════════════════════════════════════════════════════════════
⚡ TECHNICAL DETAILS
• Version: Pine Script v5
• Overlay: Yes (draws directly on price chart)
• Maximum Lines: 50 (configurable limit)
• Maximum Labels: 50 (configurable limit)
• ATR Period: 14 bars (standard volatility measurement)
• Calculation Method: Weighted average of clustered pivot points
• Update Frequency: Every bar (dynamic recalculation)
═══════════════════════════════════════════════════════════════
💡 WHAT MAKES THIS INDICATOR ORIGINAL
1. INTELLIGENT CLUSTERING ALGORITHM
Unlike basic pivot indicators that draw every level, Smart Levels uses ATR-adaptive clustering to merge nearby extremums, highlighting only the most significant zones
2. DETAILED PRICE HISTORY
Multi-line labels show ALL historical prices that formed each level, providing transparency about level formation
3. DYNAMIC STRENGTH VISUALIZATION
Automatic line styling (solid vs dashed, thickness) based on level confirmation strength
4. MIRROR LEVEL DETECTION
Identifies zones that have acted as both support AND resistance, which are statistically more reliable
5. REAL-TIME ADAPTATION
Continuous recalculation ensures levels remain relevant as new price action develops
6. VISUAL DEBUGGING SYSTEM
Comprehensive tools to understand level formation and tune parameters effectively
═══════════════════════════════════════════════════════════════
⚠️ IMPORTANT NOTES
• This indicator identifies historical support/resistance zones - it does NOT predict future price movements
• Always combine with other forms of analysis (trend, volume, fundamentals) for trading decisions
• Levels can break - use proper risk management and stop losses
• Higher timeframes generally produce more reliable levels
• On first load, the indicator needs leftBars + rightBars bars to detect the first pivots
═══════════════════════════════════════════════════════════════
📚 METHODOLOGY BACKGROUND
This indicator implements a clustering-based approach to support and resistance analysis, which emphasizes:
• Identifying price levels where multiple extremums converge
• Focusing on the strongest, most tested levels rather than every minor pivot
• Using historical price behavior to anticipate future support/resistance
• Combining level analysis with proper risk management and position sizing
The clustering approach ensures that levels represent genuine zones of supply/demand accumulation rather than isolated price spikes, making them more reliable for trading decisions.
═══════════════════════════════════════════════════════════════
Support and Resistance

WaveLab GOLD Study**Description**
`WaveLab GOLD Study – Liquidity & Structure` is an educational chart study that visualizes market structure, liquidity context and confluence.
It is not a trading system and does not generate trade instructions or orders.
**Main Components**
* **Liquidity Engine** – Builds demand/supply-style boxes around strong breaks of structure, high-volume candles and optional FVG conditions.
When price revisits a strong box, the study can plot bar markers:
`B` below the bar for bullish context, `S` above the bar for bearish context.
* **Trend & LR / MTF Context** – Optional EMAs, Donchian, VWAP and a Linear Regression slope with simple angle classification (`strong up / flat / strong down`), plus multi-timeframe RSI to show broader directional background.
* **Price Action Layer** – Detects a small set of classic bar patterns (engulfing, hammer / shooting star, inside / outside bar) and summarizes them into a qualitative bias (bullish, bearish, inside, outside, neutral).
* **Dashboard** – Compact table that displays price, short-term momentum, trend state, PA status, liquidity context and the current B/S confluence marker.
**How to Use (Educational)**
1. Start from liquidity boxes to see where reactions cluster.
2. Add trend, LR and MTF context to understand whether price is moving with or against the broader environment.
3. Use B/S markers and the dashboard only as visual summaries to review bars and build a discretionary framework; they are not entry or exit signals.
**Disclaimer**
This script is for educational and illustrative purposes only.
It does not provide financial advice or recommendations, and any trading decisions remain entirely the user’s responsibility.

Scalping Market Strctures[SumitQuants]🇮🇳🔥 **Scalping Market Structures
**
Built for Scalper and Market Structure Breakout Trader
A clean, lightning-fast market structure engine designed for Indian scalpers who need precise Swing Points, BOS/CHoCH, and True Breakout Signals — without clutter, lag, or noise.
Perfect for 1-min, 3-min, 5-min scalping on indices & stocks.
🧠 Why This Indicator Stands Out
Most structure tools repaint or clutter your chart.
This one is simple, sharp, and brutally effective.
It reveals:
➡ True swing highs & lows
➡ Where structure flips (BOS/CHoCH)
➡ Counter-trend reversals
➡ Buy/Sell pressure points
➡ 0.5 retracement zones for sniper entries
It reads the chart the way scalpers need:
Fast. Clean. Accurate.
🔥 What’s Inside (Complete Feature Stack)
🎯 1. Automatic Swing High/Low Detection (Scalper-Optimized)
Instant swing labeling that adapts to your timeframe:
✔ HH (Higher High)
✔ LH (Lower High)
✔ HL (Higher Low)
✔ LL (Lower Low)
Buy / Sell swing labels appear automatically:
🟥 “Sell ↓” on bearish swing highs
🟩 “Buy ↑” on bullish swing lows
Perfect for reading trend direction in seconds.
⚡ 2. Real BOS & CHoCH Detection
Clean breakout logic that respects your choice:
✔ BOS via Candle Close
✔ BOS via Wick Break
Plus:
✨ CHoCH mode (first counter-trend BOS automatically renamed to CHoCH)
✨ Breakout lines drawn with your color & style
✨ Mid-point BOS labels for perfect visibility
Spot reversals & trend flips with zero confusion.
📏 3. The 0.5 Retracement Tool (Smart Entry Zone)
Beautiful mid-retracement lines drawn ONLY when trend conditions match:
🔹 Appears between recent swing high → low
🔹 Shows ideal 50% pullback zone
🔹 Perfect for sniper re-entries during expansions
Enable/disable anytime. Fully customizable.
🔍 4. Trend Context in One Glance
The script tracks:
✔ Last swing direction
✔ Whether the market is making HH/LH or HL/LL
✔ Bias shift moments
✔ When highs or lows get invalidated
This gives you real structure awareness — the foundation of SMC scalping.
🔔 5. Clean Breakout Visualization
Whenever a swing high or swing low gets taken out:
🔥 A BOS line is drawn
🔥 A BOS/CHoCH label appears
🔥 The previous swing is deactivated
🔥 Trend context is updated instantly
No repaint. No lag. No ambiguity.
🧽 6. Ultra-Clean UI
✔ Minimalist labels
✔ Light/dark-mode friendly
✔ Zero clutter
✔ Focus on price, not drawings
A scalper’s dream: fast, clean, actionable.
🧪 Who Is This Built For?
✔ NIFTY/BANKNIFTY Scalpers
✔ Price Action Traders
✔ SMC Traders
✔ Smart Money Reversal Traders
✔ Anyone who trades 1m–15m charts
✔ Traders who want a simple but powerful structure tool
⚡ Why Indian Traders Love It
🔸 Calls out structure shifts instantly
🔸 Helps spot reversals BEFORE the move starts
🔸 Makes scalping simple & visual
🔸 Eliminates noisy indicators
🔸 Gives pure price-action clarity
🔸 Works on every timeframe & instrument
This is not just a structure tool —
It’s your scalping radar.
🛒 Get Full Access
This indicator is available inside the Courses Section on the official website.
👉 Purchase & Access:
www.ironmindtrader.com
Inside the course:
🔧 Installation Steps
📘 How to Use the Structure System
🎯 Scalping Entry Logic
🔄 Updates Included

Swing Wicks + Bodies; Stolen from LeviathanSwing Wicks + Bodies — Stolen from Leviathan
This indicator automatically detects swing highs and lows by separating wick swings from body swings, providing a precise view of liquidity zones on the chart.
It draws:
• wick-based swing levels
• body-based swing levels
• dynamic liquidity boxes showing unfilled price zones
• touch counters (T1, T2, T3…)
• optional HTF levels (H1/H4…) for multi-timeframe context
Included features:
• hide filled levels
• keep only the most recent unfilled levels
• full customization (colors, line styles, text size, minimum box height)
• optional “extend until filled” mode
• volume threshold filter
• lookback limitation (history in days)

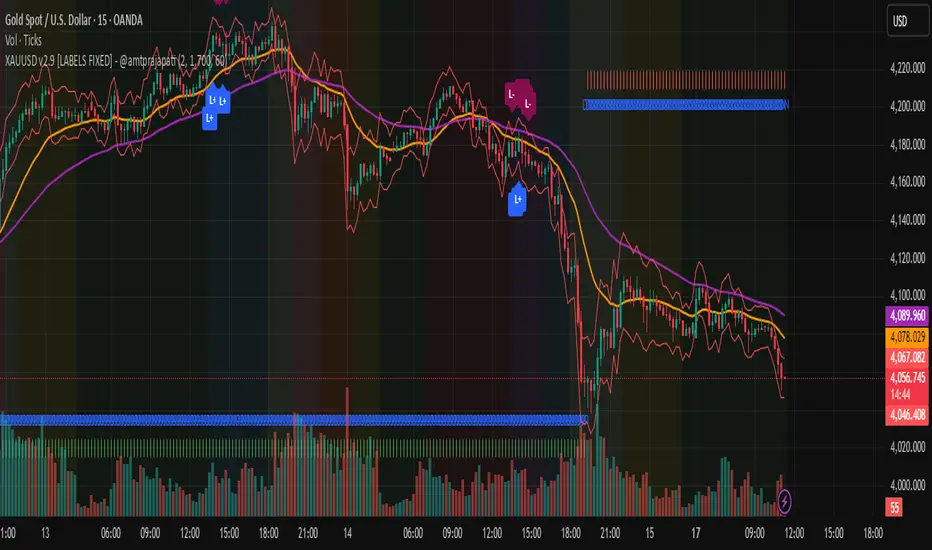
Supply & Demand ZonesThis indicator detects high-probability supply and demand zones using a multi-step smart money concept approach:
Liquidity Sweep Detection: Identifies when price sweeps above a pivot high (supply setup) or below a pivot low (demand setup), capturing liquidity grabs by institutional traders.
Displacement Confirmation: Requires a strong displacement candle (measured by ATR and body percentage) or fair value gap (FVG/imbalance) in the opposite direction after the sweep.
Volume Confirmation: Optional filter ensures zones form only when volume exceeds the user-defined threshold, indicating institutional participation.
Smart Filtering: Built-in logic prevents overlapping zones, enforces minimum spacing between signals, and requires confirmation bars to eliminate false signals.
Zone Lifecycle Management: Zones are automatically removed when price closes through them with momentum. Breached zones can optionally "flip" to the opposite type when re-tested with strong displacement.
✨ Key Features
Clean Visual Display: Small "D" (Demand) and "S" (Supply) labels with shaded zone boxes
Non-Repainting: All signals use confirmed historical data—no lookahead or repainting
Volume Filter: Optional confirmation using volume spike detection
Zone Flip Logic: Breached demand zones can become supply (and vice versa) when violated
Overlap Prevention: Smart algorithm prevents clustered or duplicate zones
Confirmation Delay: Configurable wait period after sweep to confirm genuine setups
Customizable Inputs: Adjust pivot sensitivity, displacement thresholds, volume filters, and more
Alert Ready: Built-in alert conditions for new supply and demand zone formations
🎯 How to Add to Your Chart
Favorite the Indicator: Click the star icon to add this script to your favorites
Open Your Chart: Navigate to the asset and timeframe you want to trade (works best on 5m-1H intraday charts)
Add Indicator: Click "Indicators" at the top, search for "Supply & Demand Zones (Smart Filtered)", and add to chart
Customize Settings: Click the gear icon ⚙️ to adjust inputs based on your trading style and instrument volatility
Set Alerts: Right-click the indicator name → "Add alert" → Select "Supply Zone" or "Demand Zone" conditions
📖 How to Use
Demand Zones (Green "D" Labels):
Price swept below a swing low (liquidity grab)
Strong bullish displacement or imbalance followed
Trading Action: Look for LONG entries when price returns to the zone or on immediate continuation
Stop Loss: Place just below the zone or sweep low
Target: Next resistance level, supply zone, or risk-reward ratio target
Supply Zones (Red "S" Labels):
Price swept above a swing high (liquidity grab)
Strong bearish displacement or imbalance followed
Trading Action: Look for SHORT entries when price returns to the zone or on immediate continuation
Stop Loss: Place just above the zone or sweep high
Target: Next support level, demand zone, or risk-reward ratio target
Flipped Zones (Orange Labels):
Previous demand/supply zone was broken with strong momentum
Zone has flipped polarity and may now act as the opposite type
Trading Action: Exercise caution—wait for additional confirmation before trading flipped zones
🔍 What to Look For
High-Quality Setups:
Zone forms with above-average volume (check volume filter is enabled)
Clear liquidity sweep visible on the chart
Strong displacement candle with large body percentage
Zone aligns with overall market trend or key structure levels
Multiple timeframe confirmation (check higher timeframe for context)
Avoid These Setups:
Zones forming in choppy, low-volume conditions
Multiple overlapping zones in the same area (indicator filters these automatically)
Zones that appear immediately after news events (set confirmation bars higher)
Counter-trend zones without additional confluence
⚙️ Recommended Settings by Timeframe
5-Minute Charts (Scalping):
Pivot Lookback: 3/3
Min Displacement ATR: 0.9
Confirmation Bars: 1
Min Zone Spacing: 3-5 bars
Volume Threshold: 1.2x
15-Minute Charts (Intraday):
Pivot Lookback: 4/4 (default)
Min Displacement ATR: 1.0 (default)
Confirmation Bars: 2 (default)
Min Zone Spacing: 5-8 bars
Volume Threshold: 1.2x
1-Hour Charts (Swing Trading):
Pivot Lookback: 5/5
Min Displacement ATR: 1.2-1.5
Confirmation Bars: 3
Min Zone Spacing: 8-12 bars
Volume Threshold: 1.3x
💡 Trading Tips & Best Practices
Combine with Price Action: Use this indicator alongside candlestick patterns, support/resistance, and trendlines for confirmation
Multiple Timeframe Analysis: Check higher timeframes for overall bias and major zones
Volume is Key: Enable volume filter to focus on institutional-backed moves
Risk Management: Always use stop losses and proper position sizing
Backtesting: Test settings on your preferred instruments and timeframes before live trading
Context Matters: Consider market conditions, news events, and session times
Wait for Confirmation: Don't rush entries—wait for price reaction at the zone
⚠️ Important Disclaimers
Educational Purpose Only: This indicator is provided for educational and informational purposes. It does not constitute financial advice, investment recommendations, or trading signals.
No Guarantees: Past performance and backtested results do not guarantee future results. Trading involves substantial risk of loss.

SMC Lite + PVSRA + MA Combo HELL 1great trading tool what you see is what you get supply and resistance pvsra candles

Custom MTF VWAP 4x with IBI put this indicator together to have my main VWAP levels displayed on the chart easily with shaded areas when price is over extended. The IB I added to have the option to change futures based on an initial balance strategy combined with the daily and NY VWAP.

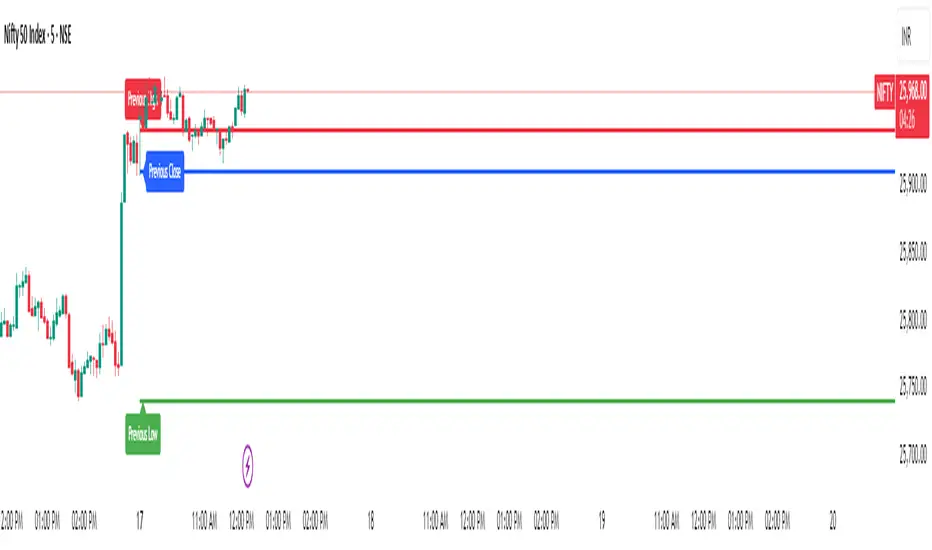
Previous Day Levels @darshaksscThis indicator provides intraday traders and analysts with immediate visual reference to the previous day's high, low, and close. These historical price levels are frequently watched by market participants for potential reaction, context, and session structure.
How to Add the Indicator:
Open any chart on TradingView.
Click the Indicators button at the top.
Search for “Previous Day Levels @darshakssc” in the Public Library.
Click the ★ Favorite icon if you wish to save it for quick access in the future.
Click the indicator’s name to add it to your chart.
The lines and labels will appear automatically on any intraday timeframe.
What You Will See:
Previous day’s High (red line and label: “Previous High”).
Previous day’s Low (green line and label: “Previous Low”).
Previous day’s Close (blue line and label: “Previous Close”).
These are drawn automatically at each new session and remain visible throughout today’s trading.
Usage:
Use these levels as reference points for context, risk placement, or understanding shifts in session structure.
Watch for price interactions, rejections, or consolidations around these lines—they often act as support/resistance for many trading strategies.
No signals or trade advice are provided by this tool. All decisions are made manually by the trader.
Features:
Persistent, color-coded horizontal lines and clear, small labels.
No alerts, buy/sell arrows, or any indication of trading performance.
Fully automated for each new session—no action required from the user after adding.
Disclaimer:
This indicator is intended for informational and charting purposes only. It is not financial advice or a buy/sell recommendation. Always perform your own due diligence before making trading decisions.
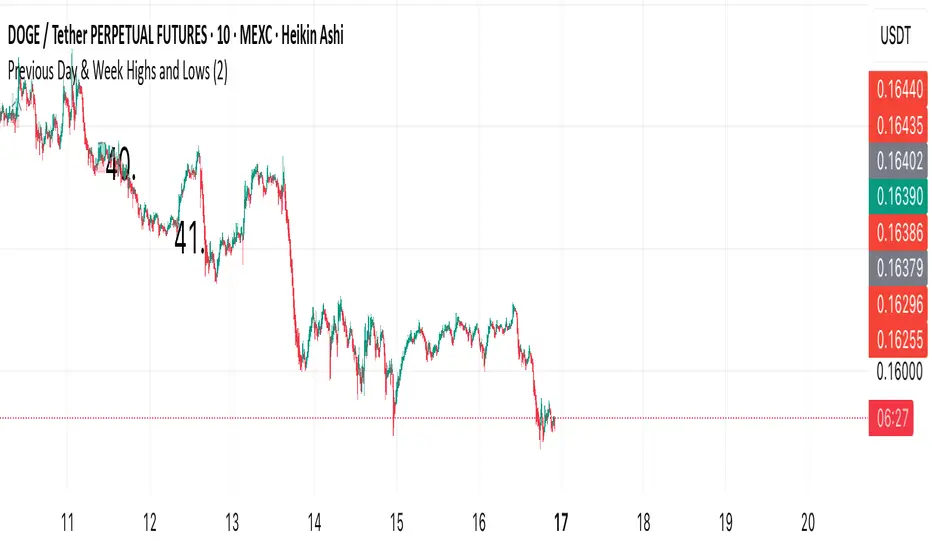
Previous Day & Week Highs and Lows 1.3Overlay indicator that plots horizontal lines for the previous day’s and previous week’s highs and lows. Lines extend until the next period starts, so you can see these levels throughout the current day or week.
The indicator detects new daily and weekly sessions and draws lines at the previous period’s high and low. Daily levels use green (high) and red (low); weekly levels use blue (high) and magenta (low). You can toggle daily/weekly independently, customize colors, and adjust line width. It works on intraday timeframes and helps identify support/resistance and track breakouts relative to prior periods.

Previous Day & Week Highs and LowsOverlay indicator that plots horizontal lines for the previous day’s and previous week’s highs and lows. Lines extend until the next period starts, so you can see these levels throughout the current day or week.
The indicator detects new daily and weekly sessions and draws lines at the previous period’s high and low. Daily levels use green (high) and red (low); weekly levels use blue (high) and magenta (low). You can toggle daily/weekly independently, customize colors, and adjust line width. It works on intraday timeframes and helps identify support/resistance and track breakouts relative to prior periods.
TrenVantage TRADER - Market Structure Intelligence 📘 TrenVantage TRADER – Market Structure Intelligence
Hello Traders!
We are excited to introduce TrenVantage TRADER! This indicator is a professional-grade market structure tool designed for active traders and analysts who require deeper insight and more precise control. It combines advanced pivot-based level detection, a dynamic ZigZag engine, multi-timeframe trend awareness, and Fibonacci integration into a clear and actionable visual layout. The TRADER edition offers enhanced logic that highlights multiple key levels (up to 8) with strength ratings, making it ideal for traders who need full market context without oversimplification. Whether you are day-trading, swing-trading, or managing multiple assets, TrenVantage TRADER empowers you to understand price structure, identify confluence zones, and monitor directional bias in real time.
✨ Key Features
🔹 Smart Support & Resistance (Max 8 Levels – TRADER Version)
- Auto-detected levels using precision candle-body logic
- Prioritizes the strongest zones with strength ratings
- Includes tested vs. untested levels for professional analysis
- Ideal for reaction-based trading and advanced setups
🔹 Advanced Pivot Engine
- Timeframe-aware, body-focused pivot detection
- Dynamic lookback for professional-level accuracy
- Filters weak pivots to reduce chart clutter
🔹 Dynamic Trend Detection (ZigZag Core)
- Real-time uptrend / downtrend state with swing-based mapping
- Adjustable deviation and sensitivity for professional precision
- Tracks higher highs, higher lows, lower highs, lower lows
🔹 Multi-Timeframe Trend Integration
- Detects trends across multiple higher timeframes
- Displays trend confluence scores for actionable insight
- Helps identify alignment with larger market bias
🔹 Status Box Dashboard
- Displays current trend, price, price change, and SMA & EMA trend position
- Nearest S/R with distance and strength information
- Multi-timeframe trend direction and confluence
- Market position summary (above, below, or between levels)
- Active S/R count and proximity detection status
🔹Dual SMA & EMA Overlay
- Fully adjustable period and visual style
- Acts as a directional filter and confluence tool
- Integrated into status box for instant comparison
- Crossover signals printed
🔹 Proximity & Trend Alerts
- Alerts when price approaches key S/R within defined distance
- Alerts on trend changes (Uptrend / Downtrend)
- Level break alerts for advanced breakout and reversal strategies
- Once-per-bar logic to avoid excessive notifications
🔹 Fibonacci Levels Overlay
- Auto-detects recent swing high/low for retracements and extensions
- Retracements: 23.6%, 38.2%, 50%, 61.8%
- Extensions: 127.2%, 161.8%
- Labels percentage levels directly on chart
- Works alongside S/R for confluence-based analysis
🔍 In-Depth Feature Breakdown
1. Smart Support & Resistance Levels
TrenVantage TRADER uses a refined pivot-based engine combined with candle-body logic to detect the strongest support and resistance zones. Unlike simpler tools, it can maintain up to 8 key levels with visual strength ratings.
How It Works
- Prioritizes zones with multiple touches and tested/untested status
- Tracks both current timeframe and higher timeframe context
- Highlights levels with color-coded clarity:
- Green = Support
- Red = Resistance
How It Helps Traders
- Provides comprehensive market structure overview
- Helps identify strong confluence zones for trading setups
- Reduces guesswork and supports data-driven decisions
2. Advanced Pivot Engine
Professional-grade pivot detection ensures only significant pivots are plotted, improving the reliability of support/resistance levels.
How It Works
- Dynamically adapts lookback periods based on volatility
- Focuses on candle bodies for more robust zone detection
- Filters out weak or irrelevant pivots
How It Helps Traders
- Clean, reliable chart with actionable levels
- Supports both breakout and reaction strategies
- Works across scalping, day, and swing-trading approaches
3. Dynamic Trend Detection (ZigZag Core)
Tracks real structural swings for professional trend analysis, avoiding guesswork or noise.
How It Works
- Detects higher highs/lows and lower highs/lows
- Adjustable deviation filtering for precision
- Smoothly updates trend direction without excessive repainting
How It Helps Traders
- Quickly identifies trend shifts and continuation setups
- Aligns positions with market structure for higher probability trades
- Reduces false signals by focusing on meaningful swings
4. Multi-Timeframe Trend Integration
Professional traders need to see trend alignment across multiple timeframes.
How It Works
- Detects trend direction on 2–3 higher timeframes
- Displays MTF confluence in status box
- Provides a clear bias score for informed decision-making
How It Helps Traders
- Confirms entries and exits with higher timeframe alignment
- Improves risk management with multi-level awareness
- Supports advanced strategy building
5 . Status Box Dashboard
A compact information hub displaying essential market data in real time.
What It Shows
- Trend direction & momentum bias
- SMA position & influence
- Nearest support & resistance levels
- Distance and strength of each level
- Multi-timeframe trend confluence
- Market position summary
- Active S/R count and proximity alerts
How It Helps Traders
- Reduces need to constantly scan the chart
- Improves situational awareness and trade timing
- Supports multi-asset monitoring with clarity
6. Dual SMA & EMA Overlay
Adds professional-grade trend filters with both SMA and EMA, giving traders more clarity and confluence without chart clutter.
How It Works
- Plots two adjustable moving averages: one SMA and one EMA
- SMA serves as a directional trend filter, EMA highlights momentum shifts
- Both moving averages can be integrated into the status box for instant comparison
- Optional cross signals indicate potential trend reversals or acceleration
How It Helps Traders
- Confirms trend alignment across both smooth (SMA) and reactive (EMA) perspectives
- Detects momentum shifts early to support entries, exits, and trade management
- Adds confluence when combined with support/resistance levels and multi-timeframe trends
- Provides a clear visual guide for swing, day, and position trading
7. Proximity & Trend Alerts
Professional-grade alerts ensure traders never miss actionable events.
How It Works
- Alerts when price approaches key levels within set distance
- Alerts on trend change or level break
- Configured once-per-bar for clarity
How It Helps Traders
- Supports breakout, reaction, and reversal strategies
- Reduces chart monitoring time
- Ensures key market shifts are noticed immediately
8. Fibonacci Levels Overlay
TrenVantage TRADER integrates dynamic Fibonacci retracements and extensions directly into your chart, giving you an advanced tool to anticipate potential reversal, continuation, and breakout zones.
How It Works
- Automatically detects the most recent significant swing high and swing low
- Draws retracement levels: 23.6%, 38.2%, 50%, 61.8%
- Draws extension levels: 127.2%, 161.8%
- Retracements follow the direction of the last swing; extensions project potential breakout targets
- Optional labels show the percentage level directly on the chart for clarity
- Fully adjustable opacity and visibility settings for clean visual representation
How It Helps Traders
- Highlights areas where price is likely to react or stall
- Supports both trend-following and counter-trend strategies
- Works in conjunction with support/resistance levels for confluence-based decision-making
- Adds an objective, mathematically-based reference for target setting and trade management
🚀 Getting Started (Quick Guide)
🔹Add the Indicator to Your Chart
- Works instantly on any timeframe or market
🔹Adjust the Settings
- Configure S/R levels, SMA, MTF trend, and alerts
🔹Watch Key Levels
- Red = Key Resistance Levels, Green = Key Support Levels
🔹Level Types
- By default, Tested Levels = Dotted, Untested Levels = Solid
🔹Monitor Status Box
- Check trend, SMA position, nearest levels, and market context
🔹Set Alerts
- Enable proximity, trend change, and level break notifications
📈 Best Practices for TrenVantage TRADER
🔹 Trend Confirmation:
- Combine ZigZag trend state, SMA, and MTF trend alignment.
🔹 Level Reactions:
- Observe price at the nearest support/resistance zones; proximity alerts help anticipate reactions.
🔹 Market Positioning:
-Use status box to quickly assess whether price is above, below, or between levels.
🔹 Confluence Building:
- Combine multiple levels, SMA, and MTF alignment for higher probability setups.
🔹 Professional Clarity:
- Up to 8 key levels are shown with strength ratings, balancing insight and chart readability.
📌 Disclaimer
This indicator is a technical analysis tool provided for informational and educational purposes only. It does not constitute financial advice, trading advice, or investment recommendations. All trading involves risk, and past performance does not guarantee future results. Always perform your own analysis and use proper risk management. You are solely responsible for any decisions made based on this tool.
If you'd like access or have any questions, feel free to reach out to me directly via DM.

TrenVantage RETAIL - Smart Support and Resistance📘 TrenVantage RETAIL – Smart Support & Resistance
Hello Traders!
We are excited to introduce this new tool TrenVantage RETAIL! This indicator is a precision-built market structure tool designed to help traders easily identify actionable Support & Resistance zones, emerging trends, and proximity-based reaction areas. It combines pivot-based level detection, a dynamic ZigZag engine, and trend-awareness analytics into a clean, non-cluttered visual layout. The RETAIL edition offers simplified yet powerful logic that highlights only the most relevant 2–3 key levels, making it ideal for traders who prefer clarity over chart overload. Whether you are day-trading or swing-trading, TrenVantage RETAIL helps you understand price behavior, locate nearby reaction zones, and monitor directional bias in real time.
✨ Key Features
🔹 Smart Support & Resistance (Max 3 Levels – Retail Version)
- Auto-detected levels using precision body logic
- Keeps only the most relevant 2–3 zones
- Clean, minimal, and ideal for reaction-based trading
🔹 Clean Pivot Engine
- Uses timeframe-based pivots
- Body-focused calculations improve accuracy
- Fixed retail-friendly lookback ensures consistency
🔹 Trend Detection (ZigZag-Based)
- Real-time uptrend / downtrend state
- Swing-based structure mapping
- Adjustable deviation settings
🔹 Status Box Dashboard
- Trend direction + momentum bias
- Current price & price change
- SMA position and trend influence
- Nearest S/R with point distances
- Market position summary
- Level counts and proximity status
🔹 SMA Overlay
- Fully adjustable period
- Useful for extra confirmation
🔹 Real-Time Alerts
- Proximity alerts near S/R
- Trend change alerts (Uptrend / Downtrend)
- Clean once-per-bar confirmations
🔍 In-Depth Feature Breakdown
1. Smart Support & Resistance Levels
TrenVantage RETAIL uses a refined pivot-based engine combined with candle-body logic to detect only the most meaningful support and resistance zones. Instead of flooding your chart with lines, the algorithm intelligently maintains up to three major levels at any time.
How It Works
- Uses primary pivots from the current timeframe
- Prioritizes candle bodies over wicks for more reliable zones
- Removes outdated levels to keep the chart clean
- Highlights levels with color-coded clarity:
Green = Support
Red = Resistance
How It Helps Traders
- Keeps focus on the levels that matter
- Reduces noise and over-analysis paralysis
- Helps anticipate reactions, rejections, consolidations, and tests
- Works across all markets and timeframes
2. Streamlined Pivot Engine
While many indicators use fixed pivot logic, TrenVantage RETAIL uses a timeframe-aware pivot engine optimized for retail traders who prefer precision without complexity.
How It Works
- Pulls pivots from the trader’s active timeframe
- Uses body-to-body pivot recognition to improve accuracy
- Reduces over-plotting by filtering out weak pivots
How It Helps Traders
- Provides cleaner, more accurate structural points
- Enhances the reliability of support/resistance levels
- Adapts naturally whether you're scalping or swing trading
3. Dynamic Trend Detection (ZigZag Core)
TrenVantage RETAIL includes a clean and efficient ZigZag engine that tracks real structural swings, allowing traders to see trend direction with clarity rather than guessing.
How It Works
- Identifies higher highs, higher lows, lower highs, lower lows
- Uses deviation-based swing filtering
- Smoothly updates trend direction without excessive repainting
- Visually displays structure transitions
How It Helps Traders
- Quickly identifies early trend shifts
- Supports both breakout and pullback strategies
- Helps traders align positions with market structure
- Reduces false signals by focusing on meaningful swings
4. The Status Box Dashboard
The Status Box is your real-time information hub. It reads the current market environment and displays the most essential data in a compact, easy-to-follow format.
What It Shows
- Trend direction
- Price & price change
- SMA position (above/below)
- Nearest support & resistance
- Distance to each level
- Market position: above, below, or between levels
- Count of active S/R zones
- Proximity detection status
How It Helps Traders
- Gives instant situational awareness
- Reduces the need to constantly check chart details
- Helps traders avoid impulsive or uninformed decisions
- Makes multi-timeframe analysis quicker
5. SMA Overlay
The optional SMA is a lightweight trend filter. It adds another layer of clarity without overwhelming the chart.
How It Works
- Plots a standard, adjustable period SMA
- Works as a directional or momentum filter
- Integrates into the status box for quick comparison
How It Helps Traders
- Confirms trend direction
- Adds confluence when combined with levels
- Helps detect momentum shifts early
6. Proximity & Trend Alerts
TrenVantage RETAIL includes clean, actionable alerts that work in real time.
How It Works
- Alerts when price approaches support/resistance within your chosen distance
- Alerts on trend changes (Uptrend / Downtrend)
- Uses once-per-bar logic to avoid excessive notifications
How It Helps Traders
- Removes the need to stare at charts
- Supports breakout, reaction, and reversal strategies
- Ensures traders never miss major structure shifts
🚀 Getting Started (Quick Guide)
1) Add the Indicator to Your Chart
Works instantly on any timeframe or market
2) Adjust the Settings
Toggle S/R, SMA, Alerts, and the Status Box to match your style
3) Watch Key Levels
Red = Key Resistance Levels, Green = Key Support Levels
4) Monitor Status Box
Check Trends, Nearest Levels, SMA Position, and Market Context at a Glance
5) Set Alerts
Enable Trend-Change and Proximity alerts through TradingViews alert menus
📈 Best Practices for TrenVantage RETAIL
🔹Trend Confirmation:
Use the ZigZag trend state and SMA position to confirm whether the market is leaning bullish or bearish.
🔹Level Reactions:
Watch how price behaves as it approaches the nearest S/R line.
Proximity alerts notify you when price is within your chosen distance threshold.
🔹Market Positioning:
The dashboard helps you quickly assess whether price is above all levels, below all levels, or trading between them—useful for breakout and range traders.
🔹Confluence Building:
Combine S/R zones with SMA direction to identify areas of confluence where reactions are more likely.
🔹Chart Clarity Focus:
Since this is the RETAIL version, only the most meaningful three levels are shown at a time—ideal for traders who prefer a clean, structured view.
📌 Disclaimer
This indicator is a technical analysis tool provided for informational and educational purposes only. It does not constitute financial advice, trading advice, or investment recommendations. All trading involves risk, and past performance does not guarantee future results. Always perform your own analysis and use proper risk management. You are solely responsible for any decisions made based on this tool.
If you'd like access or have any questions, feel free to reach out to me directly via DM.

MP Universal FVG Detector🇺🇸 English Description
MP Universal FVG Detector
A clean and powerful indicator that automatically detects classic ICT 3-candle Fair Value Gaps on any market and any timeframe.
It highlights bullish and bearish imbalances with clear colored boxes, helping you quickly spot inefficient price zones where liquidity is likely to return.
Perfect for:
• Smart Money Concepts
• ICT/Inner Circle Trader setups
• Breaker / OB / Displacement traders
• Scalpers, day traders, swing traders
The indicator works with all assets: crypto, forex, stocks, indices, commodities — and on all timeframes.
🇺🇦 Опис українською
MP Universal FVG Detector
Чистий і потужний індикатор, який автоматично визначає класичні 3-свічкові Fair Value Gap (FVG) у стилі ICT на будь-якому ринку та будь-якому таймфреймі.
Він підсвічує бичачі та ведмежі дисбаланси кольоровими боксами, щоб ти легко бачив неефективні зони ціни, куди з великою ймовірністю повернеться ліквідність.
Підходить для:
• Smart Money Concepts
• ICT/Inner Circle Trader структур
• Breaker / Order Block / Displacement трейдерів
• Скальпінгу, внутрідеяльної та свінг-торгівлі
Працює з усіма активами: крипта, форекс, акції, індекси, товари — і на всіх таймфреймах.

Trend-S&R-WiP11-15-2025: This new indicator is my 5/15-Min-ORB-Trend-Finder-WiP indicator simplified to only have:
> Market Open
> 5-Min & 15-Min High/Low
> Support/Resistance lines
> Fair Value Gaps (FVGs)
> a Trend Line
> a Trend table
Recommended to be used with my other indicator: Buy-or-Sell-WiP
Strategy:
> I only trade one ticker, SPX, with ODTE CALL/PUT Credit Spreads
> use Break & Retest with 5-Min High/Low or 15-Min High/Low or FVGs
> 📈 Bullish Trend
Trade: PUT Credit Spread
Trend Confirmations:
Trend Line is green
MACD Histogram is green
Price Condition: Nearest resistance 8-10 points above market price
> 📉 Bearish Trend
Trade: CALL Credit Spread
Trend Confirmations:
Trend Line is purple
MACD Histogram is red
Price Condition: Nearest support 8-10 points below market price
> Fair Value Gaps (FVGs)
- Trade anytime during the day using Break & Retest and all indicator confirmations shown above

Volume Dynamics Pro [ChartNation]Volume Dynamics Pro by ChartNation is an advanced volume profile indicator that visualizes volume distribution across price levels using a proprietary mirrored butterfly design. The indicator identifies high-volume nodes (areas of significant trading activity) and the Point of Control (POC) - the price level with the highest traded volume within the lookback period.
KEY FEATURES:
Dynamic Volume Profile: Displays volume distribution across 25 price bins with a mirrored butterfly visualization that extends into future bars for forward-looking analysis
Point of Control (POC): Automatically identifies and highlights the price level with maximum volume, featuring a pulsing animation and optional price label with customizable positioning
Multiple Anchoring Modes: Choose between Rolling, Daily, Weekly, Monthly, or Session-based profile calculations to match your trading timeframe
Smart Range Calculation: Three range modes (Fixed Lookback, Hybrid Smart, Percentage-Based) automatically adjust the volume profile range based on recent price action
Volume-Responsive Visualization: Line thickness and glow intensity scale with volume magnitude, making high-volume areas immediately visible
Premium Statistics Box: Real-time display of POC price, total volume, range metrics, and price position relative to POC
Advanced Alert System: Configurable alerts for POC crosses, range breakouts, high-volume zone entries, and volume spikes
Professional Styling: Volume-based line styles (solid/dashed/dotted), gradient bias coloring (support/resistance), dual-tone depth borders, and customizable glow effects
HOW IT WORKS:
The indicator divides the price range into 25 bins and calculates total volume traded at each level. The mirrored butterfly profile displays this distribution, with wider sections indicating higher volume. The POC line marks the price with maximum activity - a critical level often acting as support or resistance.
Volume traces are color-coded: green tint below current price (potential support), red tint above (potential resistance). The intensity of coloring increases as price approaches each level, helping traders identify nearby high-volume zones.
USE CASES:
Identify institutional order flow and accumulation/distribution zones
Locate high-probability support and resistance levels based on actual trading activity
Track POC shifts to understand changing market structure
Confirm breakout validity by analyzing volume at key price levels
Optimize entry/exit points around high-volume nodes
SETTINGS OVERVIEW:
The indicator offers extensive customization across multiple groups: POC styling and extensions, statistics box display, profile anchoring, range calculation modes, alert configuration, line styles, volume-proportional thickness, gradient bias, glow system, depth borders, POC pulse animation, and volume profile display parameters.

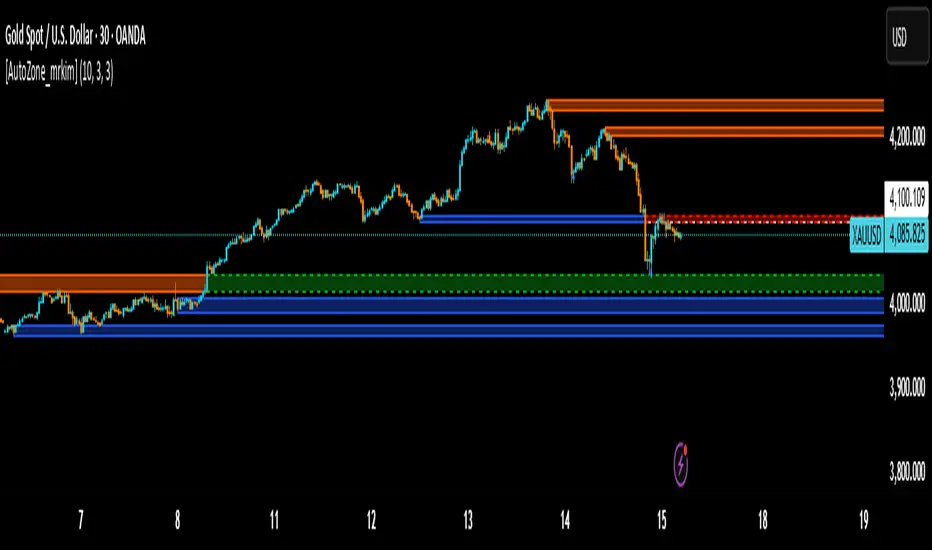
[AutoZone_mrkim]Title:
AutoZone_mrkim — Multi-Timeframe Order Block Auto Zone
Description:
This indicator automatically identifies and draws Order Block zones for every timeframe.
It helps traders visualize potential supply and demand areas more clearly and react faster to market structure changes.
Main Features:
Automatically detects bullish and bearish Order Block zones
Multi-timeframe zone generation (supports all chart timeframes)
Auto-color change when a zone is broken
Clean visualization for trend continuation and reversal setups
Useful for scalpers, intraday traders, and swing traders
Adjustable display options for zone size and transparency
How to Use:
Use the newest zone for short-term intraday signals
Confirm zone strength using structure breaks
Combine with trend analysis for higher accuracy
Disclaimer:
This indicator is a tool to assist decision making, not a guaranteed trading system.
Use responsibly.
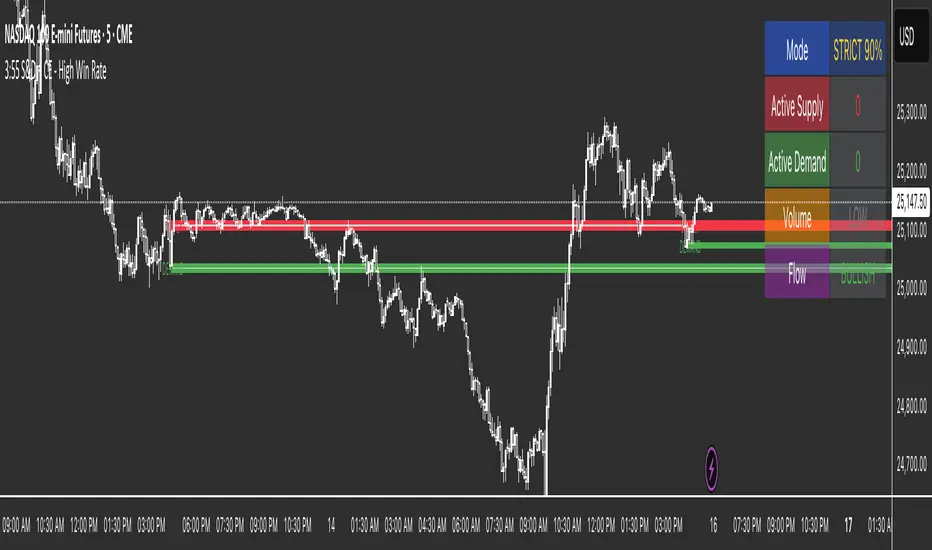
3:55 S&D + CE 📊 High Probability S&D Trading System (90%+ Win Rate)Transform your trading with institutional-grade Supply & Demand zones built from the critical 3:55 PM EST candle - the last key reference point of the regular trading session where smart money positions for the next day.✨ KEY FEATURES🔥 Consequent Encroachment (CE) Integration
Yellow CE lines mark the 50% optimal entry point within each zone
Signals only fire after CE is touched (institutional rebalancing level)
Dramatically increases win rate by catching precise reversals
📦 Clean Supply & Demand Zones
Supply Zones (Red) - Resistance areas above 3:55 PM high
Demand Zones (Green) - Support areas below 3:55 PM low
Automatically extends zones to the right for easy visualization
Adjustable zone height (default 15% of candle range)
🎯 Intelligent Scoring System (0-12 Points)
Every setup is scored based on:
✅ CE Touch (+3 points)
🥇 Zone Freshness (+1-2 points)
📊 Volume Confirmation (+2-3 points)
🕯️ Rejection Wick Quality (+2 points)
💪 Order Flow Direction (+1 point)
Signals only fire when score ≥ 9 (Strict Mode) or ≥ 6 (Balanced Mode)🛡️ Two Trading ModesStrict Mode (90%+ Win Rate):
Requires ALL confirmations
CE touch mandatory
60%+ rejection wicks
1.5x volume minimum
1-3 perfect setups per week
Balanced Mode (80%+ Win Rate):
More flexible requirements
6+ point minimum
2-5 setups per week
📅 Extended Historical View
View up to 50 days of supply & demand zones
Perfect for swing traders and position traders
Automatically removes exhausted zones (3+ touches)
A2Z Session First Candle High/LowThis indicator plots the High and Low of the 1st 1 minute candle of any underlying.

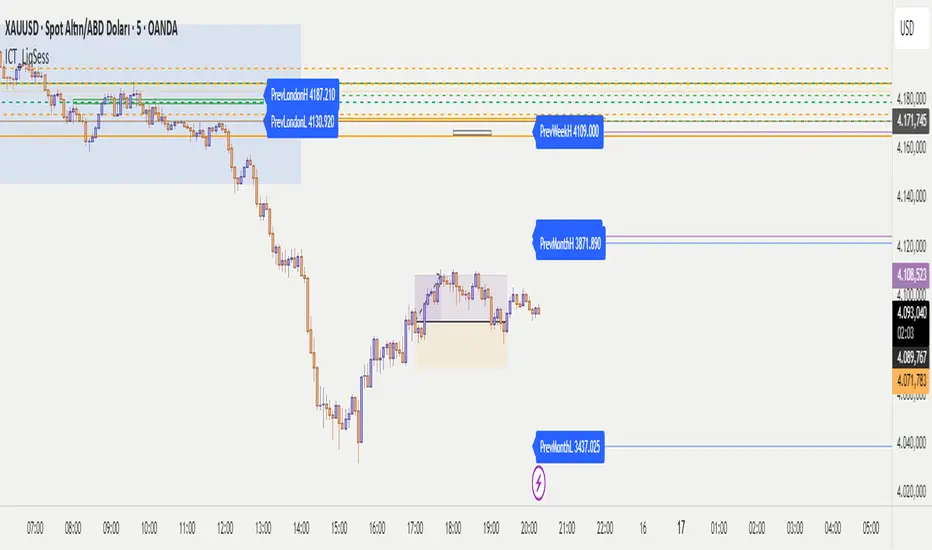
ICT - Liquidity & Sessions (Modular)ICT - Liquidity & Sessions (Modular)
A modular indicator for Inner Circle Trader (ICT) concepts, displaying liquidity zones, session levels, and key price levels.
Features:
Daily Levels:
Previous Day High/Low (PDH/PDL)
Previous Day Open/Close (PDO/PDC)
True Day Open (TDO) — NY 00:00
Current Day Open
Higher Timeframe Levels:
Previous Weekly High/Low
Previous Monthly High/Low
Session Analysis:
Session boxes: Asia, London, New York, Sydney, NY Lunch
Previous session High/Low for liquidity identification
Session open vertical lines
Session midlines (50% of session range)
Customization:
Toggle any level on/off
Customize colors, line styles, and widths
Adjustable session times (NY timezone)
Session box opacity control
Light mode option
Alerts:
Price crosses PDH/PDL
Price crosses Weekly/Monthly levels
Session open notifications
Performance:
Auto-cleanup of old lines/labels
Efficient drawing to prevent chart clutter
Modular design for easy customization
How to Use:
Add the indicator to your chart
Configure session times in the "Session Times (NY)" group
Enable/disable levels in the settings
Customize colors and styles to match your preference
Set up alerts for key level breaks
Perfect for:
ICT traders identifying liquidity zones
Session-based trading strategies
Multi-timeframe analysis
Identifying key support/resistance levels
Note: This indicator uses NY timezone for session calculations. Adjust session times in the settings to match your trading hours.
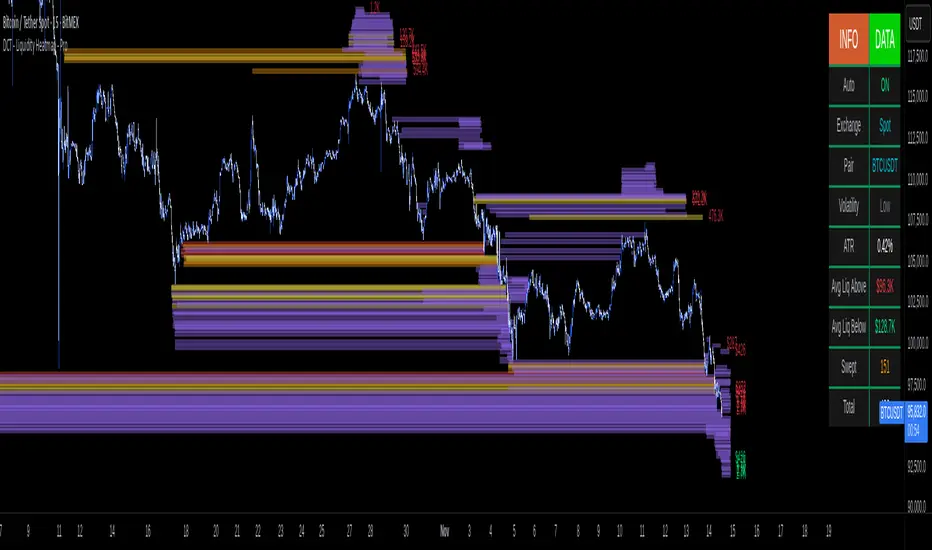
DCT - Liquidity Heatmap - ProOVERVIEW
This indicator visualizes liquidity levels by analyzing volume intensity, order flow structure, and price interaction. It highlights areas where buy-side and sell-side liquidity builds up, showing potential zones of interest.
WHAT IT DOES
- Detects buy-side and sell-side liquidity levels
- Tracks swept zones
- Displays volume intensity using a color-graded system
- Optional CVD mode showing directional volume bias
- Adapts automatically to different market types and volatility states
- Extends active levels forward
- Cleans up old data automatically
- Includes optional alert conditions
KEY FEATURES
- Automatic market and volatility identification
- Smart spacing and level management
- Optional CVD tracking
- Forward level projection
- Swept level preservation
- Imbalance markers
- Real-time info table with liquidity stats, volatility state, and level counts
- Memory-optimized handling for long charts
IMPORTANT NOTES
- Not a predictive tool
- Not a standalone trading system
- Effectiveness varies by timeframe and data quality
- Optimized for crypto markets
- Historical visualization shows past detected levels
HOW TO USE
- Add indicator to your chart
- Adjust spacing to widen or tighten clusters
- Enable CVD if directional pressure is needed
- Configure alerts if desired
- Use Compact mode on smaller screens
TECHNICAL DETAILS
- Pine v6
- Overlay: true
- Max boxes: 500
- Memory optimized
- Works on Perpetual and Spot crypto markets
DISCLAIMER
For analysis and educational use only. No financial advice. Markets can behave unpredictably. Use your own judgment and risk management.
[AutoZone_mrkim]- Use wisely
- The indicator will automatically draw the Order Block zone for each timeframe
- It will change color if a zone is broken out
- Each timeframe will have different zone levels depending on the timeframe used

Liquidity Void Detector + Pro SignalsWhat This Indicator Does
This indicator detects “liquidity voids”—large displacement candles with very high body-to-wick ratios and size significantly above recent ATR—where price moved rapidly and left untested areas.
It automatically draws shaded boxes for new, non-overlapping voids, shows a moveable dashboard (void fill probabilities), and provides one clean, actionable long/short signal per void when price action and momentum confirm.
How It Works
Void Detection: Candles with a body/wick ratio and size above user threshold trigger a potential liquidity void.
Box Drawing: Each new void is drawn as a shaded box (yellow/orange) that never overlaps other active voids.
Signal Confirmation: A “LONG” or “SHORT” label appears at the first bar within each valid void if momentum and candlestick structure align.
Dashboard: User-selectable dashboard shows up-to-date stats on remaining unfilled, partially filled, and fully filled voids.
Alerts: Built-in alerts fire when a new high-probability long/short signal is detected (user must add alerts manually).
Key Features
No overlap, no clutter: Only the latest set of boxes and a single signal per event are drawn. Oldest boxes are pruned automatically.
Momentum filter: Signals combine void and trend strength for higher conviction, filtering out weak/fake moves.
Non-repainting: Signals, boxes, and logic only use confirmed bar data—no repaint or future leaks.
Adjustable settings: Every threshold (body/wick ratio, ATR size, maximum boxes, dashboard location, signal label size) is user-configurable.
Efficient for all timeframes and asset classes.
How to Use
Add to your chart:
Click "Add to Chart" or search “Liquidity Void Detector” in the indicator search panel.
Tune your inputs:
Adjust the Body/Wick Ratio and Min Size vs ATR for your market or timeframe.
Set the Void Box Length (how many bars the box displays), signal sensitivity, and maximum concurrent voids.
Move the dashboard as needed for your chart layout.
What to look for:
Yellow/orange boxes highlight recent liquidity voids—untested price gaps where future reactions may occur.
LONG/SHORT signals appear only where a fresh void coincides with confirmed momentum in that direction.
Dashboard tracks probability of voids remaining unfilled, being partially filled, or fully refilled by price.
Trading logic and best use:
Traders may use void boxes to anticipate where price might react, reverse, or trend continuation can resume.
Combine signals with additional price action confirmation such as S/R levels, order blocks, wick rejections, volume spikes, or patterns (e.g., pin bars, engulfing).
Use signal alerts in conjunction with order flow, session profile, or support/resistance tools for increased confluence.
Always backtest and demo trade before live use.
Important Compliance & Disclaimer
No advice: This tool provides visual context only. All trading and risk decisions are the user’s responsibility.
No repainting, original source: The code is fully open-source, uses only native Pine Script, and never repaints.
No spam, no links, no 3rd-party promotion: 100% TradingView House Rules compliant.
If you find this useful, please consider leaving a positive review, and remember to always confirm with your own analysis.
