QuantMotions - TPR Sentinel LineTPR Sentinel Line is an advanced adaptive Support/Resistance system that combines multi-layered trend analysis with a directional Time-Price Ratio (TPR) engine. The indicator dynamically builds a stabilized support or resistance line that adjusts to market volatility, trend strength, ATR expansion and contraction, and real-time slope changes.
This creates a high-precision, self-adjusting trend barrier that acts as support in uptrends, resistance in downtrends, and a neutral anchor during sideways phases.
Key Features
✔ Adaptive Trend Base
- A composite trend model blending:
- Kijun-style midpoint
- Donchian midline
- SMA & EMA smoothing
This creates a stable baseline that reacts smoothly but reliably to structural trend shifts.
✔ Directional TPR Calculation
The indicator measures slope across short, medium, and long trend windows, normalizes it with ATR, and determines:
- Trend direction
- Trend strength
- Momentum quality
✔ Dynamic Support/Resistance Line
Depending on trend direction:
- In uptrends → the line becomes adaptive support
- In downtrends → the line becomes adaptive resistance
- In neutral phases → the line centers around the smoothed trend base
A built-in lag factor prevents unrealistic jumps and keeps the level stable.
✔ Automatic Support/Resistance Zones
The indicator expands the main line into upper and lower zones based on ATR and trend strength, creating a dynamic volatility envelope around the trend structure.
✔ Signals & Alerts
- Support bounce
- Resistance rejection
- Breakouts above/below the dynamic line
These events help identify high-probability continuation or reversal moments.
✔ Information Panel
A real-time status table displays:
- Trend direction
- Trend strength
- Current S/R level
🎯 Ideal For
- Precision entries on pullbacks
- Detecting trend shifts earlier
- Identifying strong or weak trend phases
- Adaptive take-profit and stop-loss zones
- Filtering false breakouts
💡 Summary
TPR Sentinel Line gives you a living, breathing support/resistance structure that evolves with the market.
Instead of relying on static levels, you get a continuously adapting trend barrier that reflects real strength, real volatility, and real momentum.
A powerful tool for traders who want structure, clarity, and trend confidence.
Supportresistace

Volume Profile Grid [Alpha Extract]A sophisticated volume distribution analysis system that transforms market activity into institutional-grade visual profiles, revealing hidden support/resistance zones and market participant behavior. Utilizing advanced price level segmentation, bullish/bearish volume separation, and dynamic range analysis, the Volume Profile Grid delivers comprehensive market structure insights with Point of Control (POC) identification, Value Area boundaries, and volume delta analysis. The system features intelligent visualization modes, real-time sentiment analysis, and flexible range selection to provide traders with clear, actionable volume-based market context.
🔶 Dynamic Range Analysis Engine
Implements dual-mode range selection with visible chart analysis and fixed period lookback, automatically adjusting to current market view or analyzing specified historical periods. The system intelligently calculates optimal bar counts while maintaining performance through configurable maximum limits, ensuring responsive profile generation across all timeframes with institutional-grade precision.
// Dynamic period calculation with intelligent caching
get_analysis_period() =>
if i_use_visible_range
chart_start_time = chart.left_visible_bar_time
current_time = last_bar_time
time_span = current_time - chart_start_time
tf_seconds = timeframe.in_seconds()
estimated_bars = time_span / (tf_seconds * 1000)
range_bars = math.floor(estimated_bars)
final_bars = math.min(range_bars, i_max_visible_bars)
math.max(final_bars, 50) // Minimum threshold
else
math.max(i_periods, 50)
🔶 Advanced Bull/Bear Volume Separation
Employs sophisticated candle classification algorithms to separate bullish and bearish volume at each price level, with weighted distribution based on bar intersection ratios. The system analyzes open/close relationships to determine volume direction, applying proportional allocation for doji patterns and ensuring accurate representation of buying versus selling pressure across the entire price spectrum.
🔶 Multi-Mode Volume Visualization
Features three distinct display modes for bull/bear volume representation: Split mode creates mirrored profiles from a central axis, Side by Side mode displays sequential bull/bear segments, and Stacked mode separates volumes vertically. Each mode offers unique insights into market participant behavior with customizable width, thickness, and color parameters for optimal visual clarity.
// Bull/Bear volume calculation with weighted distribution
for bar_offset = 0 to actual_periods - 1
bar_high = high
bar_low = low
bar_volume = volume
// Calculate intersection weight
weight = math.min(bar_high, next_level) - math.max(bar_low, current_level)
weight := weight / (bar_high - bar_low)
weighted_volume = bar_volume * weight
// Classify volume direction
if bar_close > bar_open
level_bull_volume += weighted_volume
else if bar_close < bar_open
level_bear_volume += weighted_volume
else // Doji handling
level_bull_volume += weighted_volume * 0.5
level_bear_volume += weighted_volume * 0.5
🔶 Point of Control & Value Area Detection
Implements institutional-standard POC identification by locating the price level with maximum volume accumulation, providing critical support/resistance zones. The Value Area calculation uses sophisticated sorting algorithms to identify the price range containing 70% of trading volume, revealing the market's accepted value zone where institutional participants concentrate their activity.
🔶 Volume Delta Analysis System
Incorporates real-time volume delta calculation with configurable dominance thresholds to identify significant bull/bear imbalances. The system visually highlights price levels where buying or selling pressure exceeds threshold percentages, providing immediate insight into directional volume flow and potential reversal zones through color-coded delta indicators.
// Value Area calculation using 70% volume accumulation
total_volume_sum = array.sum(total_volumes)
target_volume = total_volume_sum * 0.70
// Sort volumes to find highest activity zones
for i = 0 to array.size(sorted_volumes) - 2
for j = i + 1 to array.size(sorted_volumes) - 1
if array.get(sorted_volumes, j) > array.get(sorted_volumes, i)
// Swap and track indices for value area boundaries
// Accumulate until 70% threshold reached
for i = 0 to array.size(sorted_indices) - 1
accumulated_volume += vol
array.push(va_levels, array.get(volume_levels, idx))
if accumulated_volume >= target_volume
break
❓How It Works
🔶 Weighted Volume Distribution
Implements proportional volume allocation based on the percentage of each bar that intersects with price levels. When a bar spans multiple levels, volume is distributed proportionally based on the intersection ratio, ensuring precise representation of trading activity across the entire price spectrum without double-counting or volume loss.
🔶 Real-Time Profile Generation
Profiles regenerate on each bar close when in visible range mode, automatically adapting to chart zoom and scroll actions. The system maintains optimal performance through intelligent caching mechanisms and selective line updates, ensuring smooth operation even with maximum resolution settings and extended analysis periods.
🔶 Market Sentiment Analysis
Features comprehensive volume analysis table displaying total volume metrics, bullish/bearish percentages, and overall market sentiment classification. The system calculates volume dominance ratios in real-time, providing immediate insight into whether buyers or sellers control the current price structure with percentage-based sentiment thresholds.
🔶 Visual Profile Mapping
Provides multi-layered visual feedback through colored volume bars, POC line highlighting, Value Area boundaries, and optional delta indicators. The system supports profile mirroring for alternative perspectives, line extension for future reference, and customizable label positioning with detailed price information at critical levels.
Why Choose Volume Profile Grid
The Volume Profile Grid represents the evolution of volume analysis tools, combining traditional volume profile concepts with modern visualization techniques and intelligent analysis algorithms. By integrating dynamic range selection, sophisticated bull/bear separation, and multi-mode visualization with POC/Value Area detection, it provides traders with institutional-quality market structure analysis that adapts to any trading style. The comprehensive delta analysis and sentiment monitoring system eliminates guesswork while the flexible visualization options ensure optimal clarity across all market conditions, making it an essential tool for traders seeking to understand true market dynamics through volume-based price discovery.

Multi Pivot Point & Central Pivot Range - Nadeem Al-QahwiThis indicator combines four advanced trading modules into one flexible and easy-to-use script:
Traditional Pivot Points:
Calculates classic support and resistance levels (PP, R1–R5, S1–S5) based on previous session data. Ideal for identifying key turning points and mapping out the daily, weekly, or monthly structure.
Camarilla Levels:
Provides six upper and lower pivot levels (H1–H6, L1–L6) derived from volatility and closing price formulas. Especially effective for intraday reversal, mean reversion, and finding overbought/oversold extremes.
Central Pivot Range (CPR):
Plots the median, top, and bottom of the value area each session. CPR width instantly highlights whether the market is likely to trend (narrow CPR) or remain range-bound (wide CPR).
Developing CPR projects the evolving range for the current period—essential for real-time analysis and pre-market planning.
Dynamic Zone Levels (DZL):
Automatically detects and highlights clusters of pivots to reveal high-probability support/resistance zones, filtering out market “noise.”
DZL alerts notify you whenever price breaks or retests these key areas, making it easier to spot momentum trades and avoid false signals.
Key Features:
Multi-timeframe flexibility: Use with daily, weekly, monthly, yearly, or custom timeframes—even rare ones like biyearly and decennial.
Modular design: Activate or hide any system (Traditional, Camarilla, CPR, DZL) as you need.
Bilingual interface: Every setting and label is shown in both English and Arabic.
Full customization: Control visibility, color, style, and placement for every level and label.
Historical depth: Plot up to 5,000 pivot/zones back for deep analysis and backtesting.
Smart alerts: Get instant notifications on true S/R breakouts or retests (from DZL).
How to Use:
Trend Trading:
Watch for a very narrow CPR to identify potential trending days—trade in the breakout direction above/below the CPR.
Range Trading:
When CPR is wide, expect sideways movement. Fade reversals at R1/S1 or within the CPR boundaries.
Breakouts:
Use DZL alerts to capture momentum as price breaks or retests dynamic support/resistance zones.
Multi-Timeframe Confluence:
Combine CPR and pivot levels from multiple timeframes for higher-probability entries and exits.
All calculations and logic are fully open.

52SIGNAL RECIPE CME Gap Support & Resistance Detector═══ 52SIGNAL RECIPE CME Gap Support & Resistance Detector ═══
◆ Overview
The 52SIGNAL RECIPE CME Gap Support & Resistance Detector is an advanced technical indicator that automatically detects and visualizes all types of price gaps occurring in the CME Bitcoin futures market on trading charts. It captures not only gaps formed during weekend and holiday closures, but also those created during the daily 1-hour maintenance period on weekdays, and sudden price gaps resulting from economic indicator releases or news events.
The core value of this indicator lies beyond simply displaying gaps; it visualizes how these price discontinuities act as powerful support and resistance zones that influence future price movements. In real markets, these CME gaps have a high probability of either being "filled" or functioning as important reaction zones, providing traders with valuable entry and exit signals.
─────────────────────────────────────
◆ Key Features
• Comprehensive Gap Detection: Detects gaps in all market conditions
- Weekend/holiday closure gaps
- Weekday 1-hour maintenance period gaps
- Gaps from economic indicators/news events causing rapid price changes
• Intuitive Color Coding:
- Blue: When gaps act as support (price is above the gap)
- Red: When gaps act as resistance (price is below the gap)
- Gray: Filled gaps (price has completely passed through the gap area)
• Real-time Role Switching: Automatically changes colors as price moves above/below gaps, visualizing support↔resistance role transitions
• Status Tracking System: Automatically tracks whether gaps are "Filled" or "Unfilled"
• Dynamic Boxes: Clearly marks gap areas with boxes and dynamically changes colors based on price movement
• Precise Labeling: Accurately displays the price range of each gap to support trader decision-making
• Smart Filtering: Improved algorithm that solves consecutive gap detection issues for complete gap tracking
• Key Usage Points:
- Pay special attention when price approaches gap areas
- Color changes in gaps signal important market sentiment shifts
- Areas with multiple clustered gaps are particularly strong reaction zones
─────────────────────────────────────
◆ User Guide: Understanding Gap Roles Through Colors
■ Color System Interpretation
• Blue Gaps (Support Role):
▶ Meaning: Current price is above the gap, making the gap act as support
▶ Trading Application: Consider buying opportunities when price approaches blue gap areas
▶ Psychological Meaning: Buying pressure likely to increase at this price level
• Red Gaps (Resistance Role):
▶ Meaning: Current price is below the gap, making the gap act as resistance
▶ Trading Application: Consider selling opportunities when price approaches red gap areas
▶ Psychological Meaning: Selling pressure likely to increase at this price level
• Gray Gaps (Filled Gaps):
▶ Meaning: Price has completely passed through the gap area, filling the gap
▶ Reference Value: Still valuable as reference for past important reaction zones
▶ Trading Application: Used to confirm trend strength and identify key psychological levels
■ Understanding Color Transitions
• Blue → Red Transition:
▶ Meaning: Price has fallen below the gap, changing its role from support to resistance
▶ Market Interpretation: Breakdown of previous support strengthens bearish signals
▶ Trading Application: Consider potential further decline; check gap bottom as resistance during bounces
• Red → Blue Transition:
▶ Meaning: Price has risen above the gap, changing its role from resistance to support
▶ Market Interpretation: Breakout above previous resistance strengthens bullish signals
▶ Trading Application: Consider potential further rise; check gap top as support during pullbacks
─────────────────────────────────────
◆ Practical Application Guide
■ Basic Trading Scenarios
• Blue Gap Support Strategy:
▶ Entry Point: When price approaches the top of a blue gap and forms a bounce candle
▶ Stop Loss: Below the gap bottom (if price completely breaks down through the gap)
▶ Take Profit: Previous swing high or next resistance level above
▶ Probability Enhancers: Gap aligned with major moving averages, oversold RSI, strong bounce candle pattern
• Red Gap Resistance Strategy:
▶ Entry Point: When price approaches the bottom of a red gap and forms a rejection candle
▶ Stop Loss: Above the gap top (if price completely breaks up through the gap)
▶ Take Profit: Previous swing low or next support level below
▶ Probability Enhancers: Gap aligned with major moving averages, overbought RSI, strong rejection candle pattern
■ Advanced Pattern Applications
• Multiple Gap Cluster Identification:
▶ Several gaps in close price proximity form extremely powerful support/resistance zones
▶ Same-color gap clusters: Very strong single-direction reaction zones
▶ Mixed-color gap clusters: High volatility zones with bidirectional reactions expected
• Gap Sequence Analysis:
▶ Consecutive same-direction gaps: Strong trend confirmation signal
▶ Increasing gap size pattern: Trend acceleration signal
▶ Decreasing gap size pattern: Trend weakening signal
• News/Indicator Release Gap Utilization:
▶ Gaps formed immediately after economic indicators: Measure market shock intensity
▶ Gap color change observation: Track market reinterpretation of news
▶ Gap filling speed analysis: Evaluate news impact duration
• Key Attention Points:
▶ Pay special attention to the chart whenever price approaches gap areas
▶ Gap color changes signal important market sentiment shifts
▶ Areas with multiple concentrated gaps are likely to show strong price reactions
─────────────────────────────────────
◆ Technical Foundation
■ CME Gap Formation Principles
• Key Gap Formation Scenarios:
▶ Weekend Closures (Friday close → Monday open): Most common CME gap formation point
▶ Holiday Closures: Gaps occurring due to CME closures on US holidays
▶ Weekday 1-hour Maintenance: Gaps during daily CME maintenance period (16:00-17:00 CT)
▶ Major Economic Indicator Releases: Gaps from rapid price changes during US employment reports, FOMC decisions, CPI releases, etc.
▶ Significant News Events: Gaps from regulatory announcements, geopolitical events, market shocks, etc.
• Psychological Importance of Gaps:
▶ Zones where price formation did not occur, representing imbalance between buying/selling forces
▶ Gap areas have no actual trading, resulting in accumulated potential orders
▶ Reflect institutional investor positions and liquidity distribution in the CME futures market
■ Support/Resistance Mechanism
• Psychological Level Formation Mechanism:
▶ Unexecuted order accumulation in gap areas: Loss of ordering opportunity at those price levels
▶ Liquidity imbalance: No trading occurred in gap areas, creating liquidity voids
▶ Institutional activity: Institutional participants in CME futures markets pay attention to these gap areas
• Evidence of Support/Resistance Function:
▶ Statistical gap fill phenomenon: Most gaps eventually "fill" (price returns to gap area)
▶ Gap-based reactions: Increased frequency of price reactions (bounces/rejections) when reaching gap areas
▶ Market psychology impact: Influences traders' perceived value and fair price assessment
─────────────────────────────────────
◆ Advanced Configuration Options
■ Visualization Settings
• Show Gap Labels (Default: On)
▶ On: Displays price ranges of each gap numerically for precise support/resistance level identification
▶ Off: Hides labels for visual cleanliness
• Color Settings
▶ Filled Gap Color: Gray tones, shows gaps already traversed by price
▶ Unfilled Gap Color - Support: Blue, shows gaps currently acting as support
▶ Unfilled Gap Color - Resistance: Red, shows gaps currently acting as resistance
■ Data Management Settings
• Filled Gap Storage Limit (Default: 10)
▶ Sets maximum number of filled gaps to retain on chart
▶ Recommended settings: Short-term traders (5-8), Swing traders (8-12), Position traders (10-15)
• Maximum Gap Retention Period (Default: 12 months)
▶ Sets period after which old unfilled gaps are automatically removed
▶ Recommended settings: Short-term analysis (3-6 months), Medium-term analysis (6-12 months), Long-term analysis (12-24 months)
─────────────────────────────────────
◆ Synergy with Other Indicators
• Volume Profile: Greatly increased reaction probability when CME gaps align with Volume Profile value areas
• Fibonacci Retracements: Formation of powerful reaction zones when major Fibonacci levels coincide with gap areas
• Moving Averages: Areas where major moving averages overlap with CME gaps act as "composite support/resistance"
• Horizontal Support/Resistance: Very strong price reactions expected when historical key price levels align with CME gaps
• Market Sentiment Indicators (RSI/MACD): Assess reaction probability by checking oversold/overbought conditions when price approaches gap areas
─────────────────────────────────────
◆ Conclusion
The 52SIGNAL RECIPE CME Gap Support & Resistance Detector is not merely a gap display tool, but an advanced analytical tool that visualizes important support/resistance areas where price may strongly react, using intuitive color codes (blue=support, red=resistance). It detects all types of gaps without omission, whether from weekend and holiday closures, weekday 1-hour maintenance periods, important economic indicator releases, or market shock situations.
The core value of this indicator lies in clearly expressing through intuitive color coding that gaps are not simple price discontinuities, but psychological support/resistance areas that significantly influence future price action. Traders can instantly identify areas where blue gaps act as support and red gaps act as resistance, enabling quick and effective decision-making.
By referencing the color codes when price approaches gap areas to predict possible price reactions, and especially interpreting color transition moments (blue→red or red→blue) as signals of important market sentiment changes and integrating them into trading strategies, traders can capture higher-probability trading opportunities.
─────────────────────────────────────
※ Disclaimer: Like all trading tools, the CME Gap Detector should be used as a supplementary indicator and not relied upon alone for trading decisions. Past gap reaction patterns cannot guarantee the same behavior in the future. Always use appropriate risk management strategies.
═══ 52SIGNAL RECIPE CME Gap Support & Resistance Detector ═══
◆ 개요
52SIGNAL RECIPE CME Gap Support & Resistance Detector는 CME 비트코인 선물 시장에서 발생하는 모든 유형의 가격 갭(Gap)을 자동으로 감지하여 트레이딩 차트에 시각화하는 고급 기술적 지표입니다. 주말과 공휴일 휴장은 물론, 평일 1시간 휴장 시간, 그리고 중요 경제지표 발표나 뉴스 이벤트 시 발생하는 급격한 가격 갭까지 누락 없이 포착합니다.
이 인디케이터의 핵심 가치는 단순히 갭을 표시하는 것을 넘어, 이러한 가격 불연속성이 미래 가격 움직임에 영향을 미치는 강력한 지지(Support)와 저항(Resistance) 영역으로 작용한다는 원리를 시각화하는 데 있습니다. 실제 시장에서 이러한 CME 갭은 높은 확률로 미래에 "매꿔지거나" 중요한 반응 구간으로 기능하여 트레이더에게 귀중한 진입/퇴출 신호를 제공합니다.
─────────────────────────────────────
◆ 주요 특징
• 전방위 갭 감지: 모든 시장 조건에서 발생하는 갭을 감지
- 주말/공휴일 휴장 갭
- 평일 1시간 휴장 시간 갭
- 경제지표/뉴스 이벤트 시 급격한 가격 변동 갭
• 직관적 색상 구분:
- 파란색: 갭이 지지 역할을 할 때(가격이 갭 위에 있을 때)
- 빨간색: 갭이 저항 역할을 할 때(가격이 갭 아래에 있을 때)
- 회색: 이미 매꿔진 갭(가격이 갭 영역을 완전히 통과)
• 실시간 역할 전환: 가격이 갭 위/아래로 이동함에 따라 지지↔저항 역할 전환을 자동으로 색상 변경으로 시각화
• 상태 추적 시스템: 갭이 "매꿔짐(Filled)" 또는 "매꿔지지 않음(Unfilled)" 상태를 자동 추적
• 다이나믹 박스: 갭 영역을 명확한 박스로 표시하고 가격 움직임에 따라 동적으로 색상 변경
• 정밀 레이블링: 각 갭의 가격 범위를 정확히 표시하여 트레이더의 의사결정 지원
• 스마트 필터링: 연속적 갭 감지 문제를 해결하는 개선된 알고리즘으로 누락 없는 갭 추적
• 핵심 활용 포인트:
- 가격이 갭 영역에 접근할 때 특별히 주목하세요
- 갭 색상 변경 시점은 중요한 시장 심리 변화 신호입니다
- 여러 갭이 밀집된 영역은 특히 강한 반응이 예상되는 구간입니다
─────────────────────────────────────
◆ 사용 가이드: 색상으로 이해하는 갭 역할
■ 색상 시스템 해석법
• 파란색 갭 (지지 역할):
▶ 의미: 현재 가격이 갭 위에 있어 갭이 지지선으로 작용
▶ 트레이딩 응용: 가격이 파란색 갭 영역으로 하락 접근 시 매수 기회 고려
▶ 심리적 의미: 매수세력이 이 가격대에서 수요 증가 가능성
• 빨간색 갭 (저항 역할):
▶ 의미: 현재 가격이 갭 아래에 있어 갭이 저항선으로 작용
▶ 트레이딩 응용: 가격이 빨간색 갭 영역으로 상승 접근 시 매도 기회 고려
▶ 심리적 의미: 매도세력이 이 가격대에서 공급 증가 가능성
• 회색 갭 (매꿔진 갭):
▶ 의미: 가격이 갭 영역을 완전히 통과하여 갭이 매꿔진 상태
▶ 참조 가치: 과거 중요 반응 구간으로 여전히 참고 가치 있음
▶ 트레이딩 응용: 추세 강도 확인 및 주요 심리적 레벨 식별에 활용
■ 색상 전환 이해하기
• 파란색 → 빨간색 전환:
▶ 의미: 가격이 갭 아래로 하락하여 갭이 지지에서 저항으로 역할 변경
▶ 시장 해석: 이전 지지선 붕괴로 약세 신호 강화
▶ 트레이딩 응용: 추가 하락 가능성 고려, 반등 시 갭 하단 저항 확인
• 빨간색 → 파란색 전환:
▶ 의미: 가격이 갭 위로 상승하여 갭이 저항에서 지지로 역할 변경
▶ 시장 해석: 이전 저항선 돌파로 강세 신호 강화
▶ 트레이딩 응용: 추가 상승 가능성 고려, 조정 시 갭 상단 지지 확인
─────────────────────────────────────
◆ 실전 활용 가이드
■ 기본 트레이딩 시나리오
• 파란색 갭 지지 전략:
▶ 진입 시점: 가격이 파란색 갭 상단에 접근하여 반등 캔들 형성 시
▶ 손절 위치: 갭 하단 아래(갭 완전히 하향 돌파 시)
▶ 이익실현: 이전 스윙 고점 또는 상방 다음 저항선
▶ 확률 증가 조건: 갭과 주요 이동평균선 일치, 과매도 RSI, 강한 반등 캔들
• 빨간색 갭 저항 전략:
▶ 진입 시점: 가격이 빨간색 갭 하단에 접근하여 거부 캔들 형성 시
▶ 손절 위치: 갭 상단 위(갭 완전히 상향 돌파 시)
▶ 이익실현: 이전 스윙 저점 또는 하방 다음 지지선
▶ 확률 증가 조건: 갭과 주요 이동평균선 일치, 과매수 RSI, 강한 거부 캔들
■ 고급 패턴 활용법
• 다중 갭 클러스터 식별:
▶ 여러 갭이 근접한 가격대에 있다면 더욱 강력한 지지/저항 존
▶ 동일 색상 갭 클러스터: 매우 강력한 단일 방향 반응 구간
▶ 색상 혼합 갭 클러스터: 심한 변동성과 양방향 반응 예상 구간
• 갭 시퀀스 분석:
▶ 연속적인 동일 방향 갭: 강한 추세 확인 신호
▶ 갭 크기 증가 패턴: 추세 가속화 신호
▶ 갭 크기 감소 패턴: 추세 약화 신호
• 뉴스/지표 발표 후 갭 활용:
▶ 경제지표 발표 직후 형성된 갭: 시장 충격 강도 측정
▶ 갭 색상 변화 관찰: 시장의 뉴스 재해석 과정 파악
▶ 갭 매꿈 속도 분석: 뉴스 임팩트의 지속성 평가
• 핵심 주목 포인트:
▶ 가격이 갭 영역에 접근할 때마다 차트를 특별히 주목하세요
▶ 갭 색상이 변경되는 시점은 중요한 시장 심리 변화를 의미합니다
▶ 여러 갭이 밀집된 영역은 가격이 강하게 반응할 가능성이 높습니다
─────────────────────────────────────
◆ 기술적 기반
■ CME 갭의 발생 원리
• 주요 갭 발생 상황:
▶ 주말 휴장 (금요일 종가 → 월요일 시가): 가장 일반적인 CME 갭 형성 시점
▶ 공휴일 휴장: 미국 공휴일에 따른 CME 휴장 시 발생
▶ 평일 1시간 휴장: CME 시장의 일일 정비 시간(16:00~17:00 CT) 동안 발생
▶ 주요 경제지표 발표: 미 고용지표, FOMC 결정, CPI 등 발표 시 급격한 가격 변동으로 인한 갭
▶ 중요 뉴스 이벤트: 규제 발표, 지정학적 이벤트, 시장 충격 등으로 인한 급격한 가격 변화
• 갭의 심리적 중요성:
▶ 가격 형성이 이루어지지 않은 구간으로, 매수/매도 세력의 불균형 영역
▶ 갭 구간에는 실제 거래가 없었기 때문에 잠재적 주문이 누적되는 영역
▶ 기관 투자자들의 선물 포지션과 유동성 분포가 반영된 중요한 가격 레벨
■ 지지/저항으로 작용하는 원리
• 심리적 레벨 형성 메커니즘:
▶ 갭 구간의 미실행 주문 축적: 갭 발생 시 해당 가격대에 대한 주문 기회 상실
▶ 유동성 불균형: 갭 구간에는 거래가 없었으므로 유동성 공백 발생
▶ 기관 투자자 활동: CME 선물 시장의 기관 참여자들은 이러한 갭 영역에 관심
• 지지/저항 작용 증거:
▶ 통계적 갭 필 현상: 대부분의 갭은 미래에 "매꿔짐"(가격이 갭 구간으로 회귀)
▶ 갭 기반 반응: 갭 영역에 도달 시 가격 반응(반등/거부) 발생 빈도 증가
▶ 시장 심리 영향: 트레이더들의 인지된 가치와 공정가격 평가에 영향
─────────────────────────────────────
◆ 고급 설정 옵션
■ 시각화 설정
• 라벨 표시 설정 (Show Gap Labels) (기본값: 켜짐)
▶ 켜짐: 각 갭의 가격 범위를 숫자로 표시하여 정확한 지지/저항 레벨 확인
▶ 꺼짐: 시각적 깔끔함을 위해 라벨 숨김
• 색상 설정
▶ 매꿔진 갭 색상(Filled Gap Color): 회색 계열, 이미 가격이 통과한 갭 표시
▶ 미매꿔진 갭 색상 - 지지(Support): 파란색, 현재 지지 역할을 하는 갭
▶ 미매꿔진 갭 색상 - 저항(Resistance): 빨간색, 현재 저항 역할을 하는 갭
■ 데이터 관리 설정
• 매꿔진 갭 저장 한도 (Filled Gap Storage Limit) (기본값: 10)
▶ 이미 매꿔진 갭을 최대 몇 개까지 차트에 유지할지 설정
▶ 권장 설정: 단기 트레이더(5-8), 스윙 트레이더(8-12), 포지션 트레이더(10-15)
• 최대 갭 보관 기간 (Maximum Gap Retention Period) (기본값: 12개월)
▶ 오래된 미매꿔진 갭을 자동으로 제거하는 기간 설정
▶ 권장 설정: 단기 분석(3-6개월), 중기 분석(6-12개월), 장기 분석(12-24개월)
─────────────────────────────────────
◆ 다른 지표와의 시너지
• 볼륨 프로파일: CME 갭과 볼륨 프로파일의 밸류 영역 일치 시 반응 확률 크게 증가
• 피보나치 리트레이스먼트: 주요 피보나치 레벨과 갭 영역 일치 시 강력한 반응 존 형성
• 이동평균선: 주요 이동평균선과 CME 갭이 겹치는 영역은 "복합 지지/저항"으로 작용
• 수평 지지/저항: 과거 중요 가격대와 CME 갭 일치 시 매우 강력한 가격 반응 예상 가능
• 시장 심리 지표(RSI/MACD): 갭 영역 접근 시 과매수/과매도 확인으로 반응 가능성 판단
─────────────────────────────────────
◆ 결론
52SIGNAL RECIPE CME Gap Support & Resistance Detector는 단순한 갭 표시 도구가 아닌, 가격이 강하게 반응할 수 있는 중요한 지지/저항 영역을 직관적인 색상 코드(파란색=지지, 빨간색=저항)로 시각화하는 고급 분석 도구입니다. 주말과 공휴일 휴장 시간뿐만 아니라, 평일 1시간 휴장 시간, 중요 경제지표 발표, 그리고 시장 충격 상황에서 발생하는 모든 유형의 갭을 누락 없이 감지합니다.
인디케이터의 핵심 가치는 갭이 단순한 가격 불연속성이 아닌, 미래 가격 행동에 중요한 영향을 미치는 심리적 지지/저항 영역임을 직관적인 색상 코드로 명확히 표현하는 데 있습니다. 파란색 갭은 지지 역할을, 빨간색 갭은 저항 역할을 하는 영역을 즉각적으로 식별할 수 있어 트레이더가 빠르고 효과적인 의사결정을 내릴 수 있도록 도와줍니다.
갭 영역에 접근할 때마다 색상 코드를 참고하여 가능한 가격 반응을 예측하고, 특히 색상 전환이 일어나는 순간(파란색→빨간색 또는 빨간색→파란색)은 중요한 시장 심리 변화 신호로 해석하여 트레이딩 전략에 통합한다면, 더 높은 확률의 거래 기회를 포착할 수 있을 것입니다.
─────────────────────────────────────
※ 면책 조항: 모든 트레이딩 도구와 마찬가지로, CME Gap Detector는 보조 지표로 사용되어야 하며 단독으로 거래 결정을 내리는 데 사용해서는 안 됩니다. 과거의 갭 반응 패턴이 미래에도 동일하게 작용한다고 보장할 수 없습니다. 항상 적절한 리스크 관리 전략을 사용하세요.

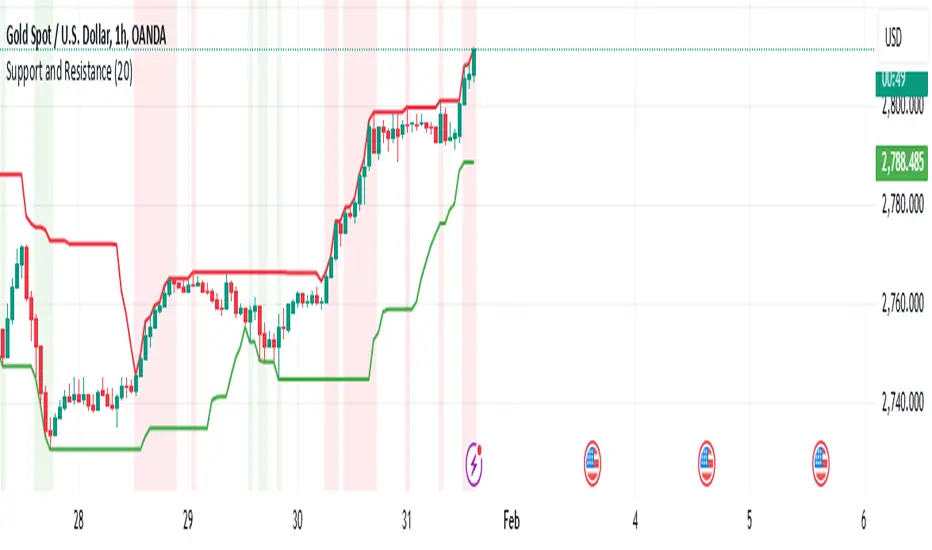
Support and Resistancelookback: This input allows you to specify the number of bars to look back to calculate the support and resistance levels.
support: This is calculated as the lowest low over the specified lookback period.
resistance: This is calculated as the highest high over the specified lookback period.
plot: The support and resistance levels are plotted on the chart with different colors.
bgcolor: This optional feature highlights the support and resistance zones with a semi-transparent background color.
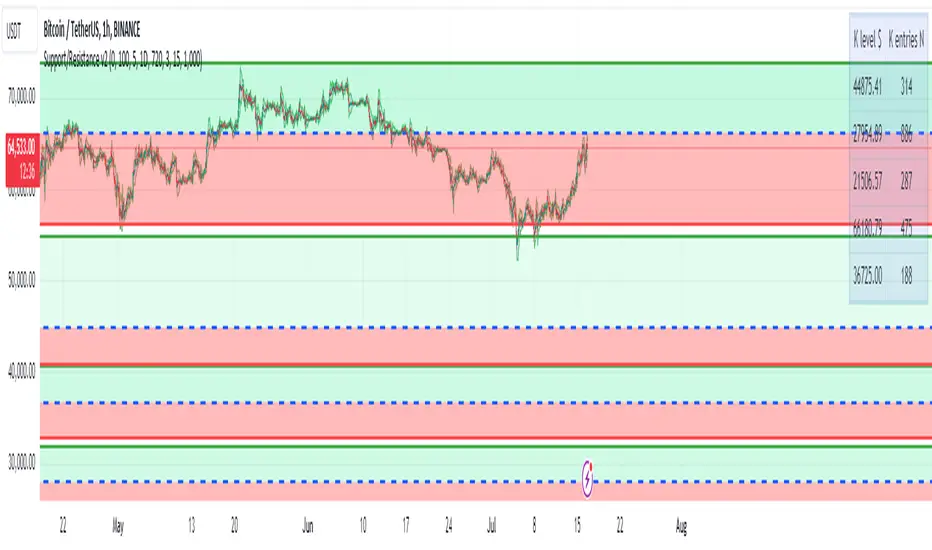
Support/Resistance v2 (ML) KmeanKmean with Standard Deviation Channel
1. Description of Kmean
Kmean (or K-means) is a popular clustering algorithm used to divide data into K groups based on their similarity. In the context of financial markets, Kmean can be applied to find the average price values over a specific period, allowing the identification of major trends and levels of support and resistance.
2. Application in Trading
In trading, Kmean is used to smooth out the price series and determine long-term trends. This helps traders make more informed decisions by avoiding noise and short-term fluctuations. Kmean can serve as a baseline around which other analytical tools, such as channels and bands, are constructed.
3. Description of Standard Deviation (stdev)
Standard deviation (stdev) is a statistical measure that indicates how much the values of data deviate from their mean value. In finance, standard deviation is often used to assess price volatility. A high standard deviation indicates strong price fluctuations, while a low standard deviation indicates stable movements.
4. Combining Kmean and Standard Deviation to Predict Short-Term Price Behavior
Combining Kmean and standard deviation creates a powerful tool for analyzing market conditions. Kmean shows the average price trend, while the standard deviation channels demonstrate the boundaries within which the price can fluctuate. This combination helps traders to:
Identify support and resistance levels.
Predict potential price reversals.
Assess risks and set stop-losses and take-profits.
Should you have any questions about code, please reach me at Tradingview directly.
Hope you find this script helpful!
Volume Profile with Node Detection [LuxAlgo]The Volume Profile with Node Detection is a charting tool that allows visualizing the distribution of traded volume across specific price levels and highlights significant volume nodes or clusters of volume nodes that traders may find relevant in utilizing in their trading strategies.
🔶 USAGE
The volume profile component of the script serves as the foundation for node detection while encompassing all the essential features expected from a volume profile. See the sub-sections below for more detailed information about the indicator components and their usage.
🔹 Peak Volume Node Detection
A volume peak node is identified when the volume profile nodes for the N preceding and N succeeding nodes are lower than that of the evaluated one.
Displaying peak volume nodes along with their surrounding N nodes (Zones or Clusters) helps visualize the range, typically representing consolidation zones in the market. This feature enables traders to identify areas where trading activity has intensified, potentially signaling periods of price consolidation or indecision among market participants.
🔹 Trough Volume Node Detection
A volume trough node is identified when the volume profile nodes for the N preceding and N succeeding nodes are higher than that of the evaluated one.
🔹 Highest and Lowest Volume Nodes
Both the highest and lowest volume areas play significant roles in trading. The highest volume areas typically represent zones of strong price acceptance, where a significant amount of trading activity has occurred. On the other hand, the lowest volume areas signify price levels with minimal trading activity, often indicating zones of price rejection or areas where market participants have shown less interest.
🔹 Volume profile
Volume profile is calculated based on the volume of trades that occur at various price levels within a specified timeframe. It divides the price range into discrete price intervals, typically known as "price buckets" or "price bars," and then calculates the total volume of trades that occur at each price level within those intervals. This information is then presented graphically as a histogram or profile, where the height of each bar represents the volume of trades that occurred at that particular price level.
🔶 SETTINGS
🔹 Volume Nodes
Volume Peaks: Toggles the visibility of either the "Peaks" or "Clusters" on the chart, depending on the specified percentage for detection.
Node Detection Percent %: Specifies the percentage for the Volume Peaks calculation.
Volume Troughs: Toggles the visibility of either the "Troughs" or "Clusters" on the chart, depending on the specified percentage for detection.
Node Detection Percent %: Specifies the percentage for the Volume Troughs calculation.
Volume Node Threshold %: A threshold value specified as a percentage is utilized to detect peak/trough volume nodes. If a value is set, the detection will disregard volume node values lower than the specified threshold.
Highest Volume Nodes: Toggles the visibility of the highest nodes for the specified count.
Lowest Volume Nodes: Toggles the visibility of the lowest nodes for the specified count.
🔹 Volume Profile - Components
Volume Profile: Toggles the visibility of the volume profile with either classical display or gradient display.
Value Area Up / Down: Color customization option for the volume nodes within the value area of the profile.
Profile Up / Down Volume: Color customization option for the volume nodes outside of the value area of the profile.
Point of Control: Toggles the visibility of the point of control, allowing selection between "developing" or "regular" modes. Sets the color and width of the point of control line accordingly.
Value Area High (VAH): Toggles the visibility of the value area high level and allows customization of the line color.
Value Area Low (VAL): Toggles the visibility of the value area low level and allows customization of the line color.
Profile Price Labels: Toggles the visibility of the Profile Price Levels and allows customization of the text size of the levels.
🔹 Volume Profile - Display Settings
Profile Lookback Length: Specifies the length of the profile lookback period.
Value Area (%): Specifies the percentage for calculating the value area.
Profile Placement: Specify where to display the profile.
Profile Number of Rows: Specify the number of rows the profile will have.
Profile Width %: Adjusts the width of the rows in the profile relative to the profile range.
Profile Horizontal Offset: Adjusts the horizontal offset of the profile when it is selected to be displayed on the right side of the chart.
Value Area Background: Toggles the visibility of the value area background and allows customization of the fill color.
Profile Background: Toggles the visibility of the profile background and allows customization of the fill color.
🔶 RELATED SCRIPTS
Supply-Demand-Profiles
Liquidity-Sentiment-Profile
Thanks to our community for recommending this script. For more conceptual scripts and related content, we welcome you to explore by visiting >>> LuxAlgo-Scripts .

Period Value ZonesPeriod Value Zones is designed to help traders understand where current value is being found by splitting the day into 3 key periods based on common reversal times recognized for intraday trading.
By splitting the day into 3 periods, we can more efficiently determine where short-term value lies by using only the data we consider relevant during these periods of time.
> Overview
This indicator is recommended for low timeframe trading during the New York RTH Session.
By only trading within this session, we can ensure that volume and volatility remain fairly consistent.
Within each Period, you will find on the chart:
Value Area Points from Previous period (Value High(VAH)/Value Low(VAL)/Point of Control(POC))
Volume Weighted Average Price (VWAP) Cloud, based on High and Low values during the period.
Value Zone based Potential Reversal Zones.
Additional Displays:
Potential Reversal Detection Signals with Invalidation Levels
Forward Plotted Key Market times.
> Components
• Value Area Points
VAH/VAL/POC are important volume profile points which display where the market has previously held value.
We use these specific levels as support and resistance to confirm direction by monitoring interactions between price and these important levels.
The VAH and VAL lines change colors based on price's interaction with them to confirm whether that level should be regarded as support or resistance.
• VWAP Cloud
VWAP is a common metric used to determine the strength of a trend, and provides a point to look for re-bid & re-offer.
When price breaks out of our Fixed Value zone, VWAP helps us determine further direction.
Also included is VWAP deviation bands, for traders who would prefer to view the standard deviation away from this cloud as well.
• Value Reversal Zones
These Zones are calculated based on extensions of the Period Value Zone.
While in a balanced market, these zones have been shown to provide potential reversal opportunities.
• Potential Reversal Signals
These signals are based on an advanced method for confirming a higher-low or lower-high to reasonably create a signal that is not very laggy but also rooted in sound logic.
While helpful, These are NOT buy or sell signals, and you should always use further analysis to decide the next steps to take.
When a signal appears, an associated invalidation level is also displayed, if this level is crossed the associated signal is no longer considered relevant.
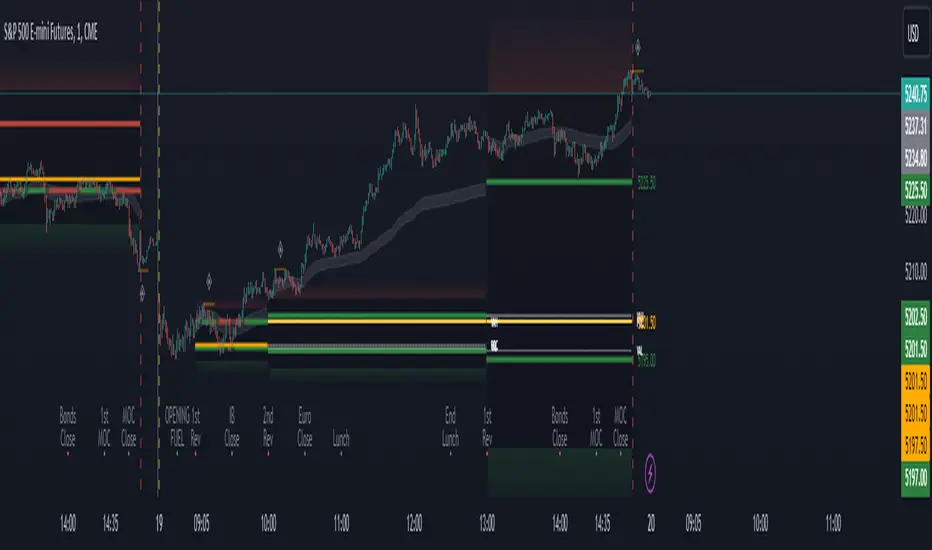
• Key Market Times
These are important times within the day that normally produce volatility caused by daily market catalysts.
Each key time is forward plotted 1 hour before it occurs to provide a clear heads up for potential opportunity.
Opening Fuel: Known for having an increase in Volume after the formation of the 15min Opening Range.
1st Reversal: Common Area for seeing initial large positioning effecting the market, often causing reversals.
Initial Balance Close: End of the first hour, a common positioning tool for futures traders.
2nd Reversal: Positioning is typically reactionary to IB Close, alongside Euro Traders Exiting Positions.
Euro Close: Close of Europe Session, a common positioning tool for futures traders.
Lunch: Usually Low Volume, traders are often out to lunch.
Lunch End: Volume tends to re-enter, as traders come back from lunch.
1st Reversal: New Hour, common area to see large position re-enter the market.
Bonds Close: Bonds markets close, Equities reacting to close of the bond market.
1st MOC: Initial Market on Close orders are places, market reaction is normally expected off of MOC positioning.
MOC Close: As MOC orders are reported, volatility is likely found within the market.
> Methodology
This indicator can be used with the same principles as trading balanced volume profiles.
Rule 1: Unless the price breaks and holds Value High or Value Low, we should expect buyers and sellers to maintain the current balance.
Rule 2: If we break and push away from the Period Value High, we should treat that level as supportive on retest unless we look back below and sellers defend on retest.
Rule 3: If we break and push away from the Period Value Low, we should treat that level as resistance on retest unless we look back above and buyers defend on retest.
Rule 4: If we recover Value Low, and it becomes supportive, we look for our Period POC and Period Value High as our targets above.
Rule 5: If we fail to hold Period Value High, and it becomes resistance, we look for our Period POC and Period Value Low as targets below.
Balance in the context of this indicator is considered as the area between Period Value High and Period Value Low
Acceptance outside of balance in the context of this indicator is considered as Period Value Low or High, becoming supportive or resistance.
> Examples
Theoretical Example:
In the bullish example below, price holds VWAP and makes POC supportive, showing interest from buyers pushing to Value High.
Real-World Example:
Below is an example of the same setup as the theoretical example, taking place on a real futures chart.
By utilizing these rules, we can look for opportunities at these levels and have a plan for how we should be interacting with them.
This will help us determine likely targets and risk-off levels that are based on volume and current "value" from participants.
DIY Custom Strategy Builder [ZP] - v1DISCLAIMER:
This indicator as my first ever Tradingview indicator, has been developed for my personal trading analysis, consolidating various powerful indicators that I frequently use. A number of the embedded indicators within this tool are the creations of esteemed Pine Script developers from the TradingView community. In recognition of their contributions, the names of these developers will be prominently displayed alongside the respective indicator names. My selection of these indicators is rooted in my own experience and reflects those that have proven most effective for me. Please note that the past performance of any trading system or methodology is not necessarily indicative of future results. Always conduct your own research and due diligence before using any indicator or tool.
===========================================================================
Introducing the ultimate all-in-one DIY strategy builder indicator, With over 30+ famous indicators (some with custom configuration/settings) indicators included, you now have the power to mix and match to create your own custom strategy for shorter time or longer time frames depending on your trading style. Say goodbye to cluttered charts and manual/visual confirmation of multiple indicators and hello to endless possibilities with this indicator.
What it does
==================
This indicator basically help users to do 2 things:
1) Strategy Builder
With more than 30 indicators available, you can select any combination you prefer and the indicator will generate buy and sell signals accordingly. Alternative to the time-consuming process of manually confirming signals from multiple indicators! This indicator streamlines the process by automatically printing buy and sell signals based on your chosen combination of indicators. No more staring at the screen for hours on end, simply set up alerts and let the indicator do the work for you.
Available indicators that you can choose to build your strategy, are coded to seamlessly print the BUY and SELL signal upon confirmation of all selected indicators:
EMA Filter
2 EMA Cross
3 EMA Cross
Range Filter (Guikroth)
SuperTrend
Ichimoku Cloud
SuperIchi (LuxAlgo)
B-Xtrender (QuantTherapy)
Bull Bear Power Trend (Dreadblitz)
VWAP
BB Oscillator (Veryfid)
Trend Meter (Lij_MC)
Chandelier Exit (Everget)
CCI
Awesome Oscillator
DMI ( Adx )
Parabolic SAR
Waddah Attar Explosion (Shayankm)
Volatility Oscillator (Veryfid)
Damiani Volatility ( DV ) (RichardoSantos)
Stochastic
RSI
MACD
SSL Channel (ErwinBeckers)
Schaff Trend Cycle ( STC ) (LazyBear)
Chaikin Money Flow
Volume
Wolfpack Id (Darrellfischer1)
QQE Mod (Mihkhel00)
Hull Suite (Insilico)
Vortex Indicator
2) Overlay Indicators
Access the full potential of this indicator using the SWITCH BOARD section! Here, you have the ability to turn on and plot up to 14 of the included indicators on your chart. Simply select from the following options:
EMA
Support/Resistance (HeWhoMustNotBeNamed)
Supply/ Demand Zone ( SMC ) (Pmgjiv)
Parabolic SAR
Ichimoku Cloud
Superichi (LuxAlgo)
SuperTrend
Range Filter (Guikroth)
Average True Range (ATR)
VWAP
Schaff Trend Cycle ( STC ) (LazyBear)
PVSRA (TradersReality)
Liquidity Zone/Vector Candle Zone (TradersReality)
Market Sessions (Aurocks_AIF)
How it does it
==================
To explain how this indictor generate signal or does what it does, its best to put in points.
I have coded the strategy for each of the indicator, for some of the indicator you will see the option to choose strategy variation, these variants are either famous among the traders or its the ones I found more accurate based on my usage. By coding the strategy I will have the BUY and SELL signal generated by each indicator in the backend.
Next, the indicator will identify your selected LEADING INDICATOR and the CONFIRMATION INDICATOR(s).
On each candle close, the indicator will check if the selected LEADING INDICATOR generates signal (long or short).
Once the leading indicator generates the signal, then the indicator will scan each of the selected CONFIRMATION INDICATORS on candle close to check if any of the CONFIRMATION INDICATOR generated signal (long or short).
Until this point, all the process is happening in the backend, the indicator will print LONG or SHORT signal on the chart ONLY if LEADING INDICATOR and all the selected CONFIRMATION INDICATORS generates signal on candle close. example for long signal, the LEADING INDICATOR and all selected CONFIRMATION INDICATORS must print long signal.
The dashboard table will show your selected LEADING and CONFIRMATION INDICATORS and if LEADING or the CONFIRMATION INDICATORS have generated signal. Signal generated by LEADING and CONFIRMATION indicator whether long or short, is indicated by tick icon ✔. and if any of the selected CONFIRMATION or LEADING indicator does not generate signal on candle close, it will be indicated with cross symbol ✖.
how to use this indicator
==============================
Using the indicator is pretty simple, but it depends on your goal, whether you want to use it for overlaying the available indicators or using it to build your strategy or for both.
To use for Building your strategy: Select your LEADING INDICATOR, and then select your CONFIRMATION INDICATOR(s). if on candle close all the indicators generate signal, then this indicator will print SHORT or LONG signal on the chart for your entry. There are plenty of indicators you can use to build your strategy, some indicators are best for longer time frame setups while others are responsive indicators that are best for short time frame.
To use for overlaying the indicators: Open the setting of this indicator and scroll to the SWITCHBOARD section, from there you can select which indicator you want to plot on the chart.
For each of the listed indicators, you have the flexibility to customize the settings and configurations to suit your preferences. simply open indicator setting and scroll down, you will find configuration for each of the indicators used.
I will also release the Strategy Backtester for this indicator soon.

Filtered Volume Profile [ChartPrime]The "Filtered Volume Profile" is a powerful tool that offers insights into market activity. It's a technical analysis tool used to understand the behavior of financial markets. It uses a fixed range volume profile to provide a histogram representing how much volume occurred at distinct price levels.
Profile in action with various significant levels displayed
How to Use
The script is designed to analyze cumulative trading volumes in different price bins over a certain period, also known as `'lookback'`. This lookback period can be defined by the user and it represents the number of bars to look back for calculating levels of support and resistance.
The `'Smoothing'` input determines the degree to which the output is smoothed. Higher values lead to smoother results but may impede the responsiveness of the indicator to rapid changes in volatility.
The `'Peak Sensitivity'` input is used to adjust the sensitivity of the script's peak detection algorithm. Setting this to a lower value makes the algorithm more sensitive to local changes in trading volume and may result in "noisier" outputs.
The `'Peak Threshold'` input specifies the number of bins that the peak detection mechanism should account for. Larger numbers imply that more volume bins are taken into account, and the resultant peaks are based on wider intervals.
The `'Mean Score Length'` input is used for scaling the mean score range. This is particularly important in defining the length of lookback bars that will be used to calculate the average close price.
Sinc Filter
The application of the sinc-filter to the Filtered Volume Profile reduces the risk of viewing artefacts that may misrepresent the underlying market behavior. Sinc filtering is a high-quality and sharp filter that doesn't manifest any ringing effects, making it an optimal choice for such volume profiling.
Histogram
On the histogram, the volume profile is colored based on the balance of bullish to bearish volume. If a particular bar is more intense in color, it represents a larger than usual volume during a single price bar. This is a clear signal of a strong buying or selling pressure at a particular price level.
Threshold for Peaks
The `peak_thresh` input determines the number of bins the algorithm takes in account for the peak detection feature. The 'peak' represents the level where a significant amount of volume trading has occurred, and usually is of interest as an indicative of support or resistance level.
By increasing the `peak_thresh`, you're raising the bar for what the algorithm perceives as a peak. This could result in fewer, but more significant peaks being identified.
History of Volume Profiles and Evolution into Sinc Filtering
Volume profiling has a rich history in market analysis, dating back to the 1950s when Richard D. Wyckoff, a legendary trader, introduced the concept of volume studies. He understood the critical significance of volume and its relationship with market price movement. The core of Wyckoff's technical analysis suite was the relationship between prices and volume, often termed as "Effort vs Results".
Moving forward, in the early 1800s, the esteemed mathematician J. R. Carson made key improvements to the sinc function, which formed the basis for sinc filtering application in time series data. Following these contributions, trading studies continued to create and integrate more advanced statistical measures into market analysis.
This culminated in the 1980s with J. Peter Steidlmayer’s introduction of Market Profile. He suggested that markets were a function of continuous two-way auction processes thus introducing the concept of viewing markets in price/time continuum and price distribution forms. Steidlmayer's Market Profile was the first wide-scale operation of organized volume and price data.
However, despite the introduction of such features, challenges in the analysis persisted, especially due to noise that could misinform trading decisions. This gap has given rise to the need for smoothing functions to help eliminate the noise and better interpret the data. Among such techniques, the sinc filter has become widely recognized within the trading community.
The sinc filter, because of its properties of constructing a smooth passing through all data points precisely and its ability to eliminate high-frequency noise, has been considered a natural transition in the evolution of volume profile strategies. The superior ability of the sinc filter to reduce noise and shield against over-fitting makes it an ideal choice for smoothing purposes in trading scripts, particularly where volume profiling forms the crux of the market analysis strategy, such as in Filtered Volume Profile.
Moving ahead, the use of volume-based studies seems likely to remain a core part of technical analysis. As long as markets operate based on supply and demand principles, understanding volume will remain key to discerning the intent behind price movements. And with the incorporation of advanced methods like sinc filtering, the accuracy and insight provided by these methodologies will only improve.
Mean Score
The mean score in the Filtered Volume Profile script plays an important role in probabilistic inferences regarding future price direction. This score essentially characterizes the statistical likelihood of price trends based on historical data.
The mean score is calculated over a configurable `'Mean Score Length'`. This variable sets the window or the timeframe for calculation of the mean score of the closing prices.
Statistically, this score takes advantage of the concept of z-scores and probabilities associated with the t-distribution (a type of probability distribution that is symmetric and bell-shaped, just like the standard normal distribution, but has heavier tails).
The z-score represents how many standard deviations an element is from the mean. In this case, the "element" is the price level (Point of Control).
The mean score section of the script calculates standard errors for the root mean squared error (RMSE) and addresses the uncertainty in the prediction of the future value of a random variable.
The RMSE of a model prediction concerning observed values is used to measure the differences between values predicted by a model and the values observed.
The lower the RMSE, the better the model is able to predict. A zero RMSE means a perfect fit to the data. In essence, it's a measure of how concentrated the data is around the line of best fit.
Through the mean score, the script effectively predicts the likelihood of the future close price being above or below our identified price level.
Summary
Filtered Volume Profile is a comprehensive trading view indicator which utilizes volume profiling, peak detection, mean score computations, and sinc-filter smoothing, altogether providing the finer details of market behavior.
It offers a customizable look back period, smoothing options, and peak sensitivity setting along with a uniquely set peak threshold. The application of the Sinc Filter ensures a high level of accuracy and noise reduction in volume profiling, making this script a reliable tool for gaining market insights.
Furthermore, the use of mean score calculations provides probabilistic insights into price movements, thus providing traders with a statistically sound foundation for their trading decisions. As trading markets advance, the use of such methodologies plays a pivotal role in formulating effective trading strategies and the Filtered Volume Profile is a successful embodiment of such advancements in the field of market analysis.

SuperCloudSupercloud is a MA based Trend Representation. Its different from a normal MA Cloud. Cloud starts from '0' level and rise or fall based on price.
Supercloud is plotted based on the difference of the price movement between various MA's of different length. All MA's are plotted with reference to EMA 200. So when the MA's converge or Diverge or Bounce back we can still be in the Trend unless the Cloud goes below or above Zero Line.
works in all Timeframes.
Up Trend:
-> All MA's are Above Zero and Cloud color is complete green
-> A decrease in Cloud Volume indicates a weaker Momentum
Down Trend:
-> All MA's are Below Zero and Cloud color is complete red
-> A decrease in Cloud Volume indicates a weaker Momentum
Sideways:
-> A Mixed color indicates a Sideways moment.
Cloud Outlines:
1) The outer edge of Cloud shows the actual trend.
2) its based on MA-5, when price is above MA 5 or Below MA 5 a bright green and bright red outlines are plotted.
Buy Signals Confirmation:
upper Outer Cloud must be Bright Green
Cloud under must be fully Shaded Green
Alternatively EMA crossover can be used and confirmed.
Sell Signals Confirmation:
lower Outer Cloud must be Bright Red
Cloud under must be fully Shaded Red
Alternatively EMA cross under can be used and confirmed.
MACD
MACD is also plotted within the cloud.
Color ribbon is used to plot MACD
Histogram is not present. Instead use the width of the MACD Ribbon
Correspondingly Outer Cloud represents the Histogram.
Zero Line:
Zero line is actually EMA5 which is to be treated as EMA200 for our visual representation.
A sideway channel is plotted around Zero line.
When price reaches this sideways Zone price usually get rejections and starts moving side ways.
Trend is established only after price crosses the sideway band.
Sideway is calculated based on mintick of the Asset which varies. a min value equivalent to 10EMA or value 10 must be used for better usage.

MACD with Support and Resistance - Signals, Alerts, TP and SLMACD with Support and Resistance - Signals Alerts SL and TP by Tech Store On
The script uses MACD for entering/exiting trades and support/resistance lines to take TP1 (take profit 1). Both MACD and support/resistance lines are fully configurable to your preference, and you can back-test it via TradingView. Once TP1 is taken, you can either set the indicator to close the trade at the end of the US trading session day (4PM ET) or you can continue taking partial profits where you wish or just wait until reversal signal alert.
For example: If you will be day trading SPY and you wish to close your positions no matter what right before the market closes (3:45PM ET > 15min before closes): Make sure to checkbox “Intraday – Close Position Before Market Closes” in the strategy/indicator Settings, so that you are alerted soon before the market closes, if you wish to continue holding the position – leave this checkbox unchecked.
SL: SL is set to be slightly above/below the MACD signal candle, which is best suited for this strategy from manual backtesting.
Strategy Take Profit Approach
While the initial position open and SL hit is always based on a closed candle bar (can’t do otherwise, as otherwise you will have 10s of fake signal alerts), there are 2 ways on trading this strategy in terms of TP1 / TP1 taken > back to Entry, which is based off Alert type.
You can switch this as you like within the indicator settings, “Checked: TP1/TP1 taken > back to Entry per Price Touch | Unchecked: per Candle Close”.
Candle Close vs Price Touch: with the Default method - Candle Close for an alert for TP1 or if price comes back to Entry after TP1 is taken will only be triggered once candle bar fully closes crossing the area, while Price Touch will alert when price touches the area before candle bar closes.
For example: your trade is running well, you grab TP1 and the price reverses and hits your trade Entry area. With Price Touch – you are immediately alerted to close your trade with no loss and with TP1 profit. With Candle Close - you will receive an alert only once candle bar fully closes on top of the Entry crossing it backwards, meaning it may lower your TP1 profit or even completely reverse the trade into loss in case it will be a huge candle bar for any reason. However, it may touch the Entry area, looking like the price is reversing, but then continue per initial trade direction, sometimes becoming a trend. So, while Price Touch seem like a more conservative approach, Candle Close can give you much bigger profits if you catch a trend, but you can always change it via the Settings.
Note: TradingView back-testing engine does not have a feature to open/close orders IMMEDIATELY via Price Touch trigger, but only when the candle closes after price touches the scripted area/line/etc., so you for the most accurate results, test your strategy out via Candle Close setting. Otherwise, decide yourself. I personally like more Candle Close since I can test it out via back-testing with the most accurate results.
Note: If you will be observing the strategy LIVE, during LIVE candle bar movement – it will look weird, like it’s placing an order after order during any trigger – this seem like a TradingView bug, but is only observational, once the candle bar is closed and you refresh TradingView it will all look correct.
Back-Testing
If you wish to do some back-testing, just modify the strategy/indicator Settings:
-----1) STRATEGY: This is for back-testing/experimenting with the script inputs.
----------a. You can setup a start date (date, month, year) from which it will start opening back-test trades, select a position size and select TP1 size, the idea here is to close half (or whatever you choose) portion of the trade once you hit your TP1, then to either close at small profit or to catch a trend and close the second portion of the position long way ahead from Entry, otherwise it will alert you to close the position if price comes back to Entry, at reversal signal or at the end of US trading session if the option for it is checked. If you wish to close the whole position at TP1, just enter the same amount for TP1 to match backtest position size. Otherwise you can experiment with TP1 sizing – try it out!
-----2) Feel free to experiment with MACD settings and with S&R Left/Right bars, you may be amazed how results will differ and find some really cool combinations!
-----3) Make sure you select/de-select “Intraday – Close Position Before Market Closes” setting depending on what you are back-testing and on which conditions
-----4) Note: If you wish to do some deep back-testing (1+ years), use the “Deep Backtesting” feature within Strategy Tester on the TradingView as otherwise it may show wrong results or even fail to compute the results
Add the alerts
-----Right-click anywhere on the TradingView chart
-----Click on Add alert
-----Condition: MACD with Support and Resistance - Signals
----------o Right underneath the condition click on the drop-down menu and select “alert() function calls only”
-----Expiration time: Whatever you wish
-----Alert actions: Whatever notifications you wish
-----Alert name: DO NOT TOUCH THIS
-----Hit “Create”
-----Note: If you change ANY Settings within the indicator – you must DELETE the current alert and create a new one per steps above, otherwise it will continue triggering alerts per old Settings!
- Note: If you add the alert while the script is currently “In Position” it will not know that. So either wait when there will be no position open at all or close your position partially if the bot opens it twice bigger or so in case per script the bot will think it is already in position.
Note: Because of the slippage and the order processing time between TradingView, AutoView and the Broker (it’s usually about a second or so), it is suggested to not use a timeframe lower than 1min. The script is working really well with 15M/H1 timeframes per my back-testing, but feel free to explore via Strategy Back-testing what’s best for the instrument you wish to trade.

SuperTrend Support & Resistance(My goal creating this indicator) : Provide a way to categorize and label key structures on multiple time frames so I can create a plan based on those observable facts.
The Underlying Concept / What is Momentum?
The Momentum shown is derived from a Mathematical Formula, SUPERTREND. When price closes above Supertrend Its bullish Momentum when its below Supertrend its Bearish Momentum. On the first bar bearish momentum is detected a resistance Level is made at the highest point of the previous bullish condition. On the first bar bullish momentum is detected a support Level is made at the lowest point of the previous bearish condition. As I become a better analyst I will find better techniques and this source code may become open-source, but as of now it remains protected. This indicator scans for bullish & bearish Momentum on the Timeframes selected by the user and when there is a shift in momentum on any of those time frames (price closes below or above SUPERTREND ) it notifies the trader with a Supply or Demand level with a unique color and Size to signify the severity of said level.
What is Severity?
Severity is How we differentiate the importance of different Highs and Lows. If Momentum is detected on a higher timeframe the Supply or Demand Level is updated. The Color and Size representing that higher timeframe will be shown. Demand and Supply Levels made by higher Timeframes are more SEVERE then a demand level made by a lower Timeframe.
Technical Inputs
- If you want to optimize the rate of signals to better fit your trading plan you would change the Factor input and ATR Length input. Increase factor and ATR Length to decrease the frequency of signals and decrease the Factor and ATR Length to increase the frequency of signals.
- to ensure the correct calculation of Support and Resistance levels change BAR_INDEX. BAR_INDEX creates a buffer at the start of the chart. For example: If you set BAR_INDEX to 300. The script will wait for 300 bars to elapse on the current chart before running. This allows the script more time to gather data. Which is needed in order for our dynamic lookback length to never return an error(Dynamic lookback length cant be negative or zero). The lower the timeframe the greater the amount of bars need. For Example if I open up a 30 sec chart I would enter 5000 as my BAR_INDEX since that will provide enough data to ensure the correct calculation of Support and Resistance levels.
Time Frame Inputs
- The indicator has 3 Time Frame Displays where you can choose how SEVERE You want the Supply and Demand Levels. For Example: 1min, 3min, 5min, 15 min Levels, 60 min levels Weekly Levels, etc.....The higher the Timeframe Selected the more SEVERE the Level.
- Use the Amount of time Frames input to increase or limit the amount of time frames that will be displayed onto the chart.
Display Inputs
- The toggle (Trend or Basic) option Lets the trend determine the colors of the Support and Resistance Levels or Basic where the color is strictly based on if its a high or a low ( Trend = HH,HL,LL,LH)
- Toggle options (Close) and (High & Low) creates Support and Resistance Levels using the Lowest close and Highest close or using the Lowest low and Highest high.
Toggle on both or toggle off both in order to use both these values when determining the trend of your chart. For Example this would mean (Price has to close higher then the highest high. Not only make a higher high or a
higher close) and the inverse (Price has to close lower then the lowest low. Not only make a lower low or a lower close)
How Trend Is being Determined ?
(Previous Supply Level > Current Supply Level ) if this statement is true then its s LH so the trend is bearish if this statement is false then its a HH so the trend is bullish
(Previous Demand Level > Current Demand Level ) if this statement is true then its a LL so the trend is bearish if this statement is false then its a HL so the trend is bullish
(Close > Current Supply Level ) if this statement is true technically price made a HH so the trend is bullish
(Close < Current Demand Level ) if this statement is true technically price made a LL so the trend is bearish
- Fully customize how you display and label Market Structure in specific timeframes. Line Length, Line Width, Line Style, Label Distance, Label Size, Label Background Size, and Background Color can all be customized.
- Lastly Is the Trend Chart. To Easily verify the current trend of any timeframes displayed by this indicator toggle on Chart On/Off . You also get the option to change the Chart Position and the size of the Trend Chart
*****The Current charts timeframe has to lower then a month to ensure correct calculation of Supply and Demand Levels*****
How it can be used ?
(Examples of Different ways you can use this indicator) : Easily categorize the severity of each and every Supply or Demand Level in the market (The higher the time frame the stronger the level)
: Quickly Determine the trend of any Timeframe
: Get a consistent view of a market and how different time frames are behaving but just use one chart.
: Take the discretion from hand drawing support and resistance lines out of your trading
: Find and categorize strong levels for potential breakouts
: Trend Analysis, Use multiple time frames to create a narrative based on observable facts from these time frames
: Different Targets to take money off the table
: Use labels to differentiate between different trend line setups
: Find Great places to move your stop loss too.

Best TradingView Strategy - For NASDAQ and DOW30 and other IndexThe script is totally based on momentum , volume and price. We have used :
1: Bollinger Band Squeezes to know when a breakout might happen.
2: Used Moving Averages(SMA and EMA) to know the direction.
3: The success Rate of this strategy is above 75% and if little price action is added it can easily surpass 90% success mark.
4: Do not worry about drawdowns , we have implemented trailing SL ,so you might see a little extra drawdown but in reality its pretty less.
5: I myself have tested this strategy for 41 days with a 250$ account and right now I have 2700$.

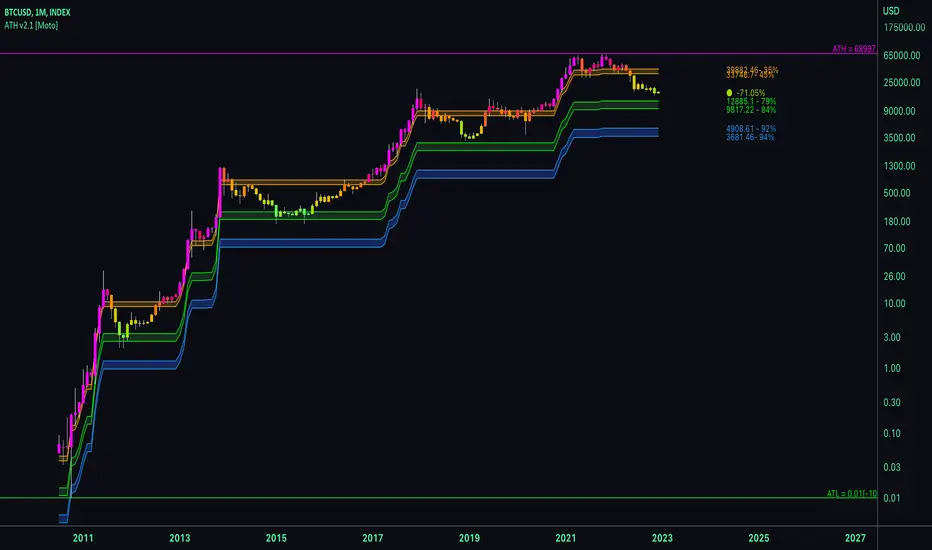
ATH [Moto]Hello traders,
This script attempts to inform trading decisions/sentiment via drawdown (percent) from all time high. Any fan of fibonacci should find this useful.
All time high is essentially checked and the script adapts to new/broken all time highs. The plot shapes and signals are based on the candle closes below these common percents from all time high. Use the signals at your own discretion.
Lines and styling are placed at the further extremes of the common % candles. For example, for "Tops", when candles cross under 5% from all time high, and line is made at the candles high, and conversely when a candle crosses above 50% from it's previous all time high a line is placed at its low.
Bar coloring, the % being crossed, and extreme background color are included, as are alerts for each signal.
TM_SWING_LEVELSwing level Indicator shows overall market price structure of market for Swing Position.
Terminology Use ==> Price Line, Price Level name and Price level
Timeframe ==> Use proper Signal with swing trend on 1 Hour or Upper time frame (Best if Use with 1 Hour chart or 1 Day chart).
What to Identify ==> Overall market price structure for the Swing Period
How to Use ==>
There are Many Line in price level chart
Green/red with Solid for important area of support or resistance
other dotted lines are for retracement or extension of prices.
Important Structure==> Price behaviors on all lines of possible support and resistance
Use market structure, chart pattern, trend lines for more support.
Entry ==>
Let’s wait the proper area of support or resistance (Area of Value in case of trend pattern use)
Exit ==>
SL of swing high/low out of market structure with proper risk management and target with proper Risk/ Reward Ratio

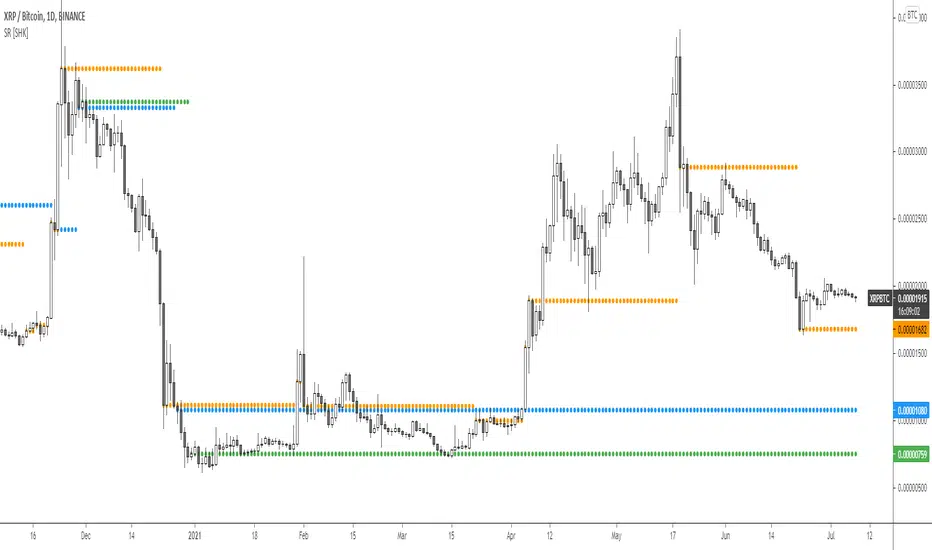
Support and Resistance MTF levels [SHK]A new way of drawing multi timeframe support and resistance !
This tool doesn't get the last high and lows, otherwise it tries to detect highly liquid levels with pending orders .
Share your opinion and result.
Enjoy!

Support & Resistance Zones [SHK]Support & Resistance Zones clearly draws some useful S\R zones for you.
Important notes:
It's not bulletproof and unmistakable but it may be so useful to get some strong zones. You may get false or missed levels, So always check for other levels.
Always draw the continuation of previous levels by hand. It's a must! I didn't continue the zones to keep your charts clear.
The lagging is zero . Unlike many similar scripts.
Just compare the results to another support and resistance tools :)
Feel free to share your ideas about this script.
