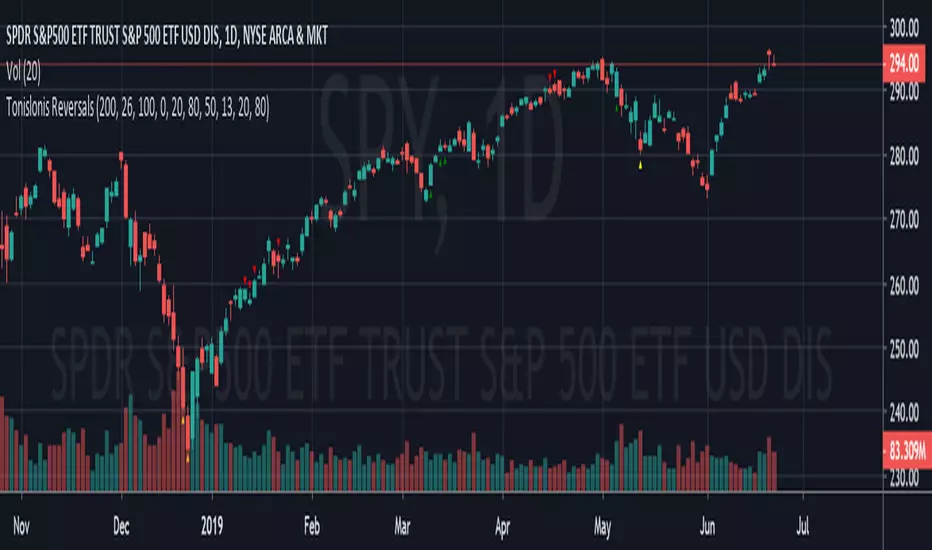
Tonislonis ReversalsHello,
so this is one of my so called "algos", which I crafted to give me indication of one certain pattern happening. I saw that this "pattern" had some pretty nice returns, if you use it on daily chart on big cap stocks and mix it with order flow or unusual option activity (sweeps).
Best entries happen when the yellow triangle appears little bit away from 13 EMA. Check the order flow and if everything looks like you have an edge, then take a trade and take profit near 13 EMA.
Not gonna share any code, because it's my magical "black box", which I built and be grateful that I'm even publishing it. Not gonna share anymore information about this. Just if you like it then use it and if not then don't.
Now go out there and make a living from it taking trades as some freaking yellow triangles show you entries lol.
Swingtrading
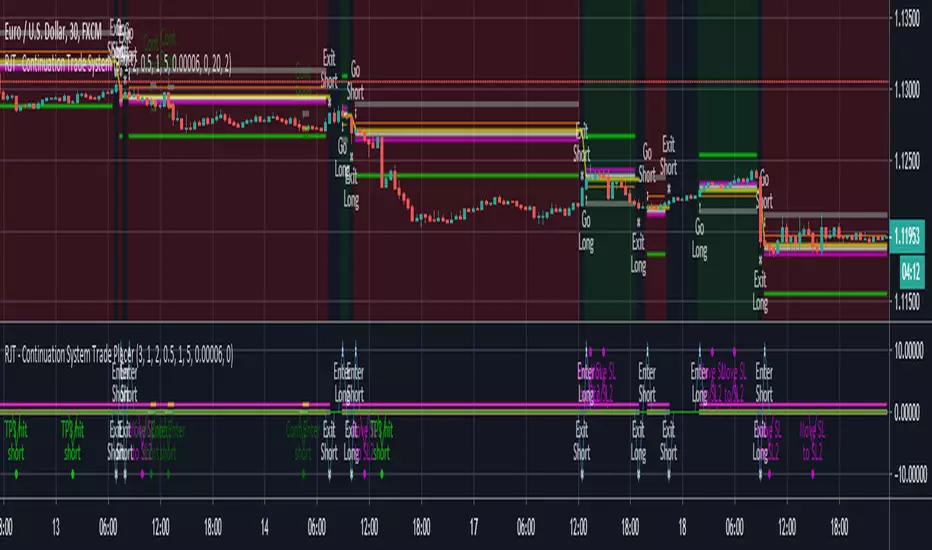
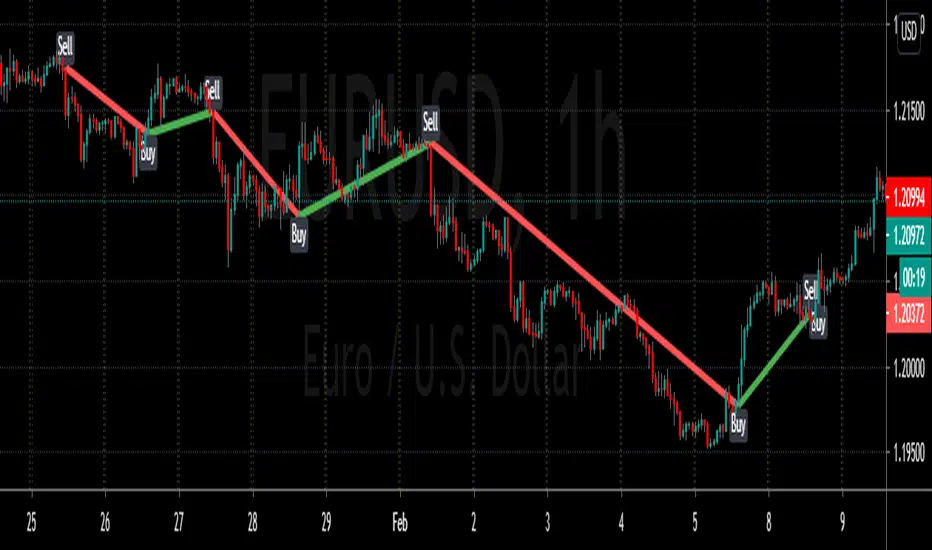
RJT CONTINUATION TRADE STRATEGY - TRADE ENTRY INDICATORThis indicator is used to trade the RJT Continuation Trade Strategy . The fundamental idea behind this strategy is that a trend will continue. Initial entries are placed along with take profit targets and stop losses, then additional entries are placed when pull backs are identified.
This indicator highlights when to place Trade Entries - both long and short, as well as Take Profits and Stop Losses, below the price chart.
This is most powerful when combined with the RJT Continuation Trade Strategy - Trade Overview Indicator
RJT CONTINUATION TRADE STRATEGY - TRADE OVERVIEW INDICATORThis indicator is used to trade the RJT Continuation Trade Strategy . The fundamental idea behind this strategy is that a trend will continue. Initial entries are placed along with take profit targets and stop losses, then additional entries are placed when pull backs are identified.
This indicator gives an overview of where Trade Entries - both long and short, as well as Take Profits and Stop Losses are on the price chart.
This is most powerful when combined with the RJT Continuation Trade Strategy - Trade Entries Indicator


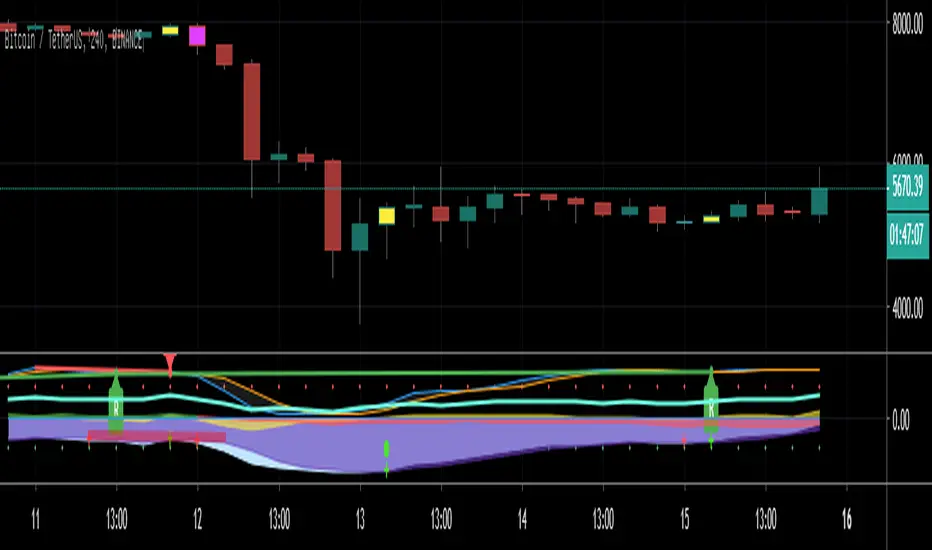
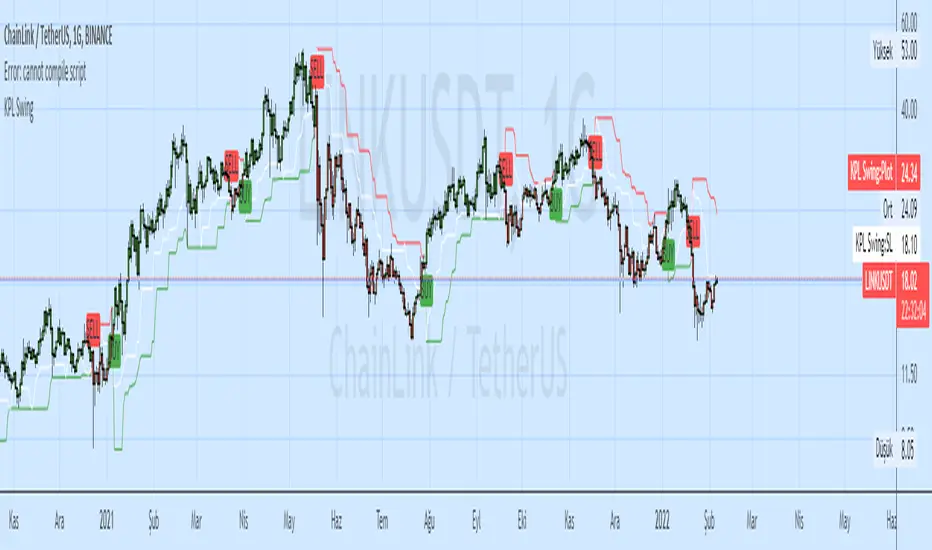
Gravity Swing Oscillator V1 - optimized for CryptoGravity Swing Oscillator V1 - optimized for Crypto
- Top & Bottoms
- Buy / Sell Signals on colorchanging LED Dots
- can show danger Price Dop Zones on Bars
10/20 MA Cross-Over with Heikin-Ashi Signals by SchobbejakThe 10/20 MA Heikin-Ashi Strategy is the best I know. It's easy, it's elegant, it's effective.
It's particularly effective in markets that trend on the daily. You may lose some money when markets are choppy, but your loss will be more than compensated when you're aboard during the big moves at the beginning of a trend or after retraces. There's that, and you nearly eliminate the risk of losing your profit in the long run.
The results are good throughout most assets, and at their best when an asset is making new all-time highs.
It uses two simple moving averages: the 10 MA (blue), and the 20 MA (red), together with heikin-ashi candles. Now here's the great thing. This script does not change your regular candles into heikin-ashi ones, which would have been annoying; instead, it subtly prints either a blue dot or a red square around your normal candles, indicating a heikin-ashi change from red to green, or from green to red, respectively. This way, you get both regular and heikin ashi "candles" on your chart.
Here's how to use it.
Go LONG in case of ALL of the below:
1) A blue dot appeared under the last daily candle (meaning the heikin-ashi is now "green").
2) The blue MA-line is above the red MA-line.
3) Price has recently breached the blue MA-line upwards, and is now above.
COVER when one or more of the above is no longer the case. This is very important. You want to keep your profit.
Go SHORT in case of ALL of the below:
1) A red square appeared above the last daily candle (meaning the heikin-ashi is now "red").
2) The red MA-line is above the blue MA-line.
3) Price has recently breached the blue MA-line downwards, and is now below.
Again, COVER when one or more of the above is no longer the case. This is what gives you your edge.
It's that easy.
Now, why did I make the signal blue, and not green? Because blue looks much better with red than green does. It's my firm believe one does not become rich using ugly charts.
Good luck trading.
--You may tip me using bitcoin: bc1q9pc95v4kxh6rdxl737jg0j02dcxu23n5z78hq9 . Much appreciated!--

SunnyDickree V2The SunnyDickree Indicator
Use this indicator on the 2 hour chart
When the candles appear under the trendline with red dots price is most likely going to continue the trend down (or breakdown)
When the candles print above the EMA with greendots price is most likely going to continue the trend up (or breakup)
#sub2sunny

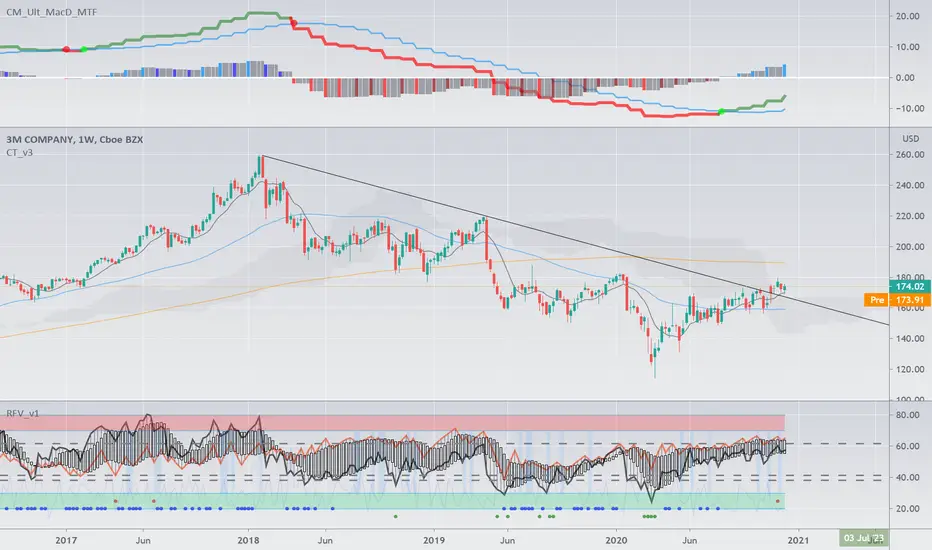
Ichimoku Double Cloud + AutoFibCombined indicator using an ichimoku double cloud derivative.
Ideal use is option swings, using traditional ichimoku rules, targets are adjusted to the current ATR.
Appropriate strikes closest to one of these lines for assisted price targeting.

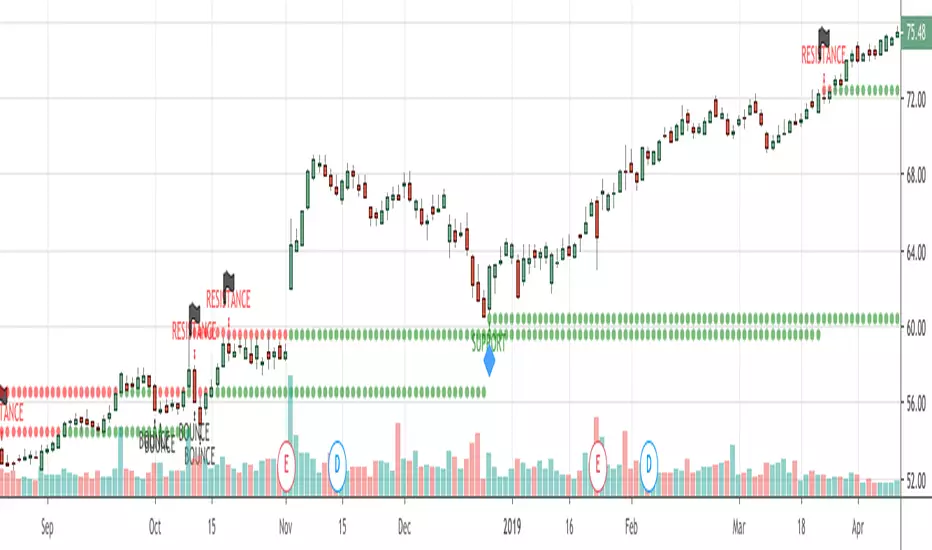
Trade Crusher: Swing and Day Trade IndicatorHow to use the indicator
Add to favorites/apply to chart.
The indicator can be used for both Swing trade and Intra-day trading.
Swing trading:
--Use with background colors
--Input: 30 or 36
--Time frame: Daily or Weekly
--Buy only when background is aqua
--Sell only when background is red
--Use with bars or candles (use candles without borders to avoid confusion). I suggest to just use bars.
--Place buy orders above the 1st or 2nd blue bar after black bars. The background must be aqua.
--Ignore yellow bars with aqua background. They are shake out bars at the beginning or a trend and warnings of reversal
towards the end of trend.
--Place sell orders bellow the 1st or 2nd yellow bar after black bars. The background must be red.
--Ignore blue bars with red background (same as above).
--Black bars are nothing: Pullbacks/Chop
Day Trading:
--DO NOT use background colors. Un-click.
--Input: 10
--Time frame: 5 minutes
--Use with bars or candles (use candles without borders to avoid confusion). I suggest to just use bars.
--Place buy orders above the 1st or 2nd blue bar after black bars.
--Place sell orders bellow the 1st or 2nd yellow bar after black bars.
--Utilize some sort of scanner that can identify stocks with heavy pre-market volume (news, earnings, etc)
***
Use stop losses however you normally do. Take profits however you normally do.
I do not suggest using with other indicators as you may just paralyze your brain, however, if you find something that works, drop a comment.
Best of luck

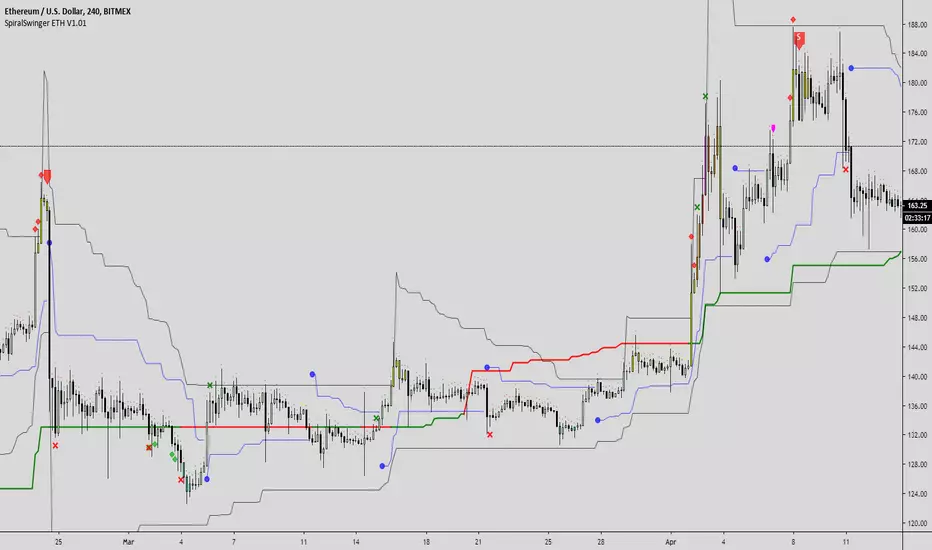
SpiralSwinger ETHThis is the same swinger script based on multi-exchange algo of Godmode oscillator i made for BTC trading only. It's custom tweaked to be used for trading ETH/USD pair and ETH perpetual swaps on Bitmex. It doesn't work correctly on ETH/BTC pairs. Same rules apply for entry: after signal you enter position with half of the risk to be sure you are in a trade, then wait for pullback to average entry with other half of the risk. SL should be set to longest wick before signal. Trade should be managed on the same TF you received signal - take profit points and stop loss trailing are taken from current TF. In case you receive same signal for a same price region on higher TF but you are already in a position then switch managing of the trade to higher TF. Example: you recieved a short on 4H, then after a couple of hours you get another short but this time on 8H - switch to 8H chart and manage take profits and SL according to 8H. Best TF for using it is 4H, 6H, 8H, 12H. More documentation and FAQ to be shared later.

Hull MA & Warning Zones & Buy/Sell ArrowsThis moving average, in contrast to the standard, shows a slowdown of the current trend - it draws additional zones of yellow color. These zones show a possible trend reversal by 1-2 bars earlier than the standard Hull moving average. Additionally, there are arrows to enter a position and the second is the same MA for another timeframe, which can be selected in the settings.

5-8 EMA Cross with added 20 EMAThis is a simple EMA cross script to get into trades early using a 5/8 EMA cross but also allows you to filter out risky trades using the 20 EMA. For long trades the cross is not a valid signal if it occurs below the 20 EMA and vice versa.

Kawabunga Swing Failure Points Candles (SFP) by RRBKawabunga Swing Failure Points Candles (SFP) by RagingRocketBull 2019
Version 1.0
This indicator shows Swing Failure Points (SFP) and Swing Confirmation Points (SCP) as candles on a chart.
SFP/SCP candles are used by traders as signals for trend confirmation/possible reversal.
The signal is stronger on a higher volume/larger candle size.
A Swing Failure Point (SFP) candle is used to spot a reversal:
- up trend SFP is a failure to close above prev high after making a new higher high => implies reversal down
- down trend SFP is a failure to close below prev low after making a new lower low => implies reversal up
A Swing Confirmation Point (SCP) candle is just the opposite and is used to confirm the current trend:
- up trend SCP is a successful close above prev high after making a new higher high => confirms the trend and implies continuation up
- down trend SCP is a successful close below prev low after making a new lower low => confirms the trend and implies continuation down
Features:
- uses fractal pivots with optional filter
- show/hide SFP/SCP candles, pivots, zigzag, last min/max pivot bands
- dim lag zones/hide false signals introduced by lagging fractals or
- use unconfirmed pivots to eliminate fractal lag/false signals. 2 modes: fractals 1,1 and highest/lowest
- filter only SFP/SCP candles confirmed with volume/candle size
- SFP/SCP candles color highlighting, dim non-important bars
Usage:
- adjust fractal settings to get pivots that best match your data (lower values => more frequent pivots. 0,0 - each candle is a pivot)
- use one of the unconfirmed pivot modes to eliminate false signals or just ignore all signals in the gray lag zones
- optionally filter only SFP/SCP candles with large volume/candle size (volume % change relative to prev bar, abs candle body size value)
- up/down trend SCP (lime/fuchsia) => continuation up/down; up/down trend SFP (orange/aqua) => possible reversal down/up. lime/aqua => up; fuchsia/orange => down.
- when in doubt use show/hide pivots/unconfirmed pivots, min/max pivot bands to see which prev pivot and min/max value were used in comparisons to generate a signal on the following candle.
- disable offset to check on which bar the signal was generated
Notes:
Fractal Pivots:
- SFP/SCP candles depend on fractal pivots, you will get different signals with different pivot settings. Usually 4,4 or 2,2 settings are used to produce fractal pivots, but you can try custom values that fit your data best.
- fractal pivots are a mixed series of highs and lows in no particular order. Pivots must be filtered to produce a proper zigzag where ideally a high is followed by a low and another high in orderly fashion.
Fractal Lag/False Signals:
- only past fractal pivots can be processed on the current bar introducing a lag, therefore, pivots and min/max pivot bands are shown with offset=-rightBars to match their target bars. For unconfirmed pivots an offset=-1 is used with a lag of just 1 bar.
- new pivot is not a confirmed fractal and "does not exist yet" while the distance between it and the current bar is < rightBars => prev old fractal pivot in the same dir is used for comparisons => gives a false signal for that dir
- to show false signals enable lag zones. SFP/SCP candles in lag zones are false. New pivots will be eventually confirmed, but meanwhile you get a false signal because prev pivot in the same dir was used instead.
- to solve this problem you can either temporary hide false signals or completely eliminate them by using unconfirmed pivots of a smaller degree/lag.
- hiding false signals only works for history and should be used only temporary (left disabled). In realtime/replay mode it disables all signals altogether due to TradingView's bug (barcolor doesn't support negative offsets)
Unconfirmed Pivots:
- you have 2 methods to check for unconfirmed pivots: highest/lowest(rightBars) or fractals(1,1) with a min possible step. The first is essentially fractals(0,0) where each candle is a pivot. Both produce more frequent pivots (weaker signals).
- an unconfirmed pivot is used in comparisons to generate a valid signal only when it is a higher high (> max high) or a lower low (< min low) in the dir of a trend. Confirmed pivots of a higher degree are not affected. Zigzag is not affected.
- you can also manually disable the offset to check on which bar the pivot was confirmed. If the pivot just before an SCP/SFP suddenly jumps ahead of it - prev pivot was used, generating a false signal.
- last max high/min low bands can be used to check which value was used in candle comparison to generate a signal: min(pivot min_low, upivot min_low) and max(pivot max_high, upivot max_high) are used
- in the unconfirmed pivots mode the max high/min low pivot bands partially break because you can't have a variable offset to match the random pos of an unconfirmed pivot (anywhere in 0..rightBars from the current bar) to its target bar.
- in the unconfirmed pivots mode h (green) and l (red) pivots become H and L, and h (lime) and l (fuchsia) are used to show unconfirmed pivots of a smaller degree. Some of them will be confirmed later as H and L pivots of a higher degree.
Pivot Filter:
- pivot filter is used to produce a better looking zigzag. Essentially it keeps only higher highs/lower lows in the trend direction until it changes, skipping:
- after a new high: all subsequent lower highs until a new low
- after a new low: all subsequent higher lows until a new high
- you can't filter out all prev highs/lows to keep just the last min/max pivots of the current swing because they were already confirmed as pivots and you can't delete/change history
- alternatively you could just pick the first high following a low and the first low following a high in a sequence and ignore the rest of the pivots in the same dir, producing a crude looking zigzag where obvious max high/min lows are ignored.
- pivot filter affects SCP/SFP signals because it skips some pivots
- pivot filter is not applied to/not affected by the unconfirmed pivots
- zigzag is affected by pivot filter, but not by the unconfirmed pivots. You can't have both high/low on the same bar in a zigzag. High has priority over Low.
- keep same bar pivots option lets you choose which pivots to keep when there are both high/low pivots on the same bar (both kept by default)
SCP/SFP Filters:
- you can confirm/filter only SCP/SFP signals with volume % change/candle size larger than delta. Higher volume/larger candle means stronger signal.
- technically SCP/SFP is always the first matching candle, but it can be invalidated by the following signal in the opposite dir which in turn can be negated by the next signal.
- show first matching SCP/SFP = true - shows only the first signal candle (and any invalidations that follow) and hides further duplicate signals in the same dir, does not highlight the trend.
- show first matching SCP/SFP = false - produces a sequence of candles with duplicate signals, highlights the whole trend until its dir changes (new pivot).
Good Luck! Feel free to learn from/reuse the code to build your own indicators!


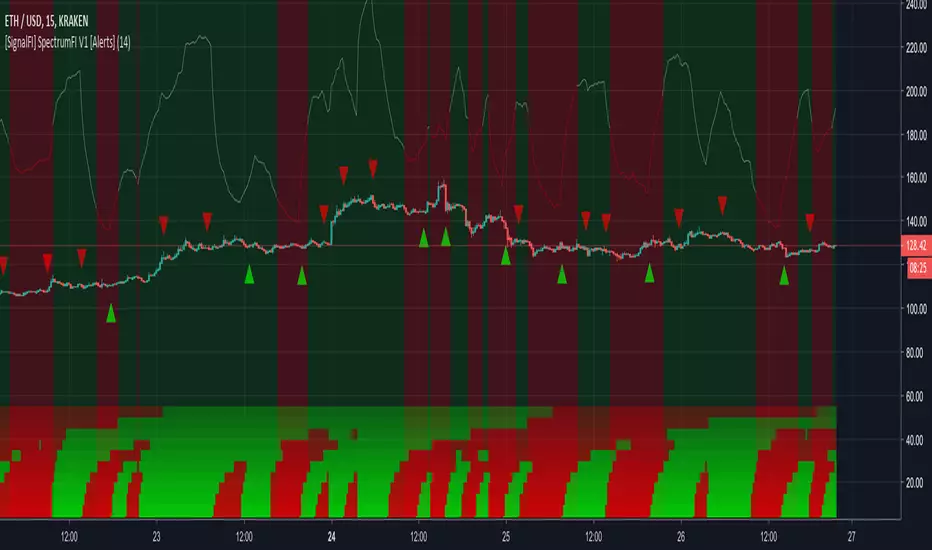
[SignalFI] SpectrumFI V1 [Alerts]SpectrumFI uses 11 independent Fibonacci based moving averages and their associated momentum to create a unified trend signal.
FIBONACCI BASED TREND DISCOVERY
DIFFERENCE STATISTICS COMBINED WITH RSI MOMENTUM
HEATMAP AND RSI INDICATORS BUILT INTO ONE TRADINGVIEW INDICATOR
ALERTS VERSION Only for Jedi and Master Subscribers
SignalFI was created to help traders and investors to effectively analyze the market based on the Golden Mean Ratio (Fibonacci numbers), plan a trade and ultimately execute it. To help inform and educate market decisions we developed a set of Trading Indicators which are available on TradingView , the most advanced and yet easy to use charting platform available on the web.
SignalFI indicators are just that, indicators. Our indicators are generally configured to use completely historical data (negating repaint), and we advise all alerts created with SignalFI indicators to be fired upon "close" of the current candle. Our indicators can provide valuable context and visualization support when performing market analysis and executing buy and sell decisions. However. we are not financial experts, and all information presented on this site or our other media outlets are for educational purposes only.
For subscription information, visit www.signalfi.net and follow us on twitter.
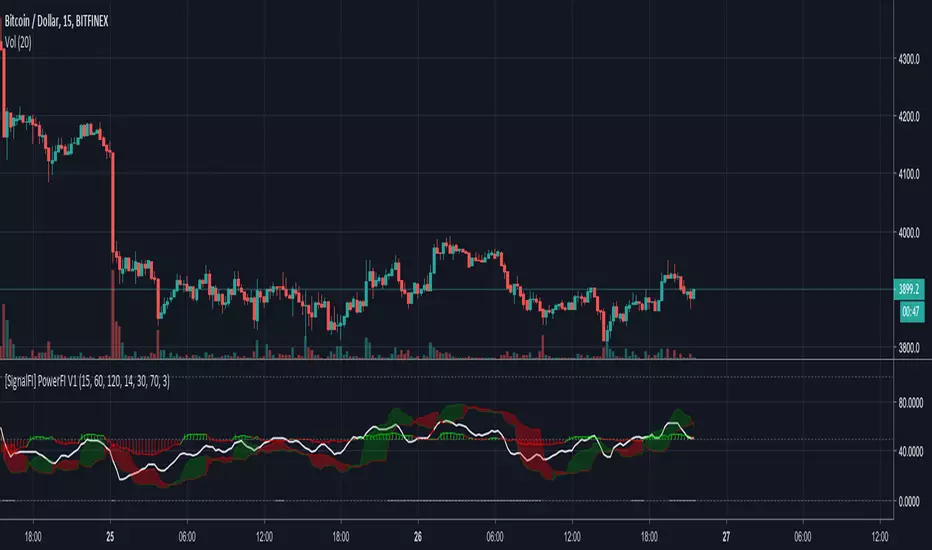
[SignalFI] PowerFI V1.0 [Alerts]PowerFI is a multidimensional RSI that gives you insight into price momentum and trend crossovers via price statistics and rates of change.
MUTLTIPLE-TIMEFRAME RSI
DIFFERENCE STATISTICS COMBINED WITH RSI MOMENTUM
RSI IMPULSE STRENGTH HISTOGRAM
ALERTS VERSION Only for Jedi and Master Subscribers
SignalFI was created to help traders and investors to effectively analyze the market based on the Golden Mean Ratio (Fibonacci numbers), plan a trade and ultimately execute it. To help inform and educate market decisions we developed a set of Trading Indicators which are available on TradingView , the most advanced and yet easy to use charting platform available on the web.
SignalFI indicators are just that, indicators. Our indicators are generally configured to use completely historical data (negating repaint), and we advise all alerts created with SignalFI indicators to be fired upon "close" of the current candle. Our indicators can provide valuable context and visualization support when performing market analysis and executing buy and sell decisions. However. we are not financial experts, and all information presented on this site or our other media outlets are for educational purposes only.
For subscription information, visit www.signalfi.net and follow us on twitter.
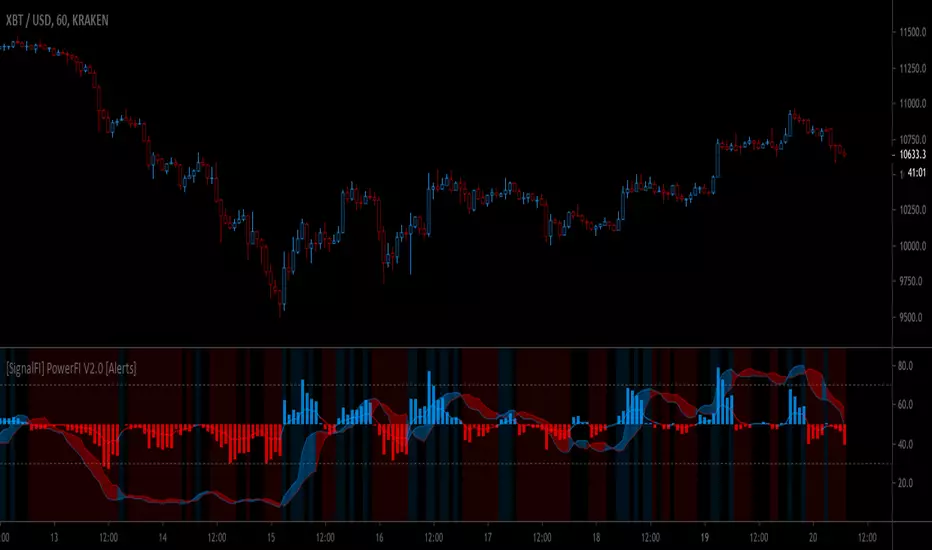
[SignalFI] PowerFI V1PowerFI is a multidimensional RSI that gives you insight into price momentum and trend crossovers via price statistics and rates of change.
MUTLTIPLE-TIMEFRAME RSI
DIFFERENCE STATISTICS COMBINED WITH RSI MOMENTUM
RSI IMPULSE STRENGTH HISTOGRAM
SignalFI was created to help traders and investors to effectively analyze the market based on the Golden Mean Ratio (Fibonacci numbers), plan a trade and ultimately execute it. To help inform and educate market decisions we developed a set of Trading Indicators which are available on TradingView , the most advanced and yet easy to use charting platform available on the web.
SignalFI indicators are just that, indicators. Our indicators are generally configured to use completely historical data (negating repaint), and we advise all alerts created with SignalFI indicators to be fired upon "close" of the current candle. Our indicators can provide valuable context and visualization support when performing market analysis and executing buy and sell decisions. However. we are not financial experts, and all information presented on this site or our other media outlets are for educational purposes only.
For subscription information, visit www.signalfi.net and follow us on twitter.