Exhaustion [Lite]EXHAUSTION — Lite is a simplified sequential exhaustion instrument based on a Hull Moving Average with a 9-count structure. It is designed to expose when continuation begins to weaken, not to call tops or bottoms. The Lite version shows local exhaustion pressure only (LTF/MTF).
What the Lite Version Shows
HMA-based trend state (Green / Red)
Sequential counting up to 9
Local exhaustion points in the current timeframe
What it does not include:
No higher-timeframe structure
No dashboard or multi-timeframe context
Those layers are intentionally removed.
How to Use (Lite Workflow) :
Core Idea :
Continuation weakens as the count progresses.
The higher the count, the less reliable continuation becomes.
Basic Reading
Counts 1–3 → early continuation
Counts 4–6 → trend aging
Counts 7–9 → exhaustion risk
A 9 marks pressure — not a guaranteed reversal.
Practical Usage :
Trend Context (Single Timeframe)
Stay aligned with the HMA color
Treat late counts (7–9) as risk, not signals
Avoid entering fresh positions late in the sequence
Timing Awareness
Exhaustion matters most near:
prior highs/lows
liquidity zones
session extremes
The Lite version is about awareness, not execution precision.
Important Note :
Exhaustion — Lite does not show higher-timeframe exhaustion or alignment.
Without HTF context, exhaustion should be treated as local pressure only. If you want: HTF interaction and a multi-time frame dashboard, that belongs to the Full indicator.
*This script doesn't constitute investment advice and isn't created solely for qualified investors.
Tdsequential

DeMARK 9-13For the first time ever, the power and precision of DeMARK is now available on TradingView. Combining core elements of the renowned Sequential® and Combo® studies, the DeMARK 9-13® indicator delivers the same unique insights in a streamlined interface.
The Sequential and Combo family of indicators have been trusted by the top financial firms, funds and figures for decades to enhance their trading and investment strategies. Known for their 9 Setup® and 13 Countdown® readings, these studies are designed to highlight potential market reversals as well as key areas of support, resistance and momentum. With DeMARK 9-13, users can access these groundbreaking techniques in one integrated offering.
While it's often said, "the trend is your friend," it's also crucial to recognize when it's about to end. Identifying potential market inflection points allows you to buy weakness and sell strength, improving your cost basis, reducing risk and allowing you to capitalize on a greater portion of the reversal.
At its core, 9s and 13s are constructed to measure market momentum and exhaustion. Both Sequential and Combo consist of two phases: Setup and Countdown. The Setup phase compares price activity across nine consecutive bars to define the market environment, while the Countdown phase performs a separate 13-bar comparison to indicate when a reversal may be imminent. A 9-13 reading reflects the fulfillment of both phases. When combined with TDST® lines and Risk Levels®, this approach provides a more comprehensive view of the market.
The DeMARK 9-13 indicator consists of:
Sequential
Combo
9 Setup
13 Countdown
TD Setup Trend (TDST)
Perfected® Setup
Risk Levels & Zones
Together, these elements provide an unparalleled view into the inner workings of the market, helping you anticipate shifts and act with greater precision.
🟡 DESCRIPTION
SETUP
The initial stage of the DeMARK 9-13 indicator is the Setup phase. This series is the same for both Sequential and Combo and compares the close of the current bar to the close four bars earlier. Buy Setup counts are displayed in blue below the data set and fulfilled when there are nine consecutive closes less than the close four bars earlier. Sell Setup counts are displayed in blue above the data set and fulfilled when there are nine consecutive closes greater than the close four bars earlier.
During the active Setup, all number counts remain visible to show the progress of the series. Upon completing the Setup, the 9 is recorded and the 1-8 counts are removed. This reduces visual distraction and allows for more result history (due to TradingView’s 500-label limit). Setups are always counting, with Price Flips® occurring as the series alternates between Buy and Sell Setups.
PERFECTED SETUPS
Setups can be classified as either “Perfected” or “Imperfected.” The Setup is Perfected when the 9 is completed and the 6 and 7 bars have been exceeded. In the case of a Buy Setup, the low of bars 8 or 9 must be less than the low of bars 6 and 7. Conversely, in the case of a Sell Setup, the high of bars 8 or 9 must be greater than the high of bars 6 and 7. The point at which the Setup is perfected is displayed with a solid blue dot, matching the color of the Setup series.
Generally speaking, the market will reverse or stabilize within one to four bars of a completed and Perfected Setup 9. The strength and duration of this response can be assessed with the implementation of other indicators, such as TDST® lines.
TD SETUP TREND (TDST)
The TDST indicator is derived from the Setup phase and is used to confirm market trends and identify likely trend failures. A TDST resistance line is drawn from the highest true high of the completed 9 Buy Setup series, while a TDST support line is drawn from the lowest true low of the completed 9 Sell Setup series. These TDST lines provide an indication of market support, resistance and momentum to help evaluate the integrity of the move.
TDST lines are displayed in a lighter blue than the Setup phase. When Breakout Qualifiers are enabled, TDST lines can be considered qualified or disqualified. Disqualified TDSTs appear as a dashed line, indicating potential support in the case of TDST support lines or resistance in the case of TDST resistance lines. Qualified TDSTs appear as a solid line and will stop drawing when a breakout or breakdown occurs, suggesting continued momentum.
COUNTDOWN
Once the Setup phase is completed, the second stage of the DeMARK 9-13 indicator can begin — the Countdown phase. Sequential and Combo share the same Setup series, but there are subtle differences in their respective Countdown phases, each constructed to identify areas of potential trend exhaustion in different market conditions.
Sequential is designed to respond in both trending and consolidating markets, while Combo is more responsive in trending environments and inactive during periods of market consolidation. For that reason, we often say that Combo identifies the highest or lowest points of a move, with Sequential identifying secondary tests. When aligned, these results are even more powerful.
SEQUENTIAL COUNTDOWN
A Sequential Buy Countdown is possible upon completion of a Buy Setup and looks for 13 closes less than or equal to the low two bars earlier. Sequential Buy Countdown counts are displayed as a dark green number below the data set and can begin as early as the 9 bar of a completed Buy Setup. A Sequential Sell Countdown is possible upon completion of a Sell Setup and looks for 13 closes greater than or equal to the high two bars earlier. Sequential Sell Countdown counts are displayed as a dark red number above the data set and can begin as early as the 9 bar of a Sell Setup. Because of this overlap, Sequential Countdown requires as few as 12 bars beyond the 9 Setup to complete the cycle.
Unlike the Setup phase, Countdown counts need not be consecutive. During the active Countdown, all number counts remain visible to display the progress of the series. Upon completing the Countdown, the 13 is confirmed and the 1-12 counts are removed. This reduces visual distraction and allows for more result history (due to TradingView’s 500-label limit).
A completed Sequential 13 Countdown marks the fulfillment of the 9-13 reading and identifies potential market exhaustion. Additional elements of Sequential Countdown like Intersection, Countdown Deferral, Risk Levels and the 12-bar rule can be used to provide further detail and are outlined below.
COMBO COUNTDOWN
A Combo Buy Countdown is possible upon completion of a Buy Setup and looks for 13 closes less than or equal to the low two bars earlier, with additional rules based on the Combo version selected. Combo Buy Countdown counts are displayed as a light green number below the data set and can begin as early as the 1 bar of a completed Buy Setup. A Combo Sell Countdown is possible upon completion of a Sell Setup and looks for 13 closes greater than or equal to the high two bars earlier, with additional rules based on the Combo version selected. Combo Sell Countdown counts are displayed as a magenta number above the data set and can begin as early as the 1 bar of a Sell Setup. Because of this overlap, Combo Countdown requires as few as four bars beyond the 9 Setup to complete the cycle.
Unlike the Setup phase, Countdown counts need not be consecutive. During the active Countdown, all number counts remain visible to display the progress of the series. Upon completing the Countdown, the 13 is confirmed and the 1-12 counts are removed. This reduces visual distraction and allows for more result history (due to TradingView’s 500-label limit).A completed Combo 13 Countdown marks the fulfillment of the 9-13 reading and identifies potential market exhaustion. Additional elements of Combo Countdown like Risk Levels and the 12-bar rule can be used to provide further detail and are outlined below.
RISK LEVELS
When a 9 Setup or 13 Countdown indication is recorded, a Risk Level is generated to identify the zone within which a reversal should occur. This level accounts for any residual trend momentum without invalidating the buy or sell indication. For a completed buy indication, the Risk Level marks the price above which the 9 or 13 remains active and serves as additional support. Conversely, for a completed sell indication, it marks the price below which the 9 or 13 remains active and serves as additional resistance. This level can be viewed as the maximum threshold the indication can withstand before the prevailing momentum overwhelms and negates it and is often used to establish stop-loss areas.
Risk Level line colors correspond to the completed Setup, Sequential Countdown or Combo Countdown that generated it. Shaded risk zones can also be displayed, further highlighting the indication window. When Breakout Qualifiers are enabled, the Risk Level can be considered qualified or disqualified. Disqualified Risk Levels appear as a dashed line, indicating likely support in the case of a buy indication and likely resistance in the case of a sell indication. Qualified Risk Levels appear as a solid line and will stop drawing when a breakout or breakdown occurs, suggesting continued momentum.
4-BAR & 12-BAR METRICS
Generally speaking, the market should see some sort of response within four bars of a completed 9 Setup indication and 12 bars of a completed 13 Countdown indication. If the chart has not responded in that time the existing trend is likely to continue.
INTERSECTION
Intersection is an elective setting unique to Sequential Countdown. When enabled, it postpones the start of the Countdown phase until the price range of the later Setup counts overlap with the price activity of any Setup count occurring three or more bars earlier. This is intended as a pressure release to avoid commencing the count during an extraordinary breakaway market event or aberration. The Intersection level’s color matches its corresponding Buy and Sell Countdown reading and is displayed as a horizontal line on the confirming bar.
COUNTDOWN DEFERRAL
The Sequential Countdown phase of the DeMARK 9-13 indicator includes two optional Countdown Deferral qualifiers — the 13 vs. 8 rule and the 8 vs. 5 rule.
The 13 vs. 8 Countdown Deferral rule is designed to ensure that the tail end of the Countdown is representative of the existing trend. To fulfill this restriction, the low of the 13 bar must be less than or equal to the close of the 8 bar in the case of a Sequential Buy Countdown, while the high of the 13 bar must be greater than or equal to the close of the 8 bar in the case of a Sequential Sell Countdown. Because Countdown counts can increment in a sideways market, this rule helps to confirm that a trend has remained intact and improves accuracy as the series reaches its completion.
When enabled, this Countdown Deferral condition substitutes a “+” for what would otherwise be a “13,” thereby postponing the count. A Sequential Buy Countdown deferral is displayed in dark green below the data set, while a Sequential Sell Countdown deferral is displayed in dark red above the data set. Note that this optional setting is enabled by default and labeled “Last vs. 8 Qualifier” in the DeMARK 9-13 indicator settings.
Whereas the 13 vs. 8 rule is designed to ensure that the tail end of the Sequential series is representative of the existing trend, the 8 vs. 5 Countdown Deferral rule is designed to ensure that the body of the Countdown phase is properly configured. As with the 13 vs. 8 rule, the 8 vs. 5 rule matches the color and placement of its corresponding Buy or Sell Countdown series and substitutes a "+" for what would otherwise be an "8," thereby postponing the count. The 13 vs. 8 comparison is critical to the Countdown phase, while the 8 vs. 5 comparison is elective and provides additional confidence that the trend has remained intact.
COUNTDOWN RECYCLE®
Markets are constantly evolving to reflect new information. Just as fundamentals experience occasional adjustments impacting the expectations of the asset, so too do technical analysis and market timing. This is most often reflected in the Sequential and Combo Countdown phase by a process known as Recycling.
Recycling occurs when a Countdown 13 is interrupted by a subsequent overlapping “22” Setup count in the same direction. Recycling suggests that the new Setup is sufficiently strong to weaken the impact of a confirmed Countdown series and resets the process. A recycling indication is represented as an “R” where the Countdown 13 was previously displayed, matching the color and placement of that Buy or Sell Countdown series.
COUNTDOWN CANCELLATION
Once completed, a 9 Setup and 13 Countdown confirmation is permanent and never altered. However, it’s important to note that Countdowns can be cancelled during their construction phase. There are two scenarios where a Countdown series would be removed from the chart.
The first Countdown cancellation scenario occurs when a subsequent 9 Setup is confirmed in the opposite direction prior to the completion of the Countdown phase. The reasoning is that market conditions have changed from what they were when the initial Setup was fulfilled, making the newer Setup more relevant. Upon confirming an opposing 9 Setup, the incomplete Countdown phase is canceled and removed from the chart.
The second Countdown cancellation scenario takes place when the TDST in the opposite direction is violated, suggesting a conclusion to the previous trend and a confirmation of a new one. In these cases, a true low that occurs above the Buy Setup’s TDST resistance line, or a true high that occurs below the Sell Setup’s TDST support line, cancels the incomplete Countdown phase and removes the counts from the chart.
🟡 SETTINGS
DISPLAY
Setup : Displays the Setup phase of the Sequential and Combo indicators. The first swatch controls the color of the Buy Setup phase displayed below the data set. The second swatch controls the color of the Sell Setup phase displayed above the data set.
TDST : Displays the TDST lines for the Sequential and Combo indicators. The first swatch controls the color of the TDST resistance lines associated with the Buy Setup phase. The second swatch controls the color of the TDST support lines associated with the Sell Setup phase.
Sequential Countdown : Displays the Countdown phase of the Sequential indicator. The first swatch controls the color of the Buy Countdown phase displayed below the data set. The second swatch controls the color of the Sell Countdown phase displayed above the data set.
Combo Countdown : Displays the Countdown phase of the Combo indicator. The first swatch controls the color of the Buy Countdown phase displayed below the data set. The second swatch controls the color of the Sell Countdown phase displayed above the data set.
Indicator font size : Adjusts the size of the Sequential and Combo indicator counts displayed above and below the data set. ( Default: 18 )
Display full series count : Displays the full Sequential and Combo numerical series for the active 9 Setup and 13 Countdown phases only, or for all completed indications (within TradingView’s 500-label limit). ( Default: Active only )
SETUP
Bars to Setup : Number of consecutive bars needed to complete the Setup phase. ( Default: 9 )
Bars to look back : Defines the bar to which the current Setup count is compared. ( Default: 4 )
Setup compare : Determines whether equal prices should increment the Setup count. ( Default: Without equal )
Count completion weight : Adjusts the font weight of the Setup completion counts displayed above and below the data set. ( Default: Bold )
Setup Perfection : Identifies when Setup Perfection occurs, with the low of the final two Buy Setup counts less than the lows three or four bars prior to completion, and the high of the final two Sell Setup counts greater than the highs three or four bars prior to completion. With the default “Bars to Setup” setting of “9,” Perfection occurs when the low of Buy Setup bar 8 or 9 is less than the lows of bars 6 and 7, and the high of Sell Setup bar 8 or 9 is greater than the highs of bars 6 and 7. ( Default: Enabled )
Enable Setup Risk Level : Displays the Risk Level tied to the Setup. ( Default: On )
Enable Setup Risk Level Zone : Shades the area between the completed Setup and its Risk Level. ( Default: On )
TD SETUP TREND (TDST)
TDST line thickness : Adjusts the thickness of TDST support and resistance lines. ( Default: Standard )
COUNTDOWN (SHARED)
Bars to Countdown : Number of bars needed to complete the Countdown phase. ( Default: 13 )
Bars to look back : Defines the bar to which the current Countdown count is compared. ( Default: 2 )
Countdown comparison value : Output used in the Countdown look back comparison. For Aggressive settings, Low/High is required. ( Default: Close )
Termination Count price value : Allows the final count of the Countdown phase to use a different comparison value for more flexibility. ( Default: Open or Close )
Countdown compare : Determines whether equal prices should increment the Countdown count. ( Default: With equal )
Count completion weight : Adjusts the font weight of the Countdown completion counts displayed above and below the data set. ( Default: Bold )
SEQUENTIAL COUNTDOWN
Enable Intersection : Toggles the Sequential Intersection phase requirement. ( Default: Off )
8 vs. 5 Qualifier : Qualifier requiring the low of the 8 Buy Countdown to be less than the close of the 5 count, and the high of the 8 Sell Countdown to be greater than the close of the 5 count. ( Default: Off )
Last vs. 8 Qualifier : Qualifier requiring the low of the final Buy Countdown count to be less than the close of the 8 count, and the high of the final Sell Countdown to be greater than the close of the 8 count. With the default “Bars to Countdown” setting of “13,” the low of the 13 Buy Countdown would need to be less than the close of the 8 count, and the high of the 13 Sell Countdown would need to be greater than the close of the 8 count. ( Default: On )
Enable Risk Level : Displays the Risk Level tied to the Countdown. ( Default: On )
Enable Risk Level Zone : Shades the area between the completed Countdown and its Risk Level. ( Default: On )
COMBO COUNTDOWN
Combo version : Determines the version of Combo used for the Countdown phase, whether it’s Standard, Conservative or Aggressive. ( Default: Standard )
Enable Risk Level : Displays the Risk Level tied to the Countdown. ( Default: On )
Enable Risk Level Zone : Shades the area between the completed Countdown and its Risk Level. ( Default: On )
RECYCLE
Enable Recycle : Toggles Recycling, replacing the final Sequential and Combo Countdown count with an “R” when its rules are met. With the default “Bars to Countdown” setting of “13,” a recycled 13 count would be replaced with the ‘R’. ( Default: On )
Setup Count : Defines the number of consecutive Setup bars required to trigger a Recycle. ( Default: 22 )
CANCEL
Reverse Setup : Incomplete Countdowns are cancelled when a Setup in the opposite direction is confirmed. ( Default: On )
TDST Rule : Incomplete Buy Countdowns are cancelled when a true low exceeds the Buy Setup’s TDST resistance line, and incomplete Sell Countdowns are cancelled when a true high breaks the Sell Setup’s TDST support line. ( Default: On )
BREAKOUT QUALIFIERS
Enable Breakout Qualifiers : Breakout Qualifier rules will dictate whether TDST and Risk Level line breakouts can be considered qualified or disqualified. Qualified lines are solid and will stop drawing when a breakout or breakdown occurs, suggesting continued momentum. Disqualified lines are dashed, serving as resistance in the case of a false breakout and support in the case of a false breakdown. When Breakout Qualifier rules are disabled, a line becomes solid on any close beyond the level. ( Default: On )
🟡 DISCLAIMER
By subscribing to and or using DeMARK 9-13 or any other DeMARK Indicators on TradingView, you acknowledge that you have read, understood and agree to the DeMARK for TradingView Terms of Service (located in the DeMARK account signature) as well as any updates to those terms which may happen from time-to-time.
The DeMARK Indicators are powerful tools designed to assist the individual process you use to understand financial markets and make investment decisions but they are not trading systems. Any information presented is not, and should not be construed as, financial or investment advice. You should not make any investment decision based solely on the information provided by these tools. The products we offer do not recommend or endorse any specific securities, financial products or investment strategies. Any information, data or analysis presented by any DeMARK products or tools is generic and does not consider your personal financial situation, investment objectives or risk tolerance. All investment decisions are yours alone and are made at your own risk. Those risks include, but are not limited to, potential system errors, data inaccuracies or outages.
From time to time unauthorized and unaffiliated third parties use the DeMARK name or the names of our copyrighted and/or trademarked products in an unapproved, inaccurate and misleading manner. While we do our best to remove these examples, some fake, flawed and fraudulent may exist. The only official and accurate sources of our products are those listed on the DeMARK company website. Unauthorized reproduction, copying, scraping, republishing, distribution, dissemination or any other use of our name, trademarks and/or copyrighted materials (including this script documentation) is prohibited.
Without in any way limiting DeMARK’s exclusive rights under copyright, trademark and all other intellectual property protections, any use of DeMARK products to “train” generative artificial intelligence (AI) technologies to generate text is expressly prohibited. DeMARK reserves all rights to license uses of this work for generative AI training and development of machine learning language or machine learning visual models.
The data and analysis in our products are based on sources believed to be reliable, but DeMARK does not control or guarantee the accuracy, completeness or timeliness of this information.
As a DeMARK subscriber or user, you are responsible for conducting your own research and due diligence before making any investment decisions.
Past performance, including any simulated or historical data, is not indicative of future results.
Paid script

Favorite Signals w/EMA FilterThe script combines my favorite signals then filters them with three EMAs.
Via the Style tab, you can choose to either have the signals color the bar and/or plot a shape above/below.
All signals can be turned off via the Inputs tab, which will remove the bar color and/or shape (if not already off in the Style tab) as well as remove the pattern from the alerts function.
Remember when using TV alerts, if you change the script settngs, you must create a new alert if you wish to be alerted for the changes you've made.
LONG/SHORT SIGNALS INCLUDED FOR:
- TD8s
- TD9s
- Hammer
- Shooting Star
- Bullish Harami
- Bearish Harami
- RSI Divergences
EMA FILTER LOGIC LONGS:
- Price < Fast EMA & Med EMA > Slow EMA = Possible Long Entry
- Price > Fast EMA & Med EMA > Slow EMA = Possible Reversal, Tighten Stop or Reduce Position
EMA FILTER LOGIC SHORTS:
- Price > Fast EMA & Med EMA < Slow EMA = Possible Short Entry
- Price < Fast EMA & Med EMA < Slow EMA = Possible Reversal, Tighten Stop/Reduce Position
Big up to @spdoinkal, @HPotter, @LonesomeTheBlue, for writing the originals scripts for the signals above.
Enjoy!
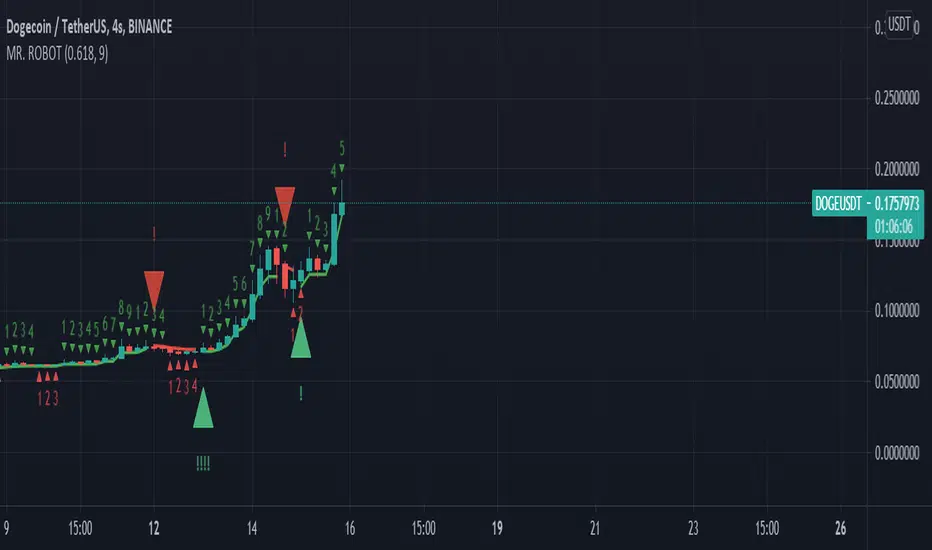
MR. ROBOT v.1.0.0This script consists of a logical blend of TD Sequental, MACD and Stochastic RSI based on the Supertrend function. In addition, these indicators use the golden proportional point of each candle as a source.
The exclamations on the signal indicating signs express the strength of the signal and consist of four levels;
! : Weak level signal
!! : Partial level signal
!!! : Medium signal
!!!! : High level signal
The fact that these interjections refer to four different levels is related to the programmatic consideration of four different indicators and functions. Since the script is based on four different indicators
basically, the exclamation numbers of the signals are related to how many indicators are signaling at the same time. However, it does not always overlap. For example, when 3 indicators signal at the same time, 3 exclamation points may not appear on the signal sign. This is because the script also takes into account special bar algorithms.
The only setting that you can intervene on the script - for now - is the multiplier and length values of the supertrend function. Changing these settings changes the signal strengths and frequencies. The script is based on the supertrend function alone, it is the ability to follow the trend after the signals given by the internal indicators. This situation decreases the rate of false signals and frequent signals in internal indicators.
This script or its author is not responsible in any way for any profits or losses arising from transactions. Does not contain investment advice.
Moving Averages (21, 55, 200) with Parabolic SAR and Support/ ReA Simple indicator combining 3 of the most popular simple moving averages; (21,55, 200) with a tweaked Parabolic SAR as well as recent support & resistance points.
Developed to help see key areas of interest on COINBASE:BTCUSD quickly without needing to draw many manual trendlines in order to trade breakouts or bounces at key levels. But should be useful for any market.
This indicator is best used in combination with oscillators such as the MacD or RSI and also volume.

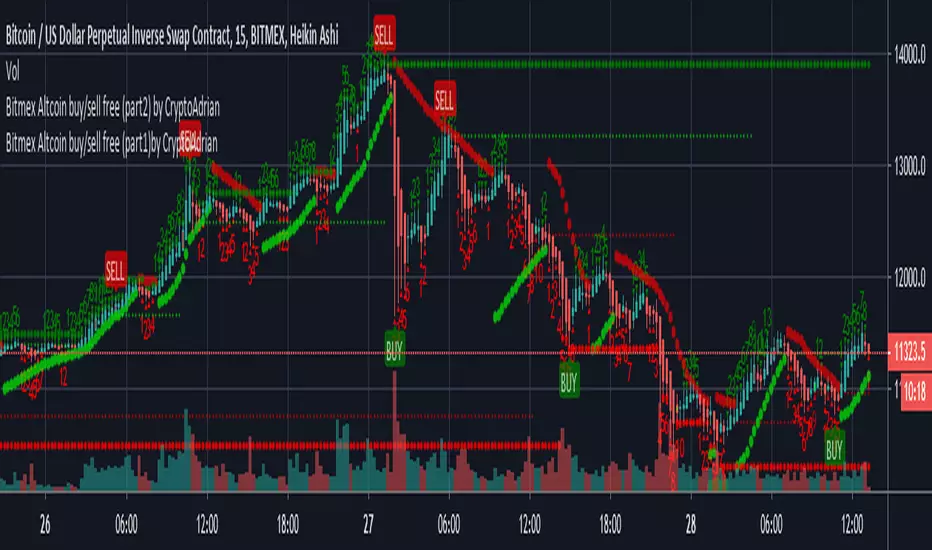
Bitmex Altcoin buy/sell free (part1) by CryptoAdrianThis script has two parts Bitmex Altcoin buy/sell free (part1) by CryptoAdrian and Bitmex Altcoin buy/sell free (part2) by CryptoAdrian
Combination of two will give you better results with clarification.
(soon will be published as one script)
For better results observe it for some time. If you didn't get how to use it PM me I will brief you :)
Hope you will like this. For any detail or doubts you can PM me on TV. I will try to reach you out ASAP .
Part 1
Part 2
Part 1 + Part 2
Please add this script to your fav so incase you find it difficult to find it can be seen in your fav and you will get it.
Thank You and happy trading :)
FK-MagicFK-Magic Indicator for Short term trades and best for scalping
if you need nay help about it just DM me....

Sequential ProHello Fellow Traders!
-------------------------------------------
This is the newest addition to Gnome Alerts PRO!
This Bot Script works on all Crypto, Leverage, Forex, & Traditional Exchanges.
FEATURES
------------------------
*Autoview Ready*
- Easy to Use
- Backtesting Included
- Stop Loss
More info on how gain access in my profile!

ALPHA: ExhaustionPLEASE READ THE ENTIRE POST BEFORE USING THE ALPHA EXHAUSTION INDICATOR
Capital Exhaustion Cycles
What is capital exhaustion? To explain it simply: Picture you are working out and eventually hit fatigue, at that point your body signals that you can no longer proceed and need to rest. Capital exhaustion with tradable assets (stocks, cryptocurrencies, etc.) occurs the same way. At some point, the market collectively becomes fatigued. Unable to push an asset a certain direction (can be bullish or bearish) the market reverses the direction of the trending price which results in a correction. This is natural & how markets need to work to keep an equilibrium true to the assets value. Being able to measure this in your analysis can be extremely valuable in deciding where to base your trades.
There are some indicators out there such as the TD Sequential (created by Tom Demark) that attempt to measure the exhaustion rate and identify potential capital shifts. I began to use the TD Sequential around 2012 when a colleague of mine sent me an article from Bloomberg on this theory used to measure exhaustion. The theory goes like this: If a candle within a trend is higher (or lower in the case of a bear trend) than the fourth candle back then the trend continues. By Tom Demark's theory the ninth candle is typically where the trend reverses and one must watch for a potential entry on a capital shift. There is a few factors that go into trading the TD Sequential (in addition to other elements he created for measuring such) that we wont get into, I'll explain why....
After using the TD for some years now I have found the reliability and use of it for analysis to be semi-flawed. Yes, there is trend reversals at some of the parameters Tom Demark outlined, but overall I have found the sequential part of it to not only be difficult to use, but also inaccurate to an extent that makes me uncomfortable when factoring it into my analysis. Yes, there are many successful traders that have used the TD in their analysis and have had great success with it. However, I feel the theory behind it can be improved and the visuals of it can be altered to be more user friendly.
This put me on a search for a more reliable and facile method to measure capital exhaustion. There is nothing perfect with Technical Analysis, if there was, one could theoretically own the entire market over time, so I approached this task with that in mind. As I begin to explain my ALPHA: Exhaustion indicator keep this in mind: Nothing can be perfected when it comes to measuring the predictability of human psychology and markets. However, I believe I have found a way to measure capital exhaustion in a clean, accurate, and easy to understand method. Applying this indicator to an analysis can greatly improve the accuracy, reliability and speed of an analyst. I've also added some really neat "safety precautions" to the indicator to indicate when an already confirmed trend is showing weakness (such as chop) or a premature reversal.
That being said, I introduce to you a new series of indicators created in my digital moon lab with a team of analysts: ALPHA
The ALPHA series will launch with this indicator first. From here I will be introducing a whole series of improved indicators to add to your analysis techniques. Bigger shake ups coming soon in the world of volume and strength oscillators. ;)
Introduction
My approach with the ALPHA: Exhaustion is simple, color the candles on a gradient scale based on my exhaustion method for an analyst to easily identify the rate of exhaustion. Additionally, add simple features that help confirm whether a trend has a confirmed beginning and ending. Furthermore I took it a step further and added features that detect weakness in a confirmed trend and give you early indications that the trend may reverse or cancel .
Keeping the advanced analyst in mind I also added options to identify unconfirmed trend beginnings and aggressive endings. These parameters are loose and designed for the analyst who has the comfort of being an aggressive trader. I will get into those options last as they are extremely speculative. The default options on the indicator are designed to show confirmed trends. As you play with this indicator you will discover that many times a wild swing has happened but the indicator was unable to identify it. The reason being is it is meant to identify CONFIRMED trends & be used with other indicators during an analysis, not just used for signals or independently of other analysis tools.
There are many factors that go into an assets price movement, exhaustion, volume, strength, momentum and more, it is unreasonable to think that one should base their analysis off of one of those factors alone. Technical analysis is like a puzzle, you have many puzzle pieces and its impossible to see the entire picture of the puzzle until you fit all those pieces together.
Candle Coloring
Seen below we have a clear trend beginning, the candles begin their normal color of green, as the trend continues the gradient of the white becomes brighter indicating exhaustion.
As the trend continues the indicator identifies that the market is exhausting and colors the candles a brighter white. (see below)
Eventually once the trend exhausts the indicator identifies & confirms the exhaustion and reverts back the coloring in real time as price adjusts. But wait there is more!
Safety Symbols
There is an option to turn the safety symbols off and on as can be seen in this link below:
imgur.com
This option does two things. The first is it adds half crescents to the top or bottom of a trend like the image below.
These half crescents indicate that the trend is beyond normal exhaustion parameters but is still continuing. At this point, this is where I pay attention and watch for the crescents to disappear. When the crescents disappear the candle coloring will change back to normal indicating that trend has confirmed as exhausted. It is entirely possible to have one or two candles of chop and then it continues but generally it has meant exhaustion criteria. One feature I have added is once the crescents disappear the indicator watches for a confirmed trend reversal to begin and will paint an arrow showing the trend reversal confirmation. We will get into that later though.
The second feature of the safety symbols is the risk line. The option also enables the risk line of the prior trends top. (See image below)
If a trader were to find entries of a confirmed trend based on the indicator painting the confirmed trend arrow (will explain further down) then one could place their stop loss there, but proper analysis should be done and decided upon by the user . (Keep in mind this is an indicator for analysis, not a signal generating system, please be sure to read the disclosures on my website www.thetradingwizard.com and also the disclosure at the end of this post)
Confirmed Trend
By default the indicator paints a pink (for downtrend confirmation) or blue (uptrend) arrow on a confirmed trend reversal after exhaustion of a prior trend.
The arrow paints in real time as the criteria is met of an exhausted trend on the third candle. Once the prior trend is exhausted (can happen with or without the crescent safety (or pay attention) symbols. The design of it can sometimes be late in an assets movement, but its meant to be a confirmed trend at that point.
Trend End
Additionally, after a confirmed trend beginning the indicator watches for weakness or a trend ending criteria match. When it identifies such, the indicator paints a pink or blue (depending on the direction) stop sign.
These trend endings can come in two forms, the indicator has realized trend exhaustion has occurred and is going to reverse very near, or it has identified weakness in capital exhaustion and paints the symbol to let you know the trend is either going to reverse, or chop. (sideways with no clear trend) Below is examples of when the indicator identified the weakness early in real time after a trend start confirmation.
As can be seen above the indicator confirmed an uptrend and then later identified weakness in the trend indicating an early termination before the risk line was hit. It is typically early (by design) but there is an option for a more aggressive trend ending. This has less confirmation protocols built in when enabled, I will explain that in the next section.
Aggressive Trend End
Seen in the link here is the Aggressive trend end option:
imgur.com
This option loosens the rules & parameters for a trend ending and gives a more aggressive view of a trend end. This is for aggressive analysts that would like a less confirmed trend ending.
Aggressive Unconfirmed Trend
Another option that can be enabled is Aggressive Trend arrows. In order to use this you must enable Aggressive Trend Ending:
imgur.com
What this option does is identify in real time early trends that are unconfirmed . You will get a lot of arrows painted with this option enabled but it is designed for analysts who take a more aggressive & unconfirmed approach to trading.
Conclusion
I wanted to create a more accurate and easy to use indicator for identifying exhaustion cycles, I believe this does so. That being said, it is extremely important to note as I did in the intro that this is an analysis tool, simply a piece to add to your analysis arsenal. Never rely on one piece of information for analysis as technical analysis is a complex art that requires many data inputs. This indicator can be used on all time frames with all tradable assets.
This indicator is available for TradingView users on my web site www.thetradingwizard.com for $99, that includes a life time subscription. Everybody that uses this indicator will get a private group class with it that I will schedule sometime next week (3/4/19-3/8/19) to explain various methods this can be used with analysis and answer any questions the users may have. If you purchase after those dates I will still send the class recording. Additionally I will be doing a public stream on my YouTube either tonight or tomorrow introducing this. Enjoy and trade safe!
www.thetradingwizard.com
Disclaimer
Nothing in this post is to be used or construed as financial advice. The indicator is not a signal generating indicator and should not be used to trade off of solely. This post is meant as an educational post to explain the functions of the indicator.

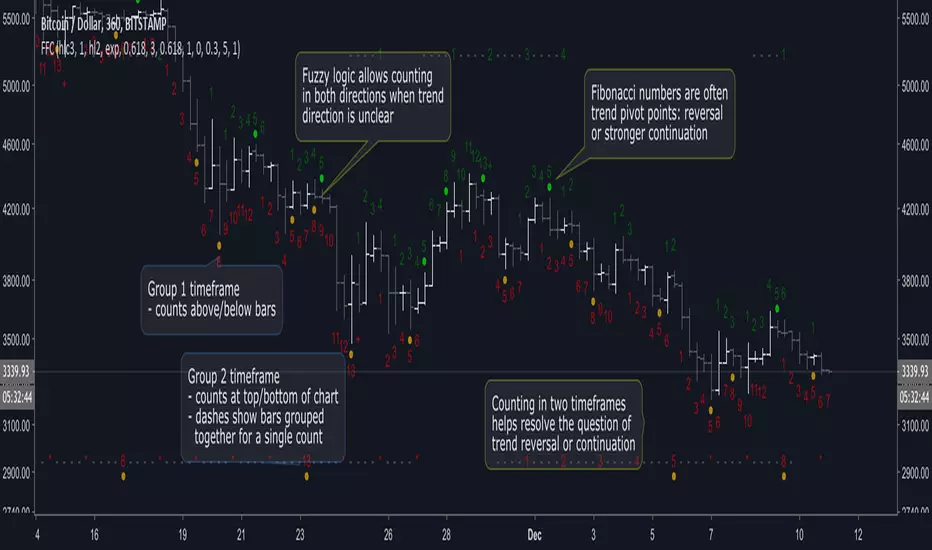
Fuzzy Fib CountsA new approach to trend/time analysis. This indicator counts up/down price moves using fuzzy logic in two time frames. Counts reaching Fibonacci numbers are often significant to trend momentum: either reversal or stronger continuation. See the script’s beginning comments for details.
I’m amazed with DeMark and all his indicators. But after coding a TD_Sequential script, I began to wonder if there wasn’t an easier way to identify high probability entry/exit points without all the intricate logic. It took awhile, but a different paradigm eventually came into focus: Fuzzy Fib Counts (FFC).
FFC is like “analog” compared to TD_Sequential’s “digital” approach. And FFC is much simpler: no buy/sell/perfected/deferred signals, just up/down counts. It’s uncanny how often a trend is refocused at Fibonacci numbers, but like TD_Sequential… it’s not perfect! As with all indicators, consult your intuition, before pulling the trigger.
The default values have been effective for me in Bitcoin (and I’m surprised how well it works in smaller time frames). However, for less volatile markets, you may need to reduce the fuzz level and/or adjust the filter (averaging) parameters.
FFC has been helpful to me. Hope it helps you too! If so, donations appreciated… Thanks!
BTC: 36FdUcETrwmGxt5qazq7Bo7kad9kuNawMF
LTC: MJYHzwJYjsnB35dzb5L9hCpqZf8RyqViEm
ETH: 0x3db7557bea61ca4c096c6ed7bdb2a0d69e455fe1
Looking for trailblazers to help explore new possibilities… Add constructive comments below!
Melak's All In One indicator(AIO)This script the following indicators.
Support and Resistance (lines)
MACD Crossover (Crossing arrow under each candle where MACD crosses)
50, 100, 200 Simple Moving Averages (orange lines)
10, 20 Exponential Moving Averages (turquoise and pink lines)
Doji reversals (turquoise candles)
Inside Bar (white diamonds under each inside bar candle)
TD time indicator (numbers on top of candles)

Time Indicator*This is a private script for Personal Use. To avoid any Trade Mark violations, the official math rules have been slightly optimized & name changed.
The Time Indicator gets its inspiration from the classic and trademarked work of Tom Demark (with one of the biggest differences being the elimination of the "Price Flip" being a necessary condition to start a "Setup"). The Indicator only displays values on the most recent 13 candles unless unless the count has something critically like 9. You should be very familiar with traditional trading techniques & the Tom DeMark's indicators in order to follow this one & also understand how it is different. Here is a very good presentation on it as part of Bloomberg's Market Essentials Trading Education Series .
The Chart below displays the features of the Indicator, but it is still a work in progress, additional features will be added soon in future updates.
