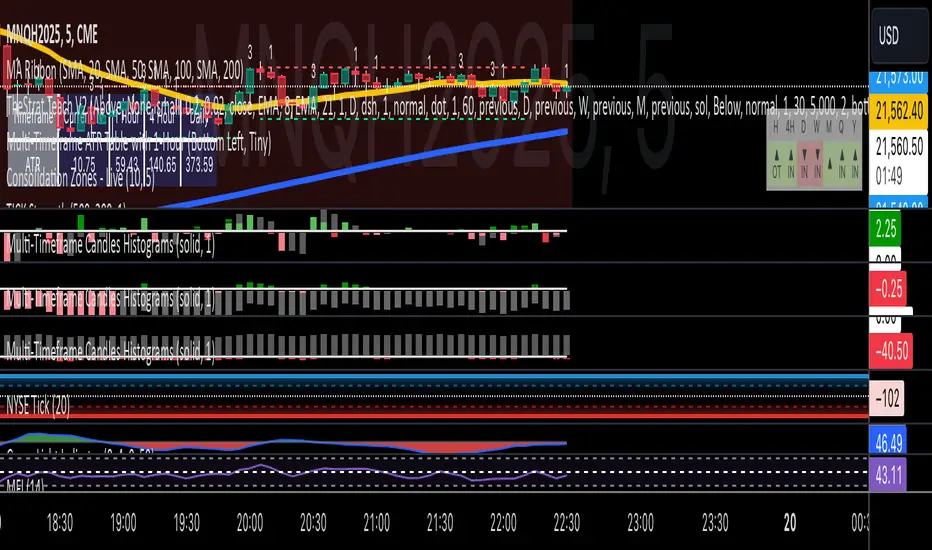
Multi-Timeframe Candles HistogramsAt some community members' requests, I have built on the original code to make it a single indicator with the option for users to check off which timeframes they want to be shown. Choices are 1-hour, daily, weekly, and monthly.
I couldn't figure out how to separate each timeframe into its own histogram, so this is the best I can offer at the moment. If any community member wants to take a crack at it, be my guest.
Colors are customizable.
If you have a paid TW account, you can lay it down twice and put the hour and daily on one and the weekly and monthly on the other.
That said, I hope you enjoy this version of this indicator.
R.I.P. Rob Smith, creator of TheStrat.
---
Key Features and Benefits
1. Custom Timeframe Selection:
- Choose from an array of timeframes ranging from minutes to months, giving you complete flexibility in your market analysis.
- Quickly switch between different timeframes (e.g., 1-hour, daily, or weekly) to track continuity across varying levels.
2. Visual Representation of High/Low Markers:
- Enable or disable the display of high and low points to better understand price ranges and reversals.
- These markers allow you to spot key turning points on different timeframes, facilitating better entry or exit decisions.
3. Enhanced Candle Visualization:
- Displays candles with precise price levels aligned to your chosen timeframe, giving a clearer view of price trends.
- Candles are color-coded to reflect price movement, which is customizable by the user.
---
How to Use This Indicator
Monitor Multiple Timeframes Simultaneously:
- Place the indicator on your chart and choose the timeframes you want to follow (e.g., hourly, daily, weekly, monthly).
- For each instance, checkmark the desired timeframes in the menu to ensure that you’re tracking the right period.
Achieve Timeframe Continuity:
- By aligning lower timeframes with higher ones, this tool helps you confirm trends, detect reversals, and avoid trades that go against the broader market movement.
---
Why This Indicator is Valuable for Traders
This tool simplifies a core principle of TheStrat—full timeframe continuity—by visually representing price action across multiple timeframes in a clear and actionable way. It removes the guesswork and helps traders stay in sync with market momentum, regardless of the timeframe they are analyzing.
This solution offers flexibility, clarity, and speed, enabling traders to quickly grasp critical movements and improve decision-making. Whether you are a scalper focusing on intraday moves or a swing trader watching weekly trends, this tool empowers you to maintain alignment with the overall market structure.
In essence, it brings the power of TheStrat to your fingertips by offering precise and easy-to-read visual aids, allowing you to seamlessly apply Rob Smith’s philosophy to your trading.
Timeframecontinuity
Dynamic Open Levels# Dynamic Open Levels Indicator v1.0
Release Date: November 5, 2024
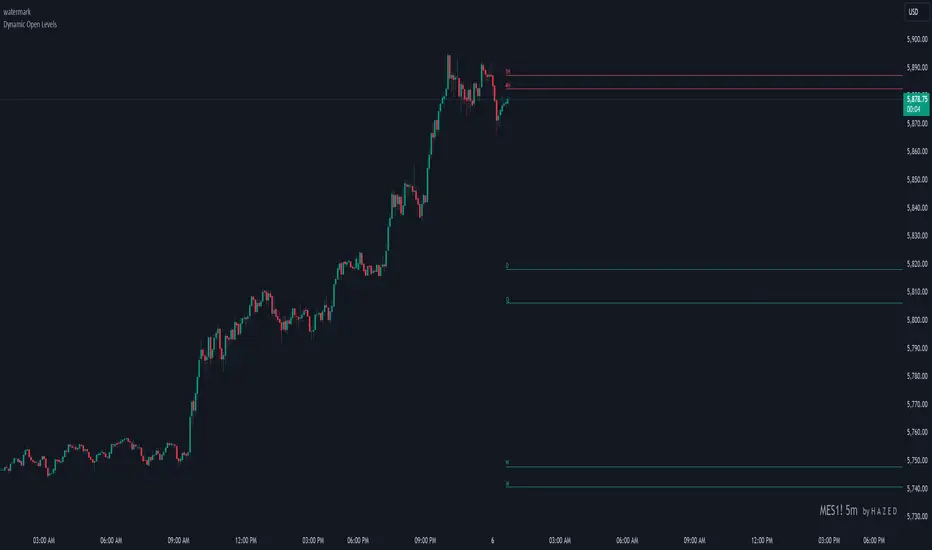
Introducing the Dynamic Open Levels indicator on TradingView! This tool helps traders visualize and analyze key opening price levels across multiple timeframes, making your market analysis more effective.
---
### Key Features
- Multiple Timeframes : Yearly, Quarterly, Monthly, Weekly, Daily, 4H, and 1H levels available.
- Visibility Controls : Easily toggle visibility for each timeframe to suit your trading style.
- Line Customization : Set custom thickness and colors for lines, making charts easy to interpret.
- Monthly: Purple
- Weekly: Blue
- Daily: Green
- 4H: Red
- 1H: Orange
- Dynamic Coloring : Lines adjust color based on market conditions—teal for bullish (`rgb(34, 171, 148)`) and coral for bearish (`rgb(247, 82, 95)`).
### Labels & Customization
- Real-Time Labels : Each level is labeled for easy identification (e.g., Y for Yearly, Q for Quarterly).
- Label Settings : Customize opacity, text color, size, and position for clarity without cluttering your chart.
- Sizes : Choose from tiny, small, normal, large, to huge.
- Offset : Set labels from 1 to 10 to position them precisely.
- Color Management : Organize all colors under a dedicated Line Colors group for easy adjustments.
### Advanced Plotting & Performance
- Real-Time Updates : Levels are updated dynamically with the latest open prices.
- Extended Lines : Lines extend to the right, offering a consistent reference for future price movement.
- Optimized Performance : Handles up to 500 lines efficiently to maintain smooth performance.
---
### Installation Instructions
1. Add to Chart :
- Go to the Indicators section in TradingView.
- Search for Dynamic Open Levels and add it to your chart.
2. Customize Settings :
- Line Thickness : Adjust to suit your preference.
- Visibility : Toggle timeframes like Yearly, Monthly, Weekly, etc., as needed.
- Labels : Configure opacity, text color, size, and offset under the Label Settings group.
---
### Documentation & Support
For guidance on using the Dynamic Open Levels indicator, visit our Documentation (#). If you need assistance, check out our Support Channel (#).
---
Thank you for choosing Dynamic Open Levels . Stay tuned for future updates that will continue to improve your trading experience!
H A Z E D
The Strat with TFC & Combo DashIntroduction:
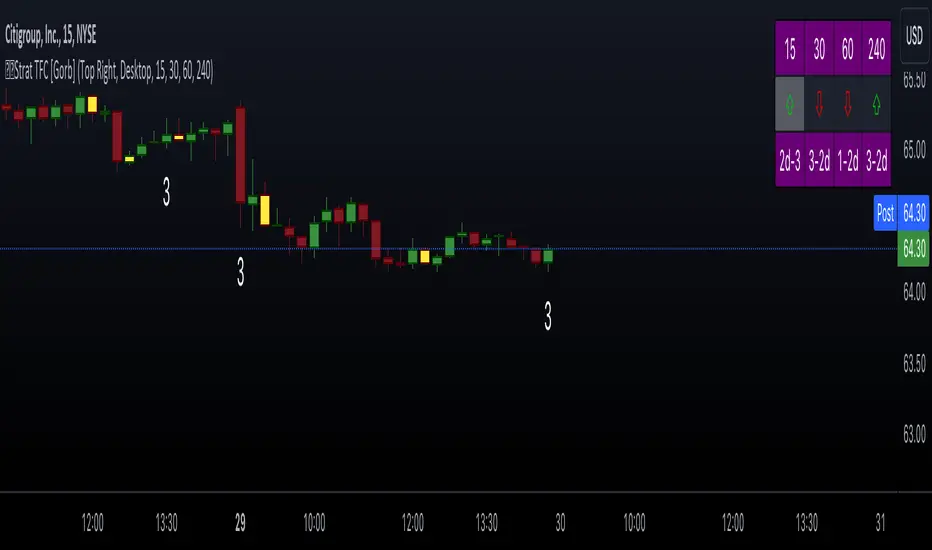
This indicator is designed to implement "The Strat" trading strategy combined with a Timeframe Continuity Dashboard and Combo Dashboard. The Strat is a robust trading methodology that relies on price action and candlestick formations to make trading decisions. This script helps traders to identify specific bar types such as Inside Bars (1), Continuation Up Bars (2u), Continuation Down Bars (2d), and Outside Bars (3) across multiple timeframes. It visually highlights these bar types on the chart and provides a comprehensive dashboard displaying the current state of the selected timeframes.
Key Features:
Timeframe Continuity Dashboard: Displays arrows and bar types for up to four selected timeframes.
Strat Combos Dashboard: Shows the previous and current bar types to easily spot trading setups.
Customizable Colors and Labels: Options to personalize the colors and labels for Inside and Outside bars.
Adjustable Dashboard Position and Size: Allows users to set the location and size of the dashboard for better visual alignment.
Inputs:
TFC & Combo Dash Configuration:
Show TFC & Combo Dashboard: Toggle to display the dashboard.
Show Strat Combos: Toggle to display Strat combo setups.
Location: Dropdown to select the position of the dashboard on the chart.
Size: Dropdown to choose between desktop and mobile view.
Timeframe Selection:
Timeframe 1: Primary timeframe for analysis.
Timeframe 2: Secondary timeframe for analysis.
Timeframe 3: Tertiary timeframe for analysis.
Timeframe 4: Quaternary timeframe for analysis.
Candle Visuals:
Show Inside Bar Label: Option to show label instead of color for Inside bars.
Inside Bar Color: Color picker for Inside bars.
Show Outside Bar Label: Option to show label instead of color for Outside bars.
Outside Bar Color: Color picker for Outside bars.
TFC & Combo DashboardFunctions:
The script fetches values for the selected timeframes and computes the bar types and corresponding visual elements such as arrows and background colors. The dashboard displays this information in a tabular format for easy reference during trading.
The dashboard is dynamically created based on user input for position and size. It shows the selected timeframes, bar types, and combo setups, providing a quick overview of the market conditions across multiple timeframes.
Timeframes: Displays the four user chosen timeframes that the dashboard fetches data from.
Arrow and Color: Functions to set the arrow direction and color based on current bar action. Green and up arrow: price is above it's candle open.
Red and down arrow: price is below it's candles open.
Background Color: Functions to set background color based on the bar type. White for an outside bar(3), yellow for an inside bar(1), no color for a continuation bar(2).
Strat Candle Combos: Functions to determine if the bar is an Inside(1), Continuation Up(2u), Continuation Down(2d), or Outside bar(3). Shows the previous bar and the current bar for the user's chosen timeframes.
Candle Visuals:
The script plots labels and colors for Inside and Outside bars based on user preferences. It helps in quickly identifying potential trading setups on the chart.
Conclusion:
We believe in providing user-friendly tools to help speed up traders technical analysis and implement easy trading strategies. The Strat with TFC & Combo Dashboard is a tool to assist traders in identifying potential trading setups based on The Strat methodology; to suit the users needs and trading style.
RISK DISCLAIMER
All content, tools, scripts & education provided by Gorb Algo LLC are for informational & educational purposes only. Trading is risk and most lose their money, past performance does not guarantee future results.
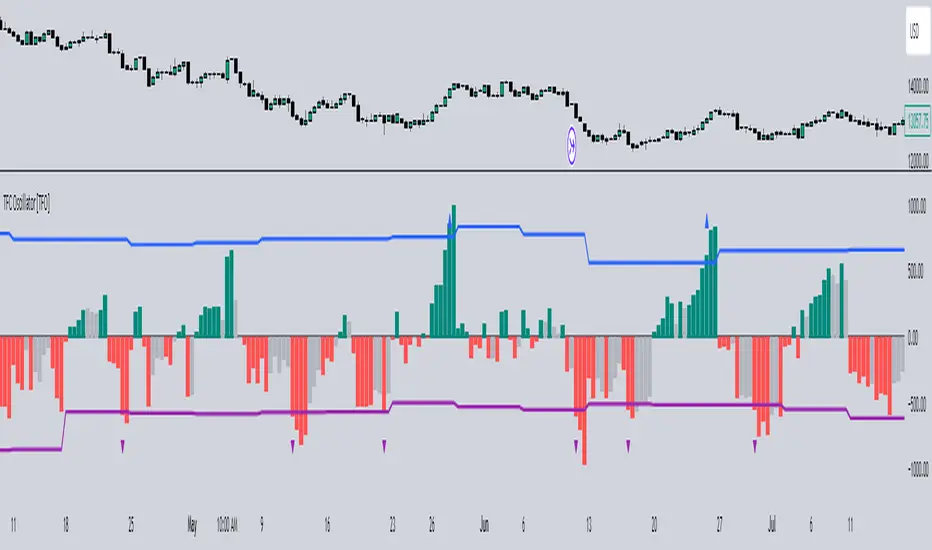
Timeframe Continuity Oscillator [TFO]This indicator is used to visualize timeframe continuity - a core concept of "The Strat" - along with some added logic for potential range limiters.
When discussing timeframe continuity, typically we are evaluating several timeframes to see if price is trading above or below the current open of each respective timeframe. If we are concerned with the 15m, 4h, and 1D for example, and price is trading above the current open of each of those timeframes, we can say that we have full timeframe continuity (FTFC) up. Conversely, if price is trading below the current open of each of those timeframes, we can say that we have FTFC down.
We can visualize this with an oscillator of sorts, where the zero line is anchored to the open price of the highest timeframe that we're concerned with. Using the prior example, this would be the 1D timeframe. As long as price is above the current 1D open, it is impossible to have FTFC down; and as long as price is below the current 1D open, it is impossible to have FTFC up. This is why we base the oscillator's values off of the highest timeframe's open (the values are simply how far price has traded from this open) - any value greater than zero tells us that there is potential to have FTFC up, and any value less than zero tells us that there is potential to have FTFC down.
There are a few ways we chose to visualize this data. First, we can choose the "Binary" option which simply uses one solid bullish color above the zero line, and one solid bearish color below the zero line.
Second, we can choose the "Gradient" option to help describe whether we have FTFC up or down. Values above the zero line will be a mix of the bullish color and mid color, where the mid color indicates no timeframe continuity up and the bullish color indicates FTFC up - sort of like a color spectrum of timeframe continuity to describe how many timeframes are in agreement. Similarly, values below the zero line will be a mix of the bearish color and the mid color, where the mid color again indicates no timeframe continuity down and the bearish color indicates FTFC down.
Lastly, we can choose the "FTFC Only" option which will only color the histogram bars as bullish if there is FTFC up, or bearish if there is FTFC down.
One more feature that we added is these upper and lower bands that aim to help describe the potential upper and lower limits that price may travel, relative to the highest timeframe's open. This is done by taking the standard deviation of some defined lookback period, for example, 2 standard deviations of the previous 10 weeks, assuming 1W is the highest timeframe enabled.
The concept is similar to that of an ADR (average daily range) as it can be used to estimate maximum range extensions for the largest timeframe. The arrows you see are plotted once the value exceeds either band - alerts can be enabled for these events as well through any alert() function call.
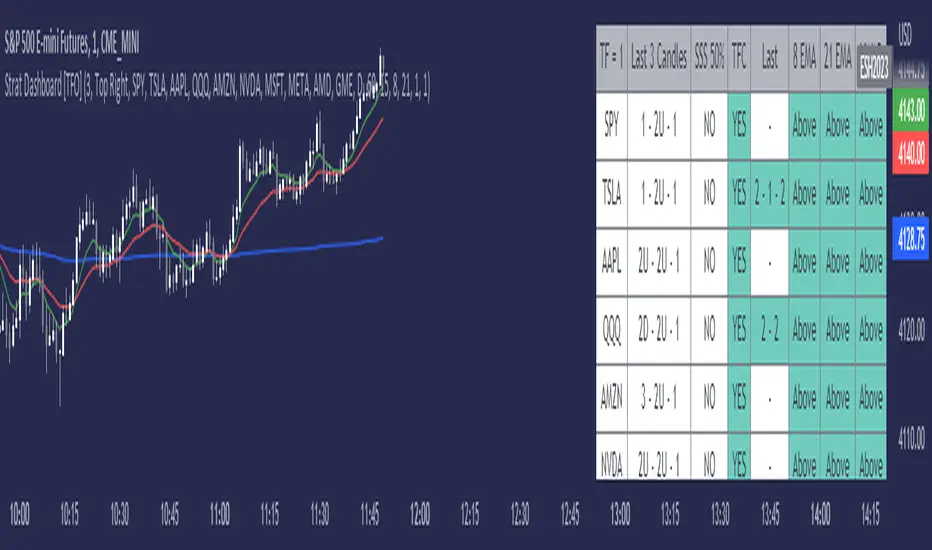
Strat Dashboard [TFO]The Strat Dashboard tracks up to 10 signals while highlighting common strat reversal patterns, the SSS 50% rule, timeframe continuity, and some additional criteria with VWAP and moving averages.
With the strat, all price action bars/candles are simplified into 3 total possibilities: 1 (inside bar), 2 (a bar that takes the previous bar's high OR low), and 3 (outside bar). The first table column for Last X Candles shows the most recent candles according to this notation, for example, 1 - 2D - 2U. This would mean we had an inside bar, followed by a bar that took the previous bar's low, followed then by a bar that took the previous bar's high. Note that the colors in this column are set according to whether the current bar's close exceeds the previous bar's high/low. By default, these colors are green if above the previous bar's highs, or red if below the previous bar's lows. If the current close is in between the previous candle's high and low (even after already taking the prior high or low), no color will be applied.
The SSS 50% column shows a yes or no value for whether the current bar aligns with the SSS 50% rule, where a bar has taken either the previous high or low, and has since reversed to at least the midway point of the previous bar's height - essentially anticipating a 2 that may become a 3 (outside bar).
Timeframe continuity (TFC) shows a yes or no value for when the current candle on multiple timeframes are all green or red (above the open price or below the open price, respectively). For example, if you were looking at the current 15m, 1h, and 1D bars, and they were all above the open price, you could say there's TFC between all three timeframes. As of the initial release, you can select up to 3 different timeframes. The table values will only be true when all selected timeframes are in alignment. When setting alerts, first deselect the timeframes if you don't want TFC logic to impact alerts.
The "Last" column shows the last strat reversal pattern that was confirmed (after the last bar closes). Waiting for a candle close is the safer option since a 2 can turn into a 3; however for higher timeframes, it may be beneficial to make an update to this indicator in which you can have live alerts as well (not waiting for a candle close). You can select which strat reversals you want to be shown from the settings. Various strat reversals may be selected for alerts of type "Any"; for example, if setting up an alert for "Any" strat reversal on Symbol 1, then this alert will go off when any of the *selected* strat reversals occur for that specific symbol. Deselect any strat reversals that you don't want to be included in these alerts.
Lastly, the EMA and VWAP columns simply show whether price is above or below said value. This tracks the current candle close, and may repaint/change several times if the current bar is oscillating above and below these values.
Timeframe Continuity [TFO]Simple timeframe continuity indicator - see whether the selected timeframes are currently above or below their opening prices. Allows up to 10 different timeframes to be used.

[BM] HTF Candle Evolution█ OVERVIEW
This script shows how a higher timeframe candle evolves over time.
It was created as a visual aid to #TheStrat and provides a new way of looking at Timeframe Continuity.
█ FEATURES
General
HTF: Higher Timeframe selection with dropdown and ability to manually input a timeframe that is not present in the dropdown.
Label: Show a label with the selected higher timeframe.
Marker: Shows a marker symbol at the start of each new higher timeframe.
Align: Aligns the candles around a selected center line.
The Strat
Multi-timeframe analysis is used extensively in #TheStrat (created by Rob Smith), so the ability to add #TheStrat coloring has been made available.
Scenario: Define the colors for the strat scenario's.
Coloring of: Choose which part of the candles you want the selected strat scenario colors to be applied to.
Band: Display a band that shows the active strat scenario color of the selected higher timeframe.
All features are completely customizable.
