RATIO TPI SOLETH | JeffreyTimmermansSOLETH Ratio Trend Probability Indicator
Medium-Term Trend Assessment | Dominant Major Detector: The SOLETH Ratio TPI is a medium-term trend-following tool designed to measure the performance relationship between Solana and Ethereum — two of the leading smart contract platforms in the crypto market. By tracking the SOLETH ratio, this indicator determines which of the two is acting as the dominant major in the current market environment.
Rather than focusing on absolute price movements, the SOLETH Ratio TPI isolates relative strength. An upward-trending ratio means Solana is outperforming Ethereum, while a downward trend means Ethereum is taking the lead.
Key Features
Dominant Major Identification:
The indicator’s primary function is to determine leadership between Solana and Ethereum:
SOL Dominant: SOLETH ratio trending up
ETH Dominant: SOLETH ratio trending down
Neutral: No clear leader
8 Trend-Following Inputs:
Integrates 8 carefully selected medium-term trend-following signals into a composite score for clarity and accuracy in dominance detection.
Score-Based Regime Classification:
Score > 0.1 → SOL in relative uptrend → Dominant Major: SOL
Score < -0.1 → ETH in relative uptrend → Dominant Major: ETH
Between -0.1 and 0.1 → Neutral → No clear dominance
Dynamic Visual Interface:
Background colors change according to the dominant asset.
Bottom dashboard displays the status of all inputs, the composite score, and the determined dominance label.
Use Cases:
Smart Contract Sector Rotation: Identify leadership shifts between Solana and Ethereum to guide allocation within the L1 ecosystem.
Sector Sentiment Insight: Dominance changes often precede broader capital flows into or out of each ecosystem.
Multi-Timeframe Confirmation: Combine with broader market LTPI and MTPI tools to reinforce conviction in rotation-based strategies.
Conclusion
The SOLETH Ratio TPI condenses the competition between two of crypto’s top smart contract platforms into one clear, actionable view. By aggregating 8 powerful medium-term trend-following inputs, it delivers a precise assessment of which chain currently leads the market.
Tpi

RATIO TPI SOLBTC | JeffreyTimmermansSOLBTC Ratio Trend Probability Indicator
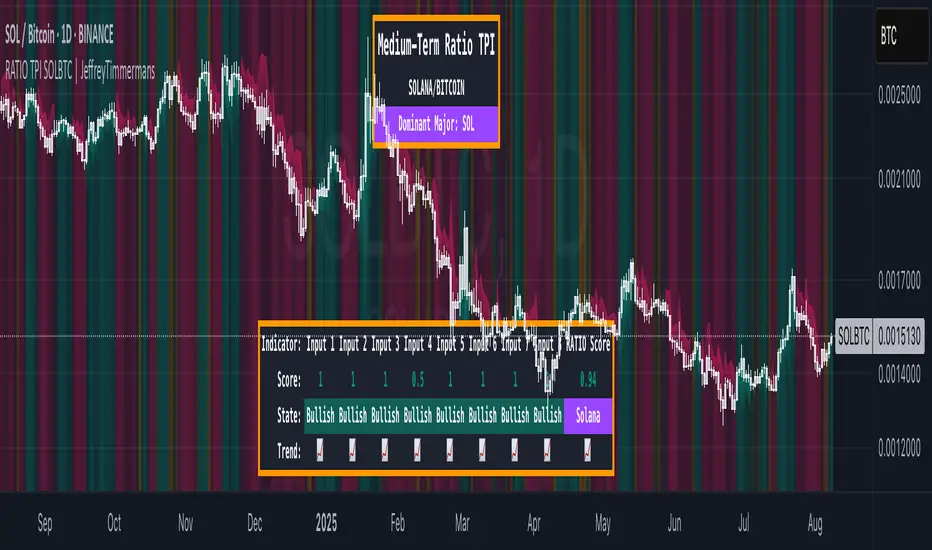
Medium-Term Trend Assessment | Dominant Major Detector: The SOLBTC Ratio TPI is a medium-term trend-following indicator designed to measure the relative strength between Solana and Bitcoin — two of the most influential assets in the crypto market. By analyzing the SOLBTC ratio, this tool identifies which of the two is currently the dominant major in the market cycle.
Unlike standard price-based analysis, this indicator focuses on relative dominance. When Solana outperforms Bitcoin, the ratio trends upward, signaling SOL dominance. When Bitcoin outperforms Solana, the ratio trends downward, signaling BTC dominance.
Key Features
Dominant Major Identification:
The primary goal of this TPI is to determine whether Solana or Bitcoin is leading the market:
SOL Dominant: SOLBTC is trending up
BTC Dominant: SOLBTC is trending down
Neutral: No clear leader in the current cycle
8 Trend-Following Inputs:
Combines 8 carefully selected medium-term trend-following indicators into a single composite score for clear and actionable dominance detection.
Score-Based Regime Classification:
Score > 0.1 → SOL in relative uptrend → Dominant Major: SOL
Score < -0.1 → BTC in relative uptrend → Dominant Major: BTC
Between -0.1 and 0.1 → Neutral → No clear dominance
Dynamic Visuals:
Background colors shift to match the dominant asset
Bottom dashboard displays the state of each input, the composite score, and the resulting dominance label
Use Cases:
Rotation Strategies: Identify when capital is rotating between Solana and Bitcoin to optimize positioning.
Market Leadership Signals: Use dominance changes as a leading indicator for broader altcoin cycles and sentiment shifts.
Multi-Timeframe Confirmation: Pair with LTPI and STPI for higher conviction in directional bias.
Conclusion
The SOLBTC Ratio TPI distills the relationship between Solana and Bitcoin into one simple question: Who is leading right now? By combining 8 powerful trend-following inputs into a clear dominance score, it provides traders and investors with a precise, medium-term view of market leadership.
RATIO TPI ETHBTC | JeffreyTimmermansETHBTC Ratio Trend Probability Indicator
Medium-Term Trend Assessment | Dominant Major Detector: The ETHBTC Ratio TPI is a medium-term trend-following indicator designed to measure the relative strength between Ethereum and Bitcoin — the two most dominant assets in crypto. By analyzing the ETHBTC ratio, this tool provides insights into which of the two is currently leading the market trend.
Unlike absolute price indicators, this tool tracks relative dominance. When Ethereum outperforms Bitcoin, the ratio trends upward, signaling ETH dominance. When Bitcoin outperforms Ethereum, the ratio trends downward, signaling BTC dominance.
Key Features
Dominant Major Identification:
The core purpose of this TPI is to determine which asset — Ethereum or Bitcoin — is the dominant major in the current crypto cycle.
ETH Dominant: ETHBTC is trending up
BTC Dominant: ETHBTC is trending down
Neutral: No clear directional edge
8 Trend-Following Inputs:
The indicator aggregates 8 hand-picked, medium-term trend-following metrics into a single score that simplifies the ETHBTC trend assessment.
Score-Based Regime Classification:
Score > 0.1 → ETH is in relative uptrend → Dominant Major: ETH
Score < -0.1 → BTC is in relative uptrend → Dominant Major: BTC
Between -0.1 and 0.1 → Neutral trend → No clear dominance
Dynamic Visuals:
Background color adapts to the dominant asset
Score, trend state per input, and composite result are shown in a clean dashboard
Use Cases:
Rotation Strategy Insight: Understand whether capital is flowing into Ethereum or Bitcoin to adjust your portfolio positioning accordingly.
Dominance-Based Macro Timing: Use the dominance shift as a leading signal for broader altcoin cycles.
Multi-Timeframe Confirmation: Combine with LTPI (Long-Term) and STPI (Short-Term) to build directional conviction.
Conclusion
The ETHBTC Ratio TPI is a highly focused tool that simplifies the complex relationship between Ethereum and Bitcoin into one clear output: who is currently leading the crypto market. With 8 inputs driving a composite trend score and a dynamic dominance label, this indicator is essential for anyone looking to time ETH vs BTC rotations with precision.

MTPI SUI | JeffreyTimmermansMedium-Term Trend Probability Indicator
The "Medium-Term Trend Probability Indicator" on SUI is a custom-designed tool created to analyze SUI from a medium-term perspective. While short-term indicators often respond to quick fluctuations and long-term models focus on broader macro cycles, the MTPI sits perfectly in between—detecting trend shifts over multiple weeks and helping traders and analysts stay ahead of the curve.
This specific version of the MTPI is applied to SUI, making it a dedicated trend-following tool for this unique digital asset, tuned to reflect its own volatility and structural behavior.
Key Features
Medium-Term Focus:
The MTPI is optimized for trend tracking over medium horizons—typically weeks to a few months. It filters out noise while remaining responsive to meaningful directional changes.
6 Input Signals:
The model combines 6 carefully selected input trend-following indicators, each targeting different dimensions of trend strength and continuation.
Market Regimes:
The MTPI classifies market conditions into:
Bullish → Strong upward momentum and trend confirmation
Bearish → Sustained downward pressure and breakdown signals
Neutral → Mixed signals or transition phases, often seen in consolidations or early reversals
Visual Background:
The chart background shifts based on the active regime. This provides instant visual clarity on whether the asset is trending, reversing, or consolidating.
Indicator Dashboard:
At the bottom of the chart, the MTPI includes a live dashboard showing:
The state of all 6 inputs (Bullish, Bearish, Neutral)
The composite MTPI Score
The resulting Market Trend classification
How It Works
Input Signal Logic:
Each input returns one of three possible scores:
+1 = Bullish
-1 = Bearish
0 = Neutral
Score Aggregation:
The MTPI Score is calculated as the average of all 6 input values:
Score > +0.1 → Bullish regime
Score < -0.1 → Bearish regime
Between -0.1 and +0.1 → Neutral regime
Background Coloring:
The background changes automatically to match the current trend regime, making it visually easy to interpret the dominant market environment.
Use Cases
Mid-Term Strategy Alignment:
Use the MTPI to align with the dominant medium-term market direction on SUI.
Rotation & Momentum Detection:
Catch early signs of reversals, breakout expansions, or trend exhaustion.
Multi-Timeframe Integration:
Combine MTPI with short-term tools (STPI) or long-term indicators (LTPI) for a complete market overview.
Dynamic Alerts:
Bullish Alert: MTPI Score crosses above +0.1
Bearish Alert: MTPI Score crosses below -0.1
Neutral Zone: MTPI Score enters between -0.1 and +0.1
Conclusion
The MTPI – SUI is a reliable medium-term probability model that simplifies complex market structure into an actionable, color-coded signal system. By distilling 6 intelligent inputs into one combined trend score, it offers clear directional bias and regime classification—crucial for positioning in a volatile asset like SUI. Whether used standalone or as part of a broader trend framework, this indicator enhances clarity, discipline, and precision in your medium-term trading decisions.

MTPI OTHERS.D | JeffreyTimmermansMedium-Term Trend Probability Indicator
The "Medium-Term Trend Probability Indicator" on OTHERS.D is a custom-built model designed to measure the medium-term trend strength of the entire crypto market excluding the Top 10 assets. By focusing on the performance of smaller-cap and emerging cryptocurrencies, this indicator offers a refined view of risk appetite and capital rotation beyond the major players like BTC, ETH, and other top coins.
OTHERS.D (Total Crypto Market Cap Dominance excluding the Top 10) serves as a proxy for altcoin speculation cycles, market breadth, and rotational momentum. The MTPI leverages this by applying 8 carefully selected trend-following indicators to generate a composite probability score that reflects the directional bias of the broader altcoin market.
Key Features
Mid-Term Trend Orientation:
The MTPI focuses on multi-week to multi-month trend phases, filtering out short-term volatility while responding faster than long-term macro models.
8 Input Signals:
Built using 8 trend-following indicators, each measuring trend strength, direction, and persistence within the "OTHERS" segment.
Market Regime Detection:
The MTPI identifies three distinct market states:
Bullish → Clear upward trend in the altcoin market (excluding top 10)
Bearish → Persistent downward movement or weakness in the broader altcoin segment
Neutral → Choppy or indecisive behavior
Background Coloring:
The background dynamically adapts based on the current regime, making it easy to visually identify dominant conditions.
Trend Dashboard:
A dashboard displays:
The current state of all 8 trend signals
The overall MTPI score
The interpreted market regime
How It Works
Trend Signal Evaluation:
Each of the 8 inputs outputs a discrete signal:
+1 → Bullish
-1 → Bearish
0 → Neutral
Composite Score Calculation:
The MTPI score is computed as the average of the 8 inputs:
Score > +0.1 → Bullish regime
Score < -0.1 → Bearish regime
Between -0.1 and +0.1 → Neutral regime
This produces a normalized score from -1 to +1, helping quantify trend confidence and detect early shifts in momentum.
Color-Coded Background:
The score automatically drives the background color:
Green tones for bullish phases
Red tones for bearish phases
Gray/orange tones for sideways conditions
Use Cases
Altcoin Rotation Tracking:
Use MTPI – OTHERS.D to monitor when capital is rotating into or out of smaller-cap cryptocurrencies — a key signal for risk-on or risk-off sentiment.
Medium-Term Positioning:
Perfect for swing traders or trend followers looking to align positions with the dominant trend in the non-top-10 market segment.
Multi-Timeframe Confirmation:
Combine MTPI with other tools like STPI (Short-Term) or LTPI (Long-Term) for enhanced decision-making and better timing across timeframes.
Dynamic Alerts:
Bullish Entry: MTPI score crosses above +0.1
Bearish Entry: MTPI score crosses below -0.1
Neutral Zone: MTPI score moves between -0.1 and +0.1
These alerts help you react quickly to regime shifts in the altcoin market outside the top 10.
Conclusion
The MTPI – OTHERS.D is a focused, probability-based trend tool built for analyzing the non-top-10 segment of the crypto market. By merging 8 independent trend signals into a single composite score and regime model, it provides a clear lens into where capital is flowing and how smaller-cap crypto assets are behaving. An essential tool for anyone active in altcoin trading, rotational strategies, or full-spectrum crypto market analysis.

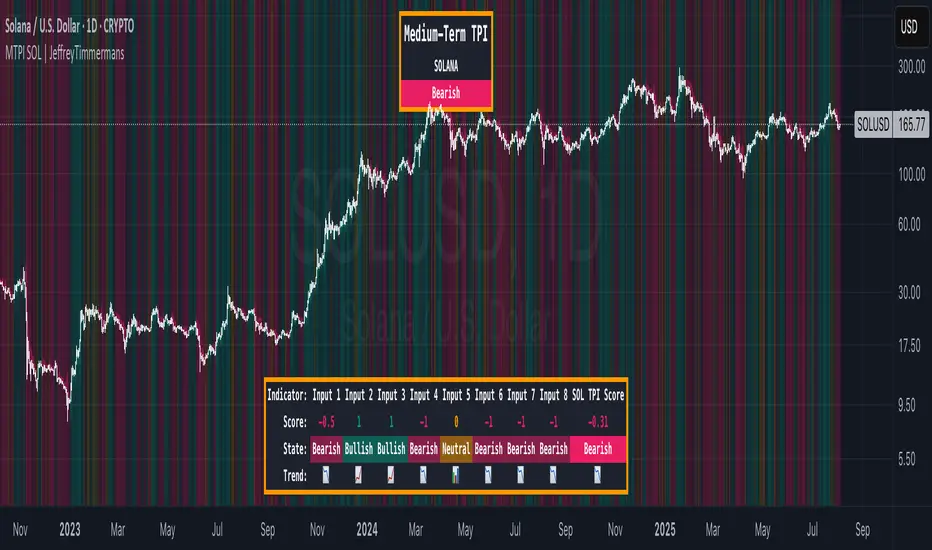
MTPI SOL | JeffreyTimmermansMedium-Term Trend Probability Indicator
The "Medium-Term Trend Probability Indicator" on SOL (Solana) is a custom-built tool designed to analyze Solana (SOL) from a medium-term perspective. Unlike short-term indicators that react quickly to intraday volatility or long-term models that focus on macro cycles, the MTPI is optimized to detect medium-term market trends—capturing key turning points and momentum shifts that unfold over multiple weeks.
This version of the MTPI is applied to SOL, making it a Solana-specific trend-following tool with particular sensitivity to its price behavior and structural dynamics.
Key Features
Medium-Term Focus:
Built to monitor price action over several weeks to months, the MTPI filters out short-term noise while remaining responsive to meaningful trend changes.
8 Input Signals:
The MTPI aggregates 8 carefully selected trend-following inputs, each tuned to reflect mid-cycle behavior in SOL’s price movements.
Market Regimes:
The MTPI classifies market behavior into one of three clear regimes:
Bullish → Momentum and structure align to support a continued uptrend
Bearish → Majority of signals point to trend deterioration or downside momentum
Neutral → Mixed signals, often during consolidation or early transition phases
Visual Background:
The background color shifts dynamically to reflect the active regime—making it easy to visually interpret the prevailing market condition.
Comprehensive Dashboard:
The lower panel displays:
The state of each individual input (Bullish, Bearish, Neutral)
The numerical MTPI Score (average of all 8 signals)
The final Trend Classification (Bullish / Bearish / Neutral)
How It Works
Input Analysis:
Each of the 8 inputs outputs a score based on its internal signal:
+1 = Bullish condition
-1 = Bearish condition
0 = Neutral / indecisive
Score Calculation:
The MTPI Score is calculated as the average of all 8 input signals:
Score > +0.1 = Bullish regime
Score < -0.1 = Bearish regime
Score between -0.1 and +0.1 = Neutral regime
Background Coloring:
Color-coded backgrounds instantly reflect the current trend classification based on the MTPI Score, helping traders stay aligned with the market direction at all times.
Use Cases
Mid-Term Positioning:
Identify strong trend phases on SOL with reduced noise and increased directional clarity.
Confirmation Layer:
Use MTPI as a mid-term confirmation tool alongside short-term setups or long-term macro models (like LTPI).
Rotation or Transition Detection:
Spot key moments when SOL transitions from expansion to contraction phases (and vice versa).
Dynamic Alerts:
Bullish Signal: MTPI Score crosses above +0.1
Bearish Signal: MTPI Score crosses below -0.1
Neutral Zone: MTPI Score enters between -0.1 and +0.1
Conclusion
The Medium-Term Trend Probability Indicator (MTPI – SOL) provides a powerful framework for identifying trend phases on Solana with mid-term relevance. By combining 8 intelligent inputs into a single score and market classification, it offers clarity in times of uncertainty and confidence in times of momentum. Whether used alone or as part of a broader multi-timeframe strategy, the MTPI helps refine entries, exits, and macro alignment in the dynamic world of Solana trading.
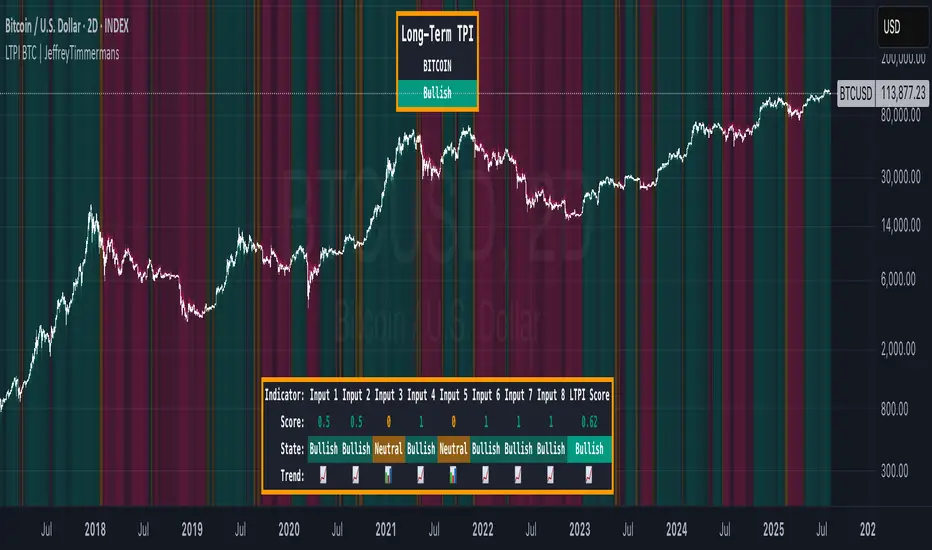
LTPI BTC | JeffreyTimmermansLong-Term Trend Probability Indicator
The "Long-Term Trend Probability Indicator" on BTC is a custom-built tool designed to analyze BTC from a long-term perspective. Unlike short-term indicators that react to price volatility, LTPI focuses on major trend shifts on BTC, and therefore across the entire crypto market, helping to identify major trend shifts early.
This version of the LTPI is applied to BTC, making it a BTC specific trend following tool, but very broad (crypto wise), because BTC is the biggest asset.
Key Features
Long-Term Focus:
Designed for macro market analysis with less sensitivity to short-term noise.
8 Input Signals:
Combines 8 carefully selected inputs (trend following indicators) into a single score that reflects the overall market condition.
Market Regimes:
Classifies the BTC trend into:
Bullish: Strong uptrend, expansion phase
Bearish: Strong downtrend, contraction phase
Neutral: Transitional or uncertain
Visual Background:
Background colors clearly display which regime is active.
Comprehensive Dashboard:
The panel at the bottom shows each input’s state, the composite LTPI score, and the resulting market trend.
How It Works
Inputs Analysis:
Each of the 8 inputs outputs one of three states:
+1 (Bullish)
-1 (Bearish)
0 (Neutral)
Score Calculation:
The total score is the sum of all 8 input signals divided by 8.
Score > 0.1 = Bullish
Score < -0.1 = Bearish
Between -0.1 and 0.1 = Neutral
Background Coloring:
Background colors dynamically adjust to reflect the long-term market regime.
Use Cases
Long-Term Positioning:
Identify periods of global expansion or contraction to position yourself accordingly.
Macro Confirmation:
Use LTPI in combination with medium-term (MTPI) and short-term tools for multi-timeframe confirmation.
Market Timing:
Alerts when LTPI crosses key thresholds help highlight the start of major bullish or bearish phases.
Dynamic Alerts:
Bullish Entry: LTPI score crosses above 0.1
Bearish Entry: LTPI score crosses below -0.1
Neutral Zone: Score moves back between -0.1 and 0.1
Conclusion
The Long-Term Trend Probability Indicator (LTPI – BTC) is a powerful tool for identifying long-term market phases across the entire crypto ecosystem. By focusing on long term trends and combining 8 inputs into a single probability score, it provides a clear macro trend perspective for strategic decision-making.
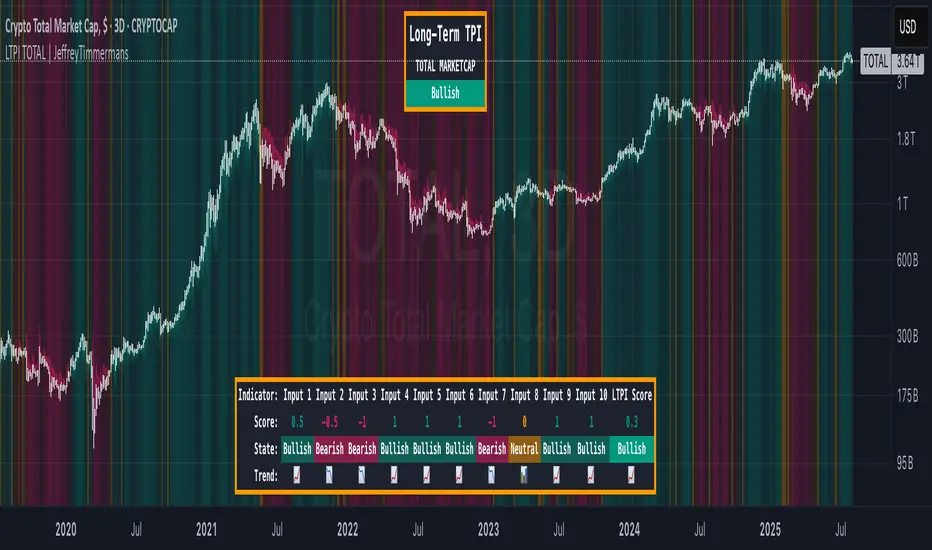
LTPI TOTAL | JeffreyTimmermansLong-Term Trend Probability Indicator
The "Long-Term Trend Probability Indicator" on TOTAL is a custom-built tool designed to analyze the global crypto market (TOTAL) from a long-term perspective. Unlike short-term indicators that react to price volatility, LTPI focuses on major trend shifts across the entire crypto market, helping to identify major trend shifts early.
This version of the LTPI is applied to the TOTAL market cap, making it a broad trend following tool.
Key Features
Long-Term Focus:
Designed for macro market analysis with less sensitivity to short-term noise.
10 Input Signals:
Combines 10 carefully selected inputs (trend following indicators) into a single score that reflects the overall market condition.
Market Regimes:
Classifies the TOTAL market into:
Bullish: Strong uptrend, expansion phase
Bearish: Strong downtrend, contraction phase
Neutral: Transitional or uncertain
Visual Background:
Background colors clearly display which regime is active.
Comprehensive Dashboard:
The panel at the bottom shows each input’s state, the composite LTPI score, and the resulting market trend.
How It Works
Inputs Analysis:
Each of the 10 inputs outputs one of three states:
+1 (Bullish)
-1 (Bearish)
0 (Neutral)
Score Calculation:
The total score is the sum of all 10 input signals divided by 10.
Score > 0.1 = Bullish
Score < -0.1 = Bearish
Between -0.1 and 0.1 = Neutral
Background Coloring:
Background colors dynamically adjust to reflect the long-term market regime.
Use Cases
Long-Term Positioning:
Identify periods of global expansion or contraction to position yourself accordingly.
Macro Confirmation:
Use LTPI in combination with medium-term (MTPI) and short-term tools for multi-timeframe confirmation.
Market Timing:
Alerts when LTPI crosses key thresholds help highlight the start of major bullish or bearish phases.
Dynamic Alerts:
Bullish Entry: LTPI score crosses above 0.1
Bearish Entry: LTPI score crosses below -0.1
Neutral Zone: Score moves back between -0.1 and 0.1
Conclusion
The Long-Term Trend Probability Indicator (LTPI – TOTAL) is a powerful tool for identifying long-term market phases across the entire crypto ecosystem. By focusing on long term trends and combining 10 inputs into a single probability score, it provides a clear macro perspective for strategic decision-making.
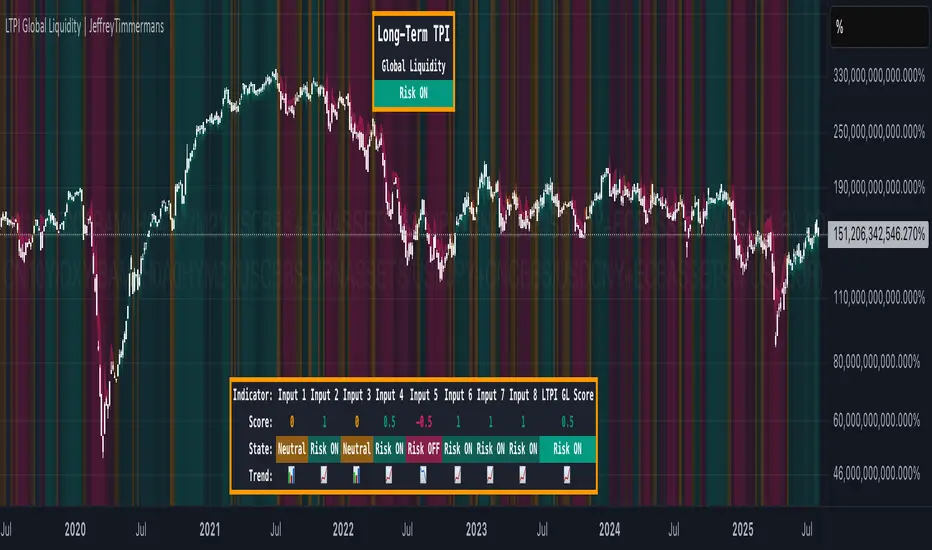
LTPI Global Liquidity | JeffreyTimmermansLong-Term Probability Indicator (LTPI)
The "Long-Term Probability Indicator (LTPI)" on a generic liquidity ticker is a custom-built analytical tool designed to evaluate market conditions over a long-term horizon, with a strong focus on global liquidity trends. By combining six carefully selected input signals into a single probability score, this indicator helps traders and analysts identify prevailing long-term market states: Bullish, Bearish, or Neutral.
Where short-term systems/timeframes react quickly to price fluctuations, LTPI smooths out noise and focuses on the bigger picture, allowing for informed strategic decision-making rather than short-term speculation.
Key Features
Multi-Input Aggregation:
Uses six independent inputs, each based on long-term liquidity and macro-related data, to generate a composite market probability score.
Long-Term Focus:
Prioritizes medium-to-long-term trends, ignoring smaller fluctuations that often mislead traders in volatile markets.
Simplified Market States:
Classifies the global market into three primary states:
Bullish: Favorable liquidity and conditions for long-term risk-taking.
Bearish: Tightening liquidity and conditions that require caution.
Neutral: Transitional phases or uncertain conditions.
Background Coloring:
Visual cues on the chart help identify which regime is active at a glance.
Global Liquidity Perspective:
Designed for use on a generic liquidity ticker, based on M2 money supply, to track macroeconomic liquidity flows and risk appetite.
Dashboard Display:
A compact on-screen table summarizes all six inputs, their states, and the resulting LTPI score.
Dynamic Alerts:
Real-time alerts signal when the LTPI shifts from one regime to another.
Inputs & Settings
LTPI Inputs:
Input Sources (6): Each input is a carefully chosen trend following indicator.
Weighting: Each input contributes equally to the final score.
Score Calculation:
Bullish = +1
Bearish = -1
Neutral = 0
Color Settings:
Strong Bullish: Bright Green
Weak Bullish: Light Green
Neutral: Gray/Orange
Weak Bearish: Light Red
Strong Bearish: Bright Red
(Colors can be customized.)
Calculation Process
Collect Data:
Six long-term inputs are evaluated at each bar.
Scoring:
Each input’s state contributes +1 (bullish), -1 (bearish), or around 0 (neutral).
Aggregate Probability:
The LTPI Score is calculated as the sum of all six scores divided by 6, resulting in a value between -1 and +1.
Market Classification:
Score > 0.1: Bullish regime
Score < -0.1: Bearish regime
-0.1 ≤ Score ≤ 0.1: Neutral
Background Coloring:
Background colors are applied to highlight the current regime.
How to Use LTPI
Strategic Positioning:
Bullish: Favor holding or adding to long-term positions.
Bearish: Reduce risk, protect capital.
Neutral: Wait for confirmation before making significant moves.
Confirmation Tool:
LTPI works best when combined with shorter-term indicators like MTPI or trend-following tools to confirm alignment across multiple timeframes.
Dynamic Alerts:
Bullish Regime Entry: When the LTPI Score crosses above 0.1.
Bearish Regime Entry: When the LTPI Score crosses below -0.1.
Neutral Zone: When the score moves back between -0.1 and 0.1.
These alerts help identify significant macro-driven shifts in market conditions.
Conclusion
The Long-Term Probability Indicator (LTPI) is an advanced, liquidity-focused tool for identifying macro-driven market phases. By consolidating six inputs into a single probability score and presenting the results visually, LTPI helps long-term investors and analysts stay aligned with global liquidity trends and avoid being distracted by short-term volatility.
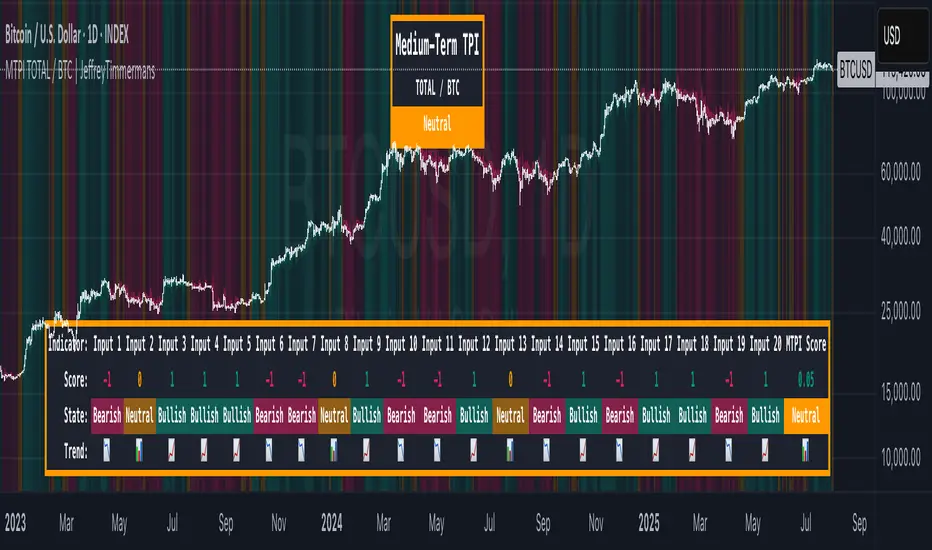
MTPI TOTAL / BTC | JeffreyTimmermansMedium-Term Probability Indicator (MTPI)
The "Medium-Term Probability Indicator (MTPI)" is a multi-factor model designed to evaluate the medium-term state of a market. By aggregating signals from 20 underlying inputs, it generates a composite score that classifies the market as Bullish, Bearish, or Neutral. This helps traders understand the prevailing market regime and adapt strategies accordingly.
Key Features
Multi-Input Scoring: Combines up to 20 individual inputs (indicators, conditions, or models) into a single probability-based score.
Composite Market State: Translates raw input signals into three states: Bullish, Bearish, or Neutral.
Dynamic Background Coloring: Uses color-coded background shading to visually separate bullish, bearish, and neutral phases.
MTPI Score: Calculates a final numeric score (ranging from -1 to +1) to quantify the market’s directional bias.
Dashboard Display: Shows all input signals, their individual states, and the aggregated MTPI score at a glance.
Medium-Term Focus: Helps identify prevailing conditions that last from several weeks to several months.
Inputs & Settings
MTPI Settings:
Input Signals (1 to 20): Default: Predefined conditions. Each input evaluates the market from a unique perspective (trend, momentum, volatility, etc.).
Composite Score Calculation: Default weighting is equal across all inputs.
Color Settings:
Bullish: Bright green background
Neutral: Gray/orange background
Bearish: Bright red background
These colors can be customized as desired.
Calculation Process
Signal Aggregation:
Each input generates a state:
1 to 0.1 = Bullish
0.1 to -0.1 = Neutral
-0.1 to -1 = Bearish
Scoring:
The MTPI aggregates these values and calculates an average score.
Classification:
Bullish: Score > 0
Bearish: Score < 0
Neutral: Score ≈ 0
Visualization:
Background Coloring: Highlights the dominant phase on the chart.
Dashboard: Displays individual input states, the total MTPI score, and the resulting classification.
How to Use the MTPI
Identifying Market Regimes:
Bullish: Majority of inputs align positively. Favor long positions or trend-following strategies.
Bearish: Majority of inputs align negatively. Favor short positions or defensive strategies.
Neutral: Mixed signals. Caution or range-bound strategies may be preferable.
Transition Detection:
Changes in background color or the MTPI dashboard (score flipping from positive to negative, or vice versa) indicate potential regime shifts.
Dynamic Dashboard:
Score: Displays the net sum of all input signals (normalized).
State: Provides the classification (Bullish, Bearish, Neutral).
Trend: Visual cues for each input showing the current contribution to the MTPI.
Conclusion
The Medium-Term Probability Indicator (MTPI) consolidates multiple signals into a single, intuitive visualization that helps traders quickly assess the medium-term market environment. Its combination of a multi-input dashboard, composite scoring, and background coloring makes it a powerful decision-support tool.
This script is developed by Jeffrey Timmermans and is designed to complement other analysis methods.
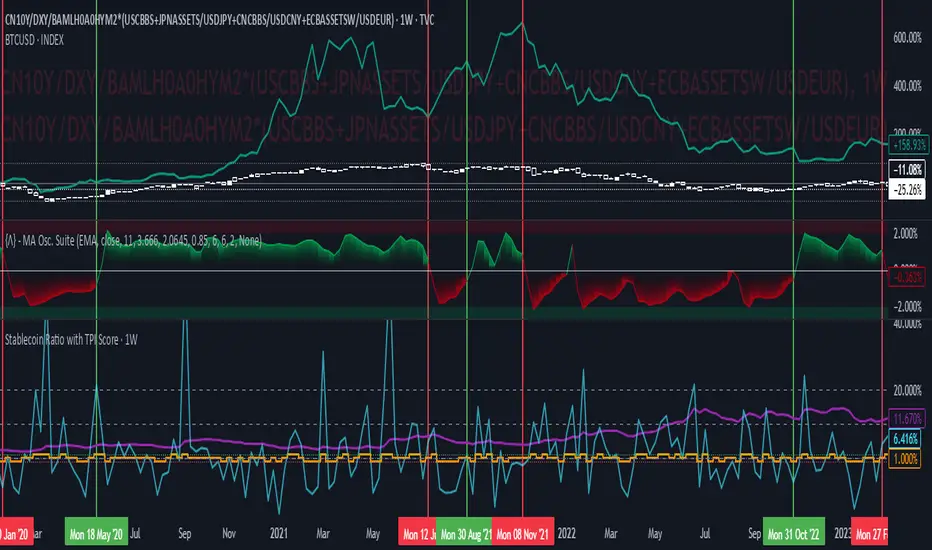
Stablecoin Ratio with TPI ScoreThe script measures the stablecoin ratio (total stablecoin market cap divided by total crypto market cap, times 100) and its weekly change. Stablecoins (e.g., USDT, USDC) are a key gateway for capital entering or exiting the crypto ecosystem.
A rising ratio suggests more capital is parked in stablecoins (potential buying power), while a falling ratio indicates capital leaving (selling or withdrawal).
In a macro analysis, this is critical—it reflects the availability of liquid funds that could fuel price movements.
In macroeconomics, liquidity is a driver of asset prices.
In crypto, stablecoins represent sidelined capital ready to deploy.
How does it work?
Stablecoin Ratio:
Formula: (total_stablecoin_mcap / total_crypto_mcap) * 100.
Example: If stablecoins = $235B and total market cap = $2.5T, ratio = 9.4%.
Plotted as a red line in the oscillator pane, showing the percentage of the market held in stablecoins.
Weekly Change:
Calculates the percentage change in the ratio from the previous week:
(current_ratio - previous_ratio) / previous_ratio * 100.
Example: Ratio goes from 9% to 10% = +11.11% change.
TPI Score Assignment:
+1 (Bullish): If the ratio increases by more than 5% week-over-week.
-1 (Bearish): If the ratio decreases by more than 5% week-over-week.
0 (Neutral): If the change is between -5% and +5%.
Plotted as orange step line bars in the oscillator pane, snapping to +1, 0, or -1.
Volatility FilterThe "Volatility Filter" script is designed to measure market volatility across two different timeframes and determine whether the market is flat or trending.
It uses custom-tuned versions of four different indicators to measure volatility and distinguish between trending and ranging conditions.
The selected indicators are:
1 - Average Directional Index (ADX) Volatility
2 - Damiani Volameter
3 - Trader Pressure Index (TPI)
4 - Williams Alligator Indicator
The script calculates a filter score for both the current timeframe and a user-specified higher timeframe. It offers two types of filter scores, controlled by the 'FilterType' parameter. The filter score is then visualized on the chart as the main oscillator for the current timeframe and a filled bar for the higher timeframe.
The script utilizes a custom moving average function that provides 17 different ways to calculate a moving average, giving the user extensive flexibility in tailoring the script to their needs.
By using custom indicators and unique score calculation methods across two timeframes, this script provides a comprehensive measure of market volatility, aiding traders in identifying trending and ranging market conditions.
This script also provides two additional parameters for tuning its calculations and output, allowing to adjust the script to any trading style and the characteristics of the market being traded.
1 - Threshold: This parameter sets a threshold that the oscillator needs to surpass for the current market move to be considered as a trend. By adjusting the threshold, traders can control how much volatility is required to register a move as trending. A higher threshold will require more volatility for a trend to be recognized, meaning that the market needs to be moving more strongly for a trend to be identified.
2 - Length: This parameter is used to smooth the oscillator. It determines the number of periods used in the calculation of the moving average of the volatility filter score. A longer length will consider more data points and therefore provide a smoother line, which can be useful in accounting for the fading of trends. When trends start to lose their strength but are still present, a longer length can help in maintaining the recognition of the trend, aiding in making accurate trading decisions.
By adjusting these parameters, traders can fine-tune the script's sensitivity to market volatility and its recognition of trends, providing valuable flexibility in adapting to different market conditions and trading strategies.

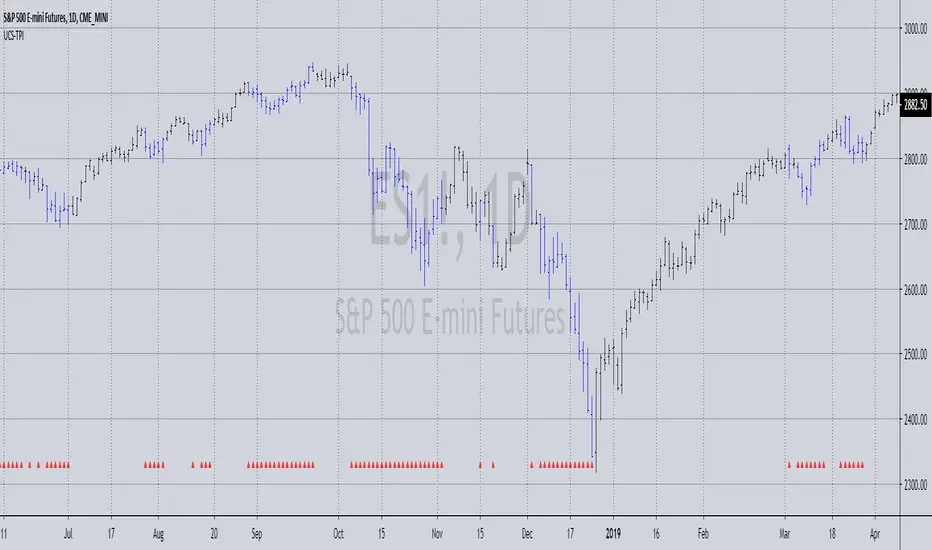
UCS_Trader Pressure Indicator -V1Welcoming everyone to a simple Indicator. I have used the volume of a stock to establish how commited the market for that particular ticker is when it comes to a direction.
The idea behind the indicator is how much of commitment there is towards a move.
*** This indicator is non directional*** ie., It just measures the commitment behind a move.
Why is it important.
Let's say we have a uptrending stock with low commitment (pressure), the bounce on any pullback will not be able carry that any further. So the pressure on the Pullback could drop the stock below and add additional risk. Only for us to wish and think, we checked that previously.
Essentially, If a Trend is being established with a strong pressure (VOLUME BASED). It is more likely to continue.
How you would use this is upto you. But general ideas in Some of these snapshots.
Concluding -
The trend in combination with TPI - Stronger Trend.
In such stronger trends - A pullback (oppsing the trend) have higher probability to bounce.
NOTE - Experiement with the indicator and Trade at your own risk This is a tool, not a system.
Feedbacks are welcome and will be considered for improvement.
Best Wishes