MorphWave Bands [JOAT]MorphWave Bands - Adaptive Volatility Envelope System
MorphWave Bands create a dynamic price envelope that automatically adjusts its width based on current market conditions. Unlike static Bollinger Bands, this indicator blends ATR and standard deviation with an efficiency ratio to expand during trending conditions and contract during consolidation.
What This Indicator Does
Plots adaptive upper and lower bands around a customizable moving average basis
Automatically adjusts band width using a blend of ATR and standard deviation
Detects volatility squeezes when bands contract to historical lows
Highlights breakouts when price moves beyond the bands
Provides squeeze alerts for anticipating volatility expansion
Adaptive Mechanism
The bands adapt through a multi-step process:
// Blend ATR and Standard Deviation
blendedVol = useAtrBlend ? (atrVal * 0.6 + stdVal * 0.4) : stdVal
// Normalize volatility to its historical range
volNorm = (blendedVol - volLow) / (volHigh - volLow)
// Create adaptive multiplier
adaptMult = baseMult * (0.5 + volNorm * adaptSens)
This creates bands that respond to market regime changes while maintaining stability.
Squeeze Detection
A squeeze is identified when band width drops below a specified percentile of its historical range:
Background highlighting indicates active squeeze conditions
Low percentile readings suggest compressed volatility
Squeeze exits often precede directional moves
Inputs Overview
Band Length — Period for basis calculation (default: 20)
Base Multiplier — Starting band width multiplier (default: 2.0)
MA Type — Choose from SMA, EMA, WMA, VWMA, or HMA
Adaptation Lookback — Historical period for normalization (default: 50)
Adaptation Sensitivity — How much bands respond to volatility changes
Squeeze Threshold — Percentile below which squeeze is detected
Dashboard Information
Current trend direction relative to basis and bands
Band width percentage
Squeeze status (Active or None)
Efficiency ratio
Current adaptive multiplier value
How to Use It
Look for squeeze conditions as potential precursors to breakouts
Use band touches as dynamic support/resistance references
Monitor breakout signals when price closes beyond bands
Combine with momentum indicators for directional confirmation
Alerts
Upper/Lower Breakout — Price exceeds band boundaries
Squeeze Entry/Exit — Volatility compression begins or ends
Basis Crosses — Price crosses the center line
This indicator is provided for educational purposes. It does not constitute financial advice.
— Made with passion by officialjackofalltrades
Trading-indicators

MACD Josh MACD Study — Visual Crossover Tags
Overview:
This script displays MACD signals in a clear, visual way by showing:
Histogram = EMA(Fast) − EMA(Slow)
Signal = EMA(Histogram, Signal Length)
It adds labels and arrows to help you see crossover events between the Histogram and the Signal line more easily.
⚠️ Disclaimer: This tool is for educational and research purposes only. It is not financial advice or an investment recommendation. Past performance does not guarantee future results. Users should make their own decisions and manage risk responsibly.
Features
Central Zero Line with Signal and Histogram plots
Optional labels/arrows to highlight Histogram–Signal crossovers
Alerts for crossover and crossunder events, integrated with TradingView’s alert system
Standard adjustable inputs: Fast EMA, Slow EMA, Signal EMA
How to Interpret (for study only)
When the Histogram crosses above the Signal, a visual label/arrow marks a positive MACD event
When the Histogram crosses below the Signal, a visual label/arrow marks a negative MACD event
The “BUY/SELL” labels are visual study tags only — they do not represent trade instructions or recommendations
Responsible Usage Tips
Test across multiple timeframes and different assets
Combine with higher-timeframe trend, support/resistance, or volume for confirmation
Use alerts with caution, and always test in a demo environment first
Technical Notes
The script does not use future data and does not repaint signals once bars are closed
Results depend on market conditions and may vary across assets and timeframes
License & Credits
Written in Pine Script® v5 for TradingView
The indicator name shown on chart is for labeling purposes only and carries no implication of advice or solicitation

Signalgo MASignalgo MA is a TradingView indicator based on moving average (MA) trading by combining multi-timeframe logic, trend strength filtering, and adaptive trade management. Here’s a deep dive into how it works, its features, and why it stands apart from traditional MA indicators.
How Signalgo MA Works
1. Multi-Timeframe Moving Average Analysis
Simultaneous EMA & SMA Tracking: Signalgo MA calculates exponential (EMA) and simple (SMA) moving averages across a wide range of timeframes—from 1 minute to 3 months.
Layered Cross Detection: It detects crossovers and crossunders on each timeframe, allowing for both micro and macro trend detection.
Synchronized Signal Mapping: Instead of acting on a single crossover, the indicator requires agreement across multiple timeframes to trigger signals, filtering out noise and false positives.
2. Trend Strength & Quality Filtering
ADX Trend Filter: Trades are only considered when the Average Directional Index (ADX) confirms a strong trend, ensuring signals are not triggered during choppy or directionless markets.
Volume & Momentum Confirmation: For the strongest signals, the system requires:
A significant volume spike
Price above/below a longer-term EMA (for buys/sells)
RSI momentum confirmation
One-Time Event Detection: Each crossover event is flagged only once per occurrence, preventing repeated signals from the same move.
Inputs
Preset Parameters:
EMA & SMA Lengths: Optimized for both short-term and long-term analysis.
ADX Length & Minimum: Sets the threshold for what is considered a “strong” trend.
Show Labels/Table: Visual toggles for displaying signal and trade management information.
Trade Management:
Show TP/SL Logic: Toggle to display or hide take-profit (TP) and stop-loss (SL) levels.
ATR Length & Multipliers: Fine-tune how SL and TP levels adapt to market volatility.
Enable Trailing Stop: Option to activate dynamic stop movement after TP1.
Entry & Exit Strategy
Entry Logic
Long (Buy) Entry: Triggered when multiple timeframes confirm bullish EMA/SMA crossovers, ADX confirms trend strength, and all volume/momentum filters align.
Short (Sell) Entry: Triggered when multiple timeframes confirm bearish crossunders, with the same strict filtering.
Exit & Trade Management
Stop Loss (SL): Automatically set based on recent volatility (ATR), adapting to current market conditions.
Take Profits (TP1, TP2, TP3): Three profit targets at increasing reward multiples, allowing for flexible trade management.
Trailing Stop: After TP1 is hit, the stop loss moves to breakeven and a trailing stop is activated to lock in further gains.
Event Markers: Each time a TP or SL is hit, a visual label is placed on the chart for full transparency.
Strict Signal Quality Filters: Signals are only generated when volume spikes, momentum, and trend strength all align, dramatically reducing false positives.
Adaptive, Automated Trade Management: Built-in TP/SL and trailing logic mean you get not just signals, but a full trade management suite, rarely found in standard MA indicators.
Event-Driven, Not Static: Each signal is triggered only once per event, eliminating repetitive or redundant entries.
Visual & Alert Integration: Every signal and trade event is visually marked and can trigger TradingView alerts, keeping you informed in real time.
Trading Strategy Application
Versatility: Suitable for scalping, day trading, swing trading, and longer-term positions thanks to its multi-timeframe logic.
Noise Reduction: The layered filtering logic means you only see the highest-probability setups, helping you avoid common MA “fakeouts” and overtrading.
So basically what separates Signalgo MA from traditional MA indicators?
1. Multi-Timeframe Analysis
Traditional MA indicators: Usually measure crossovers or signals within a single timeframe.
Signalgo MA: simultaneously calculates fast/slow EMAs & SMAs for multiple periods. This enables it to create signals based on synchronized or stacked momentum across multiple periods, offering broader trend confirmation and reducing noise from single-timeframe signals.
2. Combinatorial Signal Logic
Traditional: A basic crossover is typically “if fast MA crosses above/below slow MA, signal buy/sell.”
Signalgo MA: Generates signals only when MA crossovers align across several timeframes, plus takes into consideration the presence or absence of conflicting signals in shorter or longer frames. This reduces false positives and increases selectivity.
3. Trend Strength Filtering (ADX Integration)
Traditional: Many MA indicators are “blind” to trend intensity, potentially triggering signals in low volatility or ranging conditions.
Signalgo MA: Employs ADX as a minimum trend filter. Signals will only fire if the trend is sufficiently strong, reducing whipsaws in choppy or sideways markets.
4. Volume & Strict Confirmation Layer
Traditional: Few MA indicators directly consider volume or require confluence with other major indicators.
Signalgo MA: Introduces a “strict signal” filter that requires not only MA crossovers and trend strength, but also (on designated frames):
Significant volume spike,
Price positioned above/below a higher timeframe EMA (trend anchor),
RSI momentum confirmation.
5. Persistent, Multi-Level TP/SL Automated Trade Management
Traditional: Separate scripts or manual management for stop-loss, take-profit, and trailing-stops, rarely fully integrated visually.
Signalgo MA: Auto-plots up to three take-profit levels, initial stop, and a trailing stop (all ATR-based) on the chart. It also re-labels these as they are hit and resets for each new entry, supporting full trade lifecycle visualization directly on the chart.
6. Higher Timeframe SMA Crosses for Long-Term Context
Traditional: Focuses only on the current chart’s timeframe.
Signalgo MA: Incorporates SMA cross logic for weekly, monthly, and quarterly periods, which can contextualize lower timeframe trades within broader cycles, helping filter against counter-trend signals.
7. “Signal Once” Logic to Prevent Over-Trading
Traditional: Will often re-fire the same signal repeatedly as long as the condition is true, possibly resulting in signal clusters and over-trading.
Signalgo MA: Fires each signal only once per condition—prevents duplicate alerts for the same trade context.

skX FVG Enhanced Indicator [1m,5m] skX FVG Indicator
Fair Value Gaps (FVGs) are particularly effective for scalping altcoins due to their tendency to fill price inefficiencies. These gaps occur during strong momentum moves where price leaves an 'empty' zone that often acts as a magnet for price to return to. In the volatile alt market, these gaps frequently present high-probability scalping opportunities.
Why FVGs Work in Alts:
• Quick price movements create more gaps
• Higher volatility increases gap frequency
• Institutional algorithms tend to fill these inefficiencies
• Works especially well in lower timeframes (1-5m)
Key Features:
✓ Automatic FVG detection with size filtering
✓ Smart timeframe adaptation (1m, 5m, Custom settings)
✓ Trend detection using 8/21/55 EMA system
✓ Dynamic TP/SL levels based on ATR
✓ Risk:Reward ratio automation
✓ Visual signals that stick to price levels
✓ Clear information display panel
✓ Built-in alerts system
How to Use:
1. Select your preferred timeframe (1m or 5m recommended)
2. Watch for triangle signals (▲ bullish, ▼ bearish)
3. Confirm with trend direction (shown in panel)
4. Use provided TP/SL levels for trade management
5. Set alerts for new FVG formations
Settings Explained:
• Auto Mode: Adjusts gap size to timeframe
• Custom Gap Size: Manual gap size control
• ATR Period: Volatility measurement window
• ATR Multiplier: Stop loss distance
• Risk:Reward: Take profit ratio
Best Practices:
• Use in conjunction with support/resistance
• Trade in direction of main trend
• Monitor higher timeframe structure
• Start with recommended settings
• Backtest before live trading
Note: This indicator works best in volatile market conditions and should be used as part of a complete trading strategy.
Good luck trading!
-skX

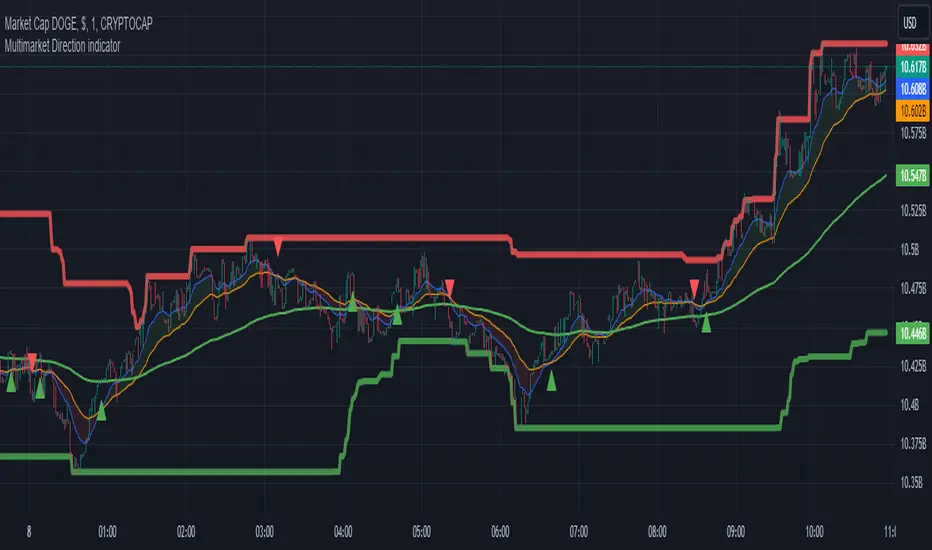
Multimarket Direction indicatorTrendline trading with resistant and support made by me.
Im bad coder and just jump into the tradingview pine script 1 days before so please don't hates me
- I don't know why my script is ded before lol
Signals to trade up
1. The big candles up cross the ema200 (last 5 candles for confirmation)
2. Wait for showing the up triangle.
3. Lookup the resistant/support line. If near the resistant please consider to wait if it break then join the trade
4. Only out trade when it has a down triagle or the candles has big down candles at the resistant/support line.
That it...
Auto Trailing stoploss By InvestYourAsset💥The Auto Trailing Stop-Loss indicator is a technical indicator that uses the ATR (Average True Range) to calculate a trailing stop-loss for both long and short positions.
💥The signals according to the indicator allows traders to exit from the position before its too late! The indicator can be used to determine when to enter and exit trades.
💥To use the indicator, you simply need to set the input parameters to suit your trading style and risk tolerance. The default values for the parameters are:
p: The ATR period (14)
q: The stop period (20)
x: The multiplier used to calculate the initial high and initial low (1.5)
Calculations:
📈Calculates the ATR using the specified period you can modify ATR period according to your trading style.
📈Calculates the initial high and low stop levels based on the highest high and lowest low over the user defined ATR period.
📈Calculates short and long stoploss levels using the initial high and low stops.
💥Once you have set the input parameters according to your trading style whether you are a day trader or a swing trader, the indicator will plot the short stoploss, long stoploss, and stoploss hit signals on your chart.
💥You can use the indicator to enter and exit trades in a various ways.
For example,
🚀 you could enter a long trade when the price crosses above both red and green lines plotted on the chart. (or when price crosses over both short stoploss and long stoploss.) You could also use the indicator to secure your profits by moving your stop-loss up as the price moves in your favor.
Here is an example of how you could use the indicator to enter and exit trades:
🚀Enter a long trade when the price crosses above the red line or short stoploss.
✅keep Moving your stop-loss upward with the long stoploss or green line.
✅Exit the trade when the price crosses below the long stoploss or green line.
💥You can also use the indicator to protect your existing trades. For example, if you are already in a long trade, you could move your stop-loss up to the short stop when the price moves up 10%. This will help you to protect your profits in case the price starts to move against you.
💥💥some additional tips for using the Auto Trailing Stop-Loss indicator:
✅Use the indicator in conjunction with other technical indicators or your own trading strategy to generate entry and exit signals.
✅Backtest your trading strategy before using it live to make sure that it is profitable.
✅Use the indicator to protect your profits by moving your stop-loss up as the price moves in your favor.
✅ Always follow risk management rules and manage your position sizing according to your risk appetite.
✅ Be aware of the overall trend direction. If the trend is up, you should be looking for bullish reversals or continuations. If the trend is down, you should be looking for bearish reversals or continuations.
This script essentially provides a visual representation of a trading strategy that automatically adjusts stop-loss levels based on market volatility (ATR). It also includes signals for entering long or short positions and visually highlights these signals on the chart.
📣📣Follow us for timely updates regarding future indicators and give it a like if you appreciate the work.📣📣

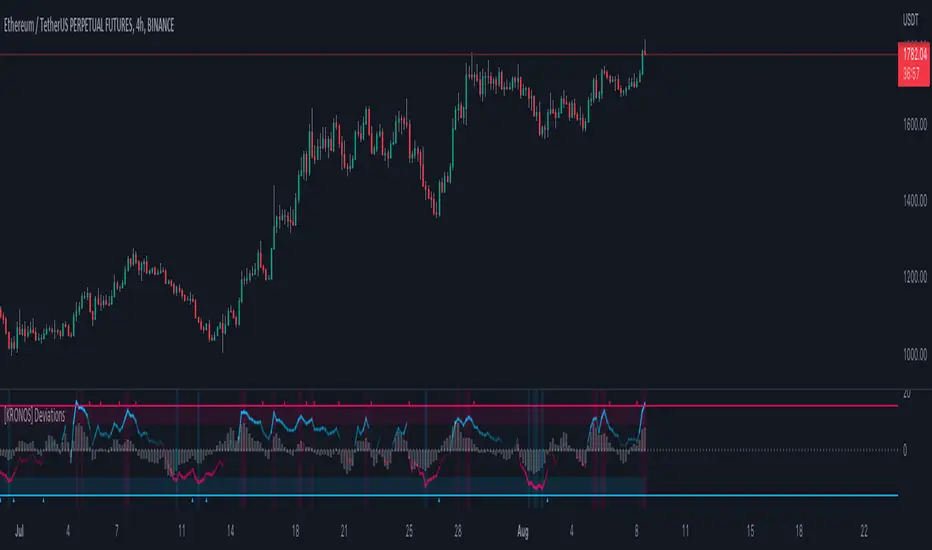
[KRONOS] DeviationsDescription
This indicator calculates the differences between the current price and the local support or resistance, and normalizes it into a range.
The value basis is calculated from a defined period of time that is then multiplied to get a standard deviations and a max. and min. value subtracted and divided into a final value.
It includes
Extreme zones. This value appears as blue and red lines which deviates from the oversold to overbought range.
Momentum. Lower time frame momentum is represented by a gray histogram as well as a signal line oscillating from a red to blue color.
Strong reversal. Red ( bearish ) and blue ( bullish ) columns will appear on the histogram when our algorithm detects that the strength of momentum is coming to an end indicative of a trend reversal.
Trend confirmation. Red or blue arrows will act as a trend confirmation.
Support and resistance . The zero line will frequently serve as a S/R area.
Divergences. You can use this indicator to detect potential pivot areas.
How to use?
Sell/Short when the histogram shows a red column and the signal line is in or above the overbought area (colored in red).
Buy/Long when the histogram shows a blue column and the signal line is in or below the oversold area (colored in blue).
extra tip: if you entered a trade based on the above conditions, you can partially increase your position each time you see a confirmation arrow.