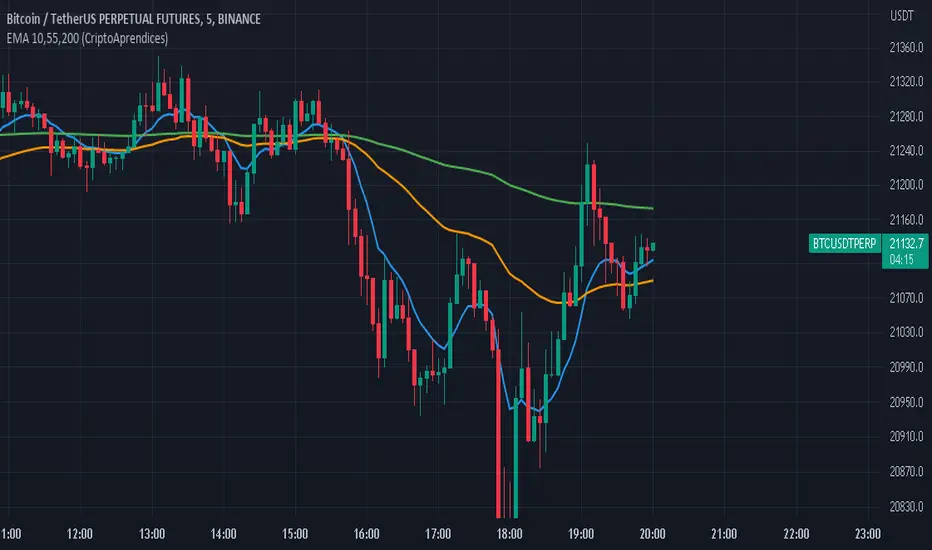
EMA 10,55,200 (CriptoAprendices) CriptoAprendices Media Móvil Exponencial (EMA'S )de 10,55 Y 200 en Un Solo IndicadorPine Script® indicatorby CriptoAprendices44
Squeeze M + ADX + TTM (Trading Latino & John Carter) by [Rolgui]About this indicator: This indicator aims to combine two good performing strategies, which can be used separately or together, mainly for investment positions, although it can also be used for intraday trading. Strategy 1) Squeeze Oscillator and Average Directional Index: This strategy is taught by Jaime Aibsai, which determines market entries based on reading the direction of the price movement (Directionality of the Oscillator) along with the strength of the Oscillator (Slope of the ADX). Both tools are configured according to Jaime Abisai's strategy, by default (note that point 23 of the ADX is represented by point 0 on the panel, to make reading easier, its interpretation is not affected). Anyway you can adjust the input data according to your interest. *You can see this setting in the first panel. Strategy 2) Squeeze Momentum and Trade The Market Waves: This strategy can be consulted either in John F. Carter's books or on his website. This market reading is based on Price Volatility (Bollinger Bands and Keltner Channels interaction) and its Trend (Exponential Moving Averages), showing entries at times when price volatility is low and taking filtering active trend using T.T.M. Waves. To configure the indicator in the same way that Carter does, it would be enough to turn off the ADX, turn on the Squeeze Momentum signals along with the T.T.M. Waves, and importantly, change the Linear Momentum value to 12 (this configuration can be found in his book). *You can see this setting in the second panel. Why this indicator? I've added and removed the above flags as I needed to query them (which became tedious for me). The main objective of having merged them into one is to make their reading more agile and comfortable and thus improve the decision-making capacity of the trader who wishes to use them. Credits and Acknowledgments: I would like to give credits to other authors, for the sections of code that I have used to make this technical indicator. Thanks to @LazyBear, @matetaronna, @jombie and @joren for contributing to the community and keeping their code open. It is priceless! Feel free to combine and practice your trading with both strategies, personally, they improved my profitability and this is why I recommend researching more about them. I've been using it for crypto investing, let me know if it's worth for you on stock market! If you have any questions or suggestions you can leave it in the comments! Greetings!Pine Script® indicatorby rolgui1616 2.3 K
Ruckard TradingLatinoThis strategy tries to mimic TradingLatino strategy. The current implementation is beta. Si hablas castellano o espanyol por favor consulta MENSAJE EN CASTELLANO más abajo. It's aimed at BTCUSDT pair and 4h timeframe. STRATEGY DEFAULT SETTINGS EXPLANATION max_bars_back=5000 : This is a random number of bars so that the strategy test lasts for one or two years calc_on_order_fills=false : To wait for the 4h closing is too much. Try to check if it's worth entering a position after closing one. I finally decided not to recheck if it's worth entering after an order is closed. So it is false. calc_on_every_tick=false pyramiding=0 : We only want one entry allowed in the same direction. And we don't want the order to scale by error. initial_capital=1000 : These are 1000 USDT. By using 1% maximum loss per trade and 7% as a default stop loss by using 1000 USDT at 12000 USDT per BTC price you would entry with around 142 USDT which are converted into: 0.010 BTC . The maximum number of decimal for contracts on this BTCUSDT market is 3 decimals. E.g. the minimum might be: 0.001 BTC . So, this minimal 1000 amount ensures us not to entry with less than 0.001 entries which might have happened when using 100 USDT as an initial capital. slippage=1 : Binance BTCUSDT mintick is: 0.01. Binance slippage: 0.1 % (Let's assume). TV has an integer slippage. It does not have a percentage based slippage. If we assume a 1000 initial capital, the recommended equity is 142 which at 11996 USDT per BTC price means: 0.011 BTC. The 0.1% slippage of: 0.011 BTC would be: 0.000011 . This is way smaller than the mintick. So our slippage is going to be 1. E.g. 1 (slippage) * 0.01 (mintick) commission_type=strategy.commission.percent and commission_value=0.1 : According to: binance . com / en / fee / schedule in VIP 0 level both maker and taker fees are: 0.1 %. BACKGROUND Jaime Merino is a well known Youtuber focused on crypto trading His channel TradingLatino features monday to friday videos where he explains his strategy. JAIME MERINO STANCE ON BOTS Jaime Merino stance on bots (taken from memory out of a 2020 June video from him): '~ You know. They can program you a bot and it might work. But, there are some special situations that the bot would not be able to handle. And, I, as a human, I would handle it. And the bot wouldn't do it. ~' My long term target with this strategy script is add as many special situations as I can to the script so that it can match Jaime Merino behaviour even in non normal circumstances. My alternate target is learn Pine script and enjoy programming with it. WARNING This script might be bigger than other TradingView scripts. However, please, do not be confused because the current status is beta. This script has not been tested with real money. This is NOT an official strategy from Jaime Merino. This is NOT an official strategy from TradingLatino . net . HOW IT WORKS It basically uses ADX slope and LazyBear's Squeeze Momentum Indicator to make its buy and sell decisions. Fast paced EMA being bigger than slow paced EMA (on higher timeframe) advices going long. Fast paced EMA being smaller than slow paced EMA (on higher timeframe) advices going short. It finally add many substrats that TradingLatino uses. SETTINGS __ SETTINGS - Basics ____ SETTINGS - Basics - ADX (ADX) Smoothing {14} (ADX) DI Length {14} (ADX) key level {23} ____ SETTINGS - Basics - LazyBear Squeeze Momentum (SQZMOM) BB Length {20} (SQZMOM) BB MultFactor {2.0} (SQZMOM) KC Length {20} (SQZMOM) KC MultFactor {1.5} (SQZMOM) Use TrueRange (KC) {True} ____ SETTINGS - Basics - EMAs (EMAS) EMA10 - Length {10} (EMAS) EMA10 - Source {close} (EMAS) EMA55 - Length {55} (EMAS) EMA55 - Source {close} ____ SETTINGS - Volume Profile Lowest and highest VPoC from last three days is used to know if an entry has a support VPVR of last 100 4h bars is also taken into account (VP) Use number of bars (not VP timeframe): Uses 'Number of bars {100}' setting instead of 'Volume Profile timeframe' setting for calculating session VPoC (VP) Show tick difference from current price {False}: BETA . Might be useful for actions some day. (VP) Number of bars {100}: If 'Use number of bars (not VP timeframe)' is turned on this setting is used to calculate session VPoC. (VP) Volume Profile timeframe {1 day}: If 'Use number of bars (not VP timeframe)' is turned off this setting is used to calculate session VPoC. (VP) Row width multiplier {0.6}: Adjust how the extra Volume Profile bars are shown in the chart. (VP) Resistances prices number of decimal digits : Round Volume Profile bars label numbers so that they don't have so many decimals. (VP) Number of bars for bottom VPOC {18}: 18 bars equals 3 days in suggested timeframe of 4 hours. It's used to calculate lowest session VPoC from previous three days. It's also used as a top VPOC for sells. (VP) Ignore VPOC bottom advice on long {False}: If turned on it ignores bottom VPOC (or top VPOC on sells) when evaluating if a buy entry is worth it. (VP) Number of bars for VPVR VPOC {100}: Number of bars to calculate the VPVR VPoC. We use 100 as Jaime once used. When the price bounces back to the EMA55 it might just bounce to this VPVR VPoC if its price it's lower than the EMA55 (Sells have inverse algorithm). ____ SETTINGS - ADX Slope ADX Slope help us to understand if ADX has a positive slope, negative slope or it is rather still. (ADXSLOPE) ADX cut {23}: If ADX value is greater than this cut (23) then ADX has strength (ADXSLOPE) ADX minimum steepness entry {45}: ADX slope needs to be 45 degrees to be considered as a positive one. (ADXSLOPE) ADX minimum steepness exit {45}: ADX slope needs to be -45 degrees to be considered as a negative one. (ADXSLOPE) ADX steepness periods {3}: In order to avoid false detection the slope is calculated along 3 periods. ____ SETTINGS - Next to EMA55 (NEXTEMA55) EMA10 to EMA55 bounce back percentage {80}: EMA10 might bounce back to EMA55 or maybe to 80% of its complete way to EMA55 (NEXTEMA55) Next to EMA55 percentage {15}: How much next to the EMA55 you need to be to consider it's going to bounce back upwards again. ____ SETTINGS - Stop Loss and Take Profit You can set a default stop loss or a default take profit. (STOPTAKE) Stop Loss % {7.0} (STOPTAKE) Take Profit % {2.0} ____ SETTINGS - Trailing Take Profit You can customize the default trailing take profit values (TRAILING) Trailing Take Profit (%) {1.0}: Trailing take profit offset in percentage (TRAILING) Trailing Take Profit Trigger (%) {2.0}: When 2.0% of benefit is reached then activate the trailing take profit. ____ SETTINGS - MAIN TURN ON/OFF OPTIONS (EMAS) Ignore advice based on emas {false}. (EMAS) Ignore advice based on emas (On closing long signal) {False}: Ignore advice based on emas but only when deciding to close a buy entry. (SQZMOM) Ignore advice based on SQZMOM {false}: Ignores advice based on SQZMOM indicator. (ADXSLOPE) Ignore advice based on ADX positive slope {false} (ADXSLOPE) Ignore advice based on ADX cut (23) {true} (STOPTAKE) Take Profit? {false}: Enables simple Take Profit. (STOPTAKE) Stop Loss? {True}: Enables simple Stop Loss. (TRAILING) Enable Trailing Take Profit (%) {True}: Enables Trailing Take Profit. ____ SETTINGS - Strategy mode (STRAT) Type Strategy: 'Long and Short', 'Long Only' or 'Short Only'. Default: 'Long and Short'. ____ SETTINGS - Risk Management (RISKM) Risk Management Type: 'Safe', 'Somewhat safe compound' or 'Unsafe compound'. ' Safe ': Calculations are always done with the initial capital (1000) in mind. The maximum losses per trade/day/week/month are taken into account. ' Somewhat safe compound ': Calculations are done with initial capital (1000) or a higher capital if it increases. The maximum losses per trade/day/week/month are taken into account. ' Unsafe compound ': In each order all the current capital is gambled and only the default stop loss per order is taken into account. That means that the maximum losses per trade/day/week/month are not taken into account. Default : 'Somewhat safe compound'. (RISKM) Maximum loss per trade % {1.0}. (RISKM) Maximum loss per day % {6.0}. (RISKM) Maximum loss per week % {8.0}. (RISKM) Maximum loss per month % {10.0}. ____ SETTINGS - Decimals (DECIMAL) Maximum number of decimal for contracts {3}: How small (3 decimals means 0.001) an entry position might be in your exchange. EXTRA 1 - PRICE IS IN RANGE indicator (PRANGE) Print price is in range {False}: Enable a bottom label that indicates if the price is in range or not. (PRANGE) Price range periods {5}: How many previous periods are used to calculate the medians (PRANGE) Price range maximum desviation (%) {0.6} ( > 0 ): Maximum positive desviation for range detection (PRANGE) Price range minimum desviation (%) {0.6} ( > 0 ): Mininum negative desviation for range detection EXTRA 2 - SQUEEZE MOMENTUM Desviation indicator (SQZDIVER) Show degrees {False}: Show degrees of each Squeeze Momentum Divergence lines to the x-axis. (SQZDIVER) Show desviation labels {False}: Whether to show or not desviation labels for the Squeeze Momentum Divergences. (SQZDIVER) Show desviation lines {False}: Whether to show or not desviation lines for the Squeeze Momentum Divergences. EXTRA 3 - VOLUME PROFILE indicator WARNING: This indicator works not on current bar but on previous bar. So in the worst case it might be VP from 4 hours ago. Don't worry, inside the strategy calculus the correct values are used. It's just that I cannot show the most recent one in the chart. (VP) Print recent profile {False}: Show Volume Profile indicator (VP) Avoid label price overlaps {False}: Avoid label prices to overlap on the chart. EXTRA 4 - ZIGNALY SUPPORT (ZIG) Zignaly Alert Type {Email}: 'Email', 'Webhook'. ' Email ': Prepare alert_message variable content to be compatible with zignaly expected email content format. ' Webhook ': Prepare alert_message variable content to be compatible with zignaly expected json content format. EXTRA 5 - DEBUG (DEBUG) Enable debug on order comments {False}: If set to true it prepares the order message to match the alert_message variable. It makes easier to debug what would have been sent by email or webhook on each of the times an order is triggered. HOW TO USE THIS STRATEGY BOT MODE: This is the default setting. PROPER VOLUME PROFILE VIEWING: Click on this strategy settings. Properties tab. Make sure Recalculate 'each time the order was run' is turned off. NEWBIE USER: (Check PROPER VOLUME PROFILE VIEWING above!) You might want to turn on the 'Print recent profile {False}' setting. Alternatively you can use my alternate realtime study: 'Resistances and supports based on simplified Volume Profile' but, be aware, it might consume one indicator. ADVANCED USER 1: Turn on the 'Print price is in range {False}' setting and help us to debug this subindicator. Also help us to figure out how to include this value in the strategy. ADVANCED USER 2: Turn on the all the (SQZDIVER) settings and help us to figure out how to include this value in the strategy. ADVANCED USER 3: (Check PROPER VOLUME PROFILE VIEWING above!) Turn on the 'Print recent profile {False}' setting and report any problem with it. JAIME MERINO: Just use the indicator as it comes by default. It should only show BUY signals, SELL signals and their associated closing signals. From time to time you might want to check 'ADVANCED USER 2' instructions to check that there's actually a divergence. Check also 'ADVANCED USER 1' instructions for your amusement. EXTRA ADVICE It's advised that you use this strategy in addition to these two other indicators: * Squeeze Momentum Indicator * ADX so that your chart matches as close as possible to TradingLatino chart. ZIGNALY INTEGRATION This strategy supports Zignaly email integration by default. It also supports Zignaly Webhook integration. ZIGNALY INTEGRATION - Email integration example What you would write in your alert message: ||{{strategy.order.alert_message}}||key=MYSECRETKEY|| ZIGNALY INTEGRATION - Webhook integration example What you would write in your alert message: { {{strategy.order.alert_message}} , "key" : "MYSECRETKEY" } CREDITS I have reused and adapted some code from 'Directional Movement Index + ADX & Keylevel Support' study which it's from TradingView console user. I have reused and adapted some code from '3ema' study which it's from TradingView hunganhnguyen1193 user. I have reused and adapted some code from 'Squeeze Momentum Indicator ' study which it's from TradingView LazyBear user. I have reused and adapted some code from 'Strategy Tester EMA-SMA-RSI-MACD' study which it's from TradingView fikira user. I have reused and adapted some code from 'Support Resistance MTF' study which it's from TradingView LonesomeTheBlue user. I have reused and adapted some code from 'TF Segmented Linear Regression' study which it's from TradingView alexgrover user. I have reused and adapted some code from "Poor man's volume profile" study which it's from TradingView IldarAkhmetgaleev user. FEEDBACK Please check the strategy source code for more detailed information where, among others, I explain all of the substrats and if they are implemented or not. Q1. Did I understand wrong any of the Jaime substrats (which I have implemented)? Q2. The strategy yields quite profit when we should long (EMA10 from 1d timeframe is higher than EMA55 from 1d timeframe. Why the strategy yields much less profit when we should short (EMA10 from 1d timeframe is lower than EMA55 from 1d timeframe)? Any idea if you need to do something else rather than just reverse what Jaime does when longing? FREQUENTLY ASKED QUESTIONS FAQ1. Why are you giving this strategy for free? TradingLatino and his fellow enthusiasts taught me this strategy. Now I'm giving back to them. FAQ2. Seriously! Why are you giving this strategy for free? I'm confident his strategy might be improved a lot. By keeping it to myself I would avoid other people contributions to improve it. Now that everyone can contribute this is a win-win. FAQ3. How can I connect this strategy to my Exchange account? It seems that you can attach alerts to strategies. You might want to combine it with a paying account which enable Webhook URLs to work. I don't know how all of this works right now so I cannot give you advice on it. You will have to do your own research on this subject. But, be careful. Automating trades, if not done properly, might end on you automating losses. FAQ4. I have just found that this strategy by default gives more than 3.97% of 'maximum series of losses'. That's unacceptable according to my risk management policy. You might want to reduce default stop loss setting from 7% to something like 5% till you are ok with the 'maximum series of losses'. FAQ5. Where can I learn more about your work on this strategy? Check the source code. You might find unused strategies. Either because there's not a substantial increases on earnings. Or maybe because they have not been implemented yet. FAQ6. How much leverage is applied in this strategy? No leverage. FAQ7. Any difference with original Jaime Merino strategy? Most of the times Jaime defines an stop loss at the price entry. That's not the case here. The default stop loss is 7% (but, don't be confused it only means losing 1% of your investment thanks to risk management). There's also a trailing take profit that triggers at 2% profit with a 1% trailing. FAQ8. Why this strategy return is so small? The strategy should be improved a lot. And, well, backtesting in this platform is not guaranteed to return theoric results comparable to real-life returns. That's why I'm personally forward testing this strategy to verify it. MENSAJE EN CASTELLANO En primer lugar se agradece feedback para mejorar la estrategia. Si eres un usuario avanzado y quieres colaborar en mejorar el script no dudes en comentar abajo. Ten en cuenta que aunque toda esta descripción tenga que estar en inglés no es obligatorio que el comentario esté en inglés. CHISTE - CASTELLANO ¡Pero Jaime! ¡400.000! ¡Tu da mun!Pine Script® strategyby ruckardUpdated 2828502
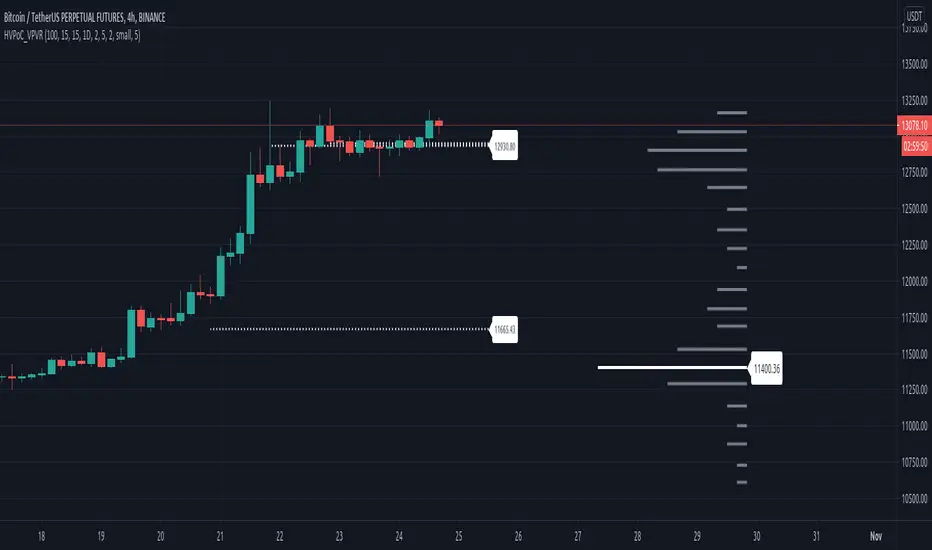
Historic VPoCs and pseudo VPVRThis study tries to recreate session based historic VPoCs and VPVR Volume Profile as they are used by TradingLatino TradingView user. It's aimed at BTCUSDT pair and 4h timeframe. HOW IT WORKS HOW IT WORKS - VPVR Profile Block It gathers volume from the last chosen Bars in order to draw the vpvr profile block Volume that intersects with current level range being studied is added to its value. Additionally the current level price is modified so that it matches the level price where most of the volume has concentrated So you get a pretty accurate price for drawn volume while at the same time the levels are not stuck to arbitrary level prices. HOW IT WORKS - VPoC It calculates a Volume Profile for the given historic session but then it only outputs that Volume Profile VPoC. SETTINGS Show VPVR Volume Profile {True}. Show Historic VPoC lines {True}. Show Historic VPoC labels {True}. Extend Historic VPoC lines {True}: If this option is turned off the VPoC lines are only shown during the session duration. Show tick difference from current price {False}: BETA. Feedback is needed because I'm not sure how it should work this setting. VPVR Number of bars {100}: Define the Visible Range in number of bars so that its Volume Profile can be shown. VPVR Profile width (in bars) {15}: VPVR Profile can be make larger or smaller in width thanks to this option. VPVR Profile offset (in bars) {15}: VPVR Profile can be shown more to the left or to the right if the defaults do not suit you. Historic Session Volume Profile timeframe {1D}: Historic VPoC use 1 day as their timeframe reference by default. Number of decimal digits {2}: How many decimal digits are shown in label prices. Number of previous sessions to print VPoC {5}: How many previous sessions VPoCs are to be printed. The maximum for this setting is 20. Historic VPoC lines width (in pixels) {2}. Historic VPoC labels size {small}. History VPoC line offset (in bars) {5}: How far to the right VPoCs lines are to be extended. Note: This setting does not apply when 'Extend Historic VPoC lines' is set to 'False'. WARNING Please be aware that VPoC from the first previous session might not be accurate due to Pine Script limitations. VPVR USAGE This is not a VPVR like the official TradingView indicator. This is a pseudo VPVR and that means it needs some manual input from you. But, don't worry it's quite easy to do and if you always use the same number of bars to calculate your VPVR then you might even just set it up once. In order to show the VPVR (or Volume Profile on the Visible Range): Rescale your chart so that you see all the bars for your Visible Range. Click on the ruler tool. Click on the last bar (far to the right) shown on the screen Drag the ruler to first bar (far to the left) shown on the screen Check what the ruler says E.g. it says: 101 bars Open this study settings Modify: 'VPVR Number of bars ' setting So that its value matches your measured number of bars (101) Press OK to confirm and wait for the indicator to refresh. STRATEGY USAGE If your strategy uses VPoC to define your resistances or supports you can check the VPoCs shown here. FEEDBACK I have only used this identifier in BTCUSDT 4h timeframe. I'm interested to know what needs to be tweaked in other securities and timeframes. PINE STUDY TRICK This study let's you choose the number of decimals the label will use. CREDITS I have reused and adapted some code from 'Poor man's volume profile' study which it's from TradingView IldarAkhmetgaleev user. I also wanted to thank him for helping me understanding his study. I have reused some code from 'MTF Selection Framework - PineCoders FAQ' study which it's from TradingView PineCoders user.Pine Script® indicatorby ruckardUpdated 1818 2.3 K
LB Squeeze Momentum DivergencesThis study tries to highlight LazyBear Squeeze Momentum divergences as they are defined by TradingLatino TradingView user Squeeze momentum green peaks are connected by a line Associated prices to these green peaks are also connected If both lines have a different slope orientation then there is a divergence. It only shows two last divergence lines and angles. The original chart screenshot shows some divergence lines on the top or main chart these were drawn manually because you cannot write to two different charts from the same pine script study (Well, not in August 2020 anyways) It's aimed at BTCUSDT pair and 4h timeframe. HOW IT WORKS Simple geometric mathematics are used to calculate the two lines degrees Then both degrees are compared to show if both lines agree ( // or \\ ) or if they disagree ( /\ or \/ ) SETTINGS (SQZDiver) Show degrees : Show degrees of each Squeeze Momentum Divergence lines to the x-axis. (SQZDiver) Show desviation labels : Whether to show or not desviation labels for the Squeeze Momentum Divergences. (SQZDiver) Show desviation lines : Whether to show or not desviation lines for the Squeeze Momentum Divergences. (ADX) Smoothing (ADX) DI Length (ADX) key level (ADX) Print : Whether to show or not scaled ADX line (SQZMOM) BB Length (SQZMOM) BB MultFactor (SQZMOM) KC Length (SQZMOM) KC MultFactor (SQZMOM) Use TrueRange (KC) (SQZMOM) Print : Whether to show or not Squeeze Momentum indicator. WARNING Some securities and timeframes might output degrees too next to zero. The code might need to be tweaked to meet your needs. USAGE One strategy is to sell when you are in a long entry when you find out that the price slope is upwards ( / ) while the lb smilb slope is downwards: ( \ ) E.g. You will see: / \ on the indicator. Why? Because it might signal you that the price is going to correct downwards soon. FEEDBACK 1 Please let me know if there is any other strategy based on the red side of LB Squeeze Momentum so that I might add support for it in the future. FEEDBACK 2 Calculating degrees in a chart with a different x-axis scale is a nightmare that's why I did not a range settings so that values next to zero are converted into zero and thus showing an horizontal line. Feedback is welcome on this matter. EXTRA 1 If you turn off showing the divergence lines and if you turn off showing the divergence labels you almost get what TradingLatino user uses as its default momentum indicator. EXTRA 2 Optionally this indicator can show you a rescaled ADX (it only works properly on 2020 Bitcoin charts) ABOUT COLOURS TradingLatino user has both dark green and light green inverted compared to this LB SQZMOM chart. CREDITS I have reused and adapted some code from 'Squeeze Momentum Indicator' study which it's from TradingView LazyBear user. I have reused and adapted some code from 'Directional Movement Index + ADX & Keylevel Support' study which it's from TradingView console user.Pine Script® indicatorby ruckardUpdated 1919579
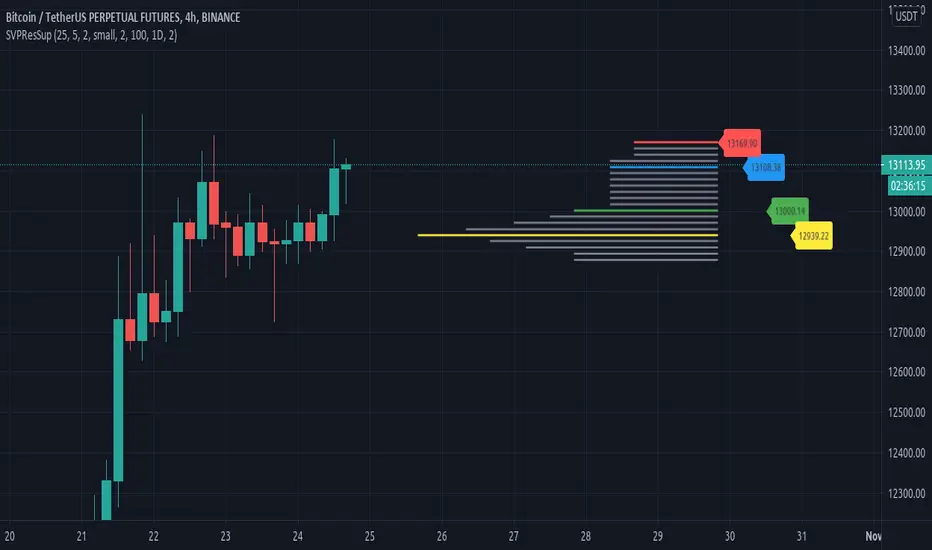
Resistances and supports based on simplified Volume ProfileThis study tries to highlight support and resistances as they are defined by TradingLatino TradingView user His definition is based on volume peaks on the official TradingView Volume Profile indicator that seem rather big on size. As a bonus it also serves as a rather simple volume profile indicator. As you can see it only show last blocks volume profile. It's aimed at BTCUSDT pair and 4h timeframe. HOW IT WORKS HOW IT WORKS - Recent Profile Block It gathers volume from the last 100 Bars in order to draw the recent profile block Volume that intersects with current level range being studied is added to its value. Additionally the current level price is modified so that it matches the level price where most of the volume has concentrated So you get a pretty accurate way of the volume while at the same time the level are not stuck to arbitrary level prices. HOW IT WORKS - Resistances and Supports It calculates the level which its price it's nearer (from below) to the current price level Resistance is found steping up (from current prive level) level by level till you find a level which its value is higher than the previous level value. Support is found steping down (from current prive level) level by level till you find a level which its value is higher than the previous level value. That way you ignore rather small resistances and support values. Finally the resistances and supports are drawn next to the recent profile block so that you can look at them with ease. If you hover over the label you can double check if you are looking at current price, resistance or support levels. SETTINGS Bars in recent profile block : How many previous period volumes are used to calculate the recent profile block Row width multiplier : Adjust how big the recent profile block seems to be Resistances prices number of decimal digits : How many digits is shown at the resistance and support level prices. WARNING Please be aware that depending on your security and timeframe you might need to modify the 'Bars in recent profile block' setting so that the study does not timeout. USAGE If your strategy calculates take profit limits on higher resistances based on volume you could use this indicator resistance detector FEEDBACK 1 This is my first volume indicator. I suppose that each trader has his own approach on defining resistances and supports. I'm interested on knowing if the default way this resistances and supports are calculated matches what other traders would have highlighted manually on the chart. FEEDBACK 2 I have only used this identifier in BTCUSDT 4h timeframe. I'm interested to know what needs to be tweaked in other securities and timeframes. PINE STUDY TRICK This study let's you choose the number of decimals the label will use. CREDITS I have reused and adapted some code from 'Poor man's volume profile' study which it's from TradingView IldarAkhmetgaleev user. I also wanted to thank him for helping me understanding his study. Pine Script® indicatorby ruckardUpdated 4343 3.8 K
Range identifier by medianThis study tries to highlight ranges as they are defined by TradingLatino TradingView user. The study uses median values. A range is defined as periods when the price does not move a lot. Its default values are aimed at BTCUSDT pair and 4h timeframe. HOW IT WORKS For each of the bars a '5' median is calculated based on the 'highest of open and close' For each of the bars a '5' median is calculated based on the 'lowest of open and close' Thanks to the desviation setting both medians have a tolerated maximum and a minimum Condition 1: The bar current 'highest of open and close' needs to be between the respective tolerated maximum and minimum Condition 2: The bar current 'lowest of open and close' needs to be between the respective tolerated maximum and minimum If both conditions are met then the bar is in a range SETTINGS Price range periods : How many previous periods are used to calculate the medians Price range maximum desviation (%) ( > 0 ): Maximum positive desviation for range detection Price range minimum desviation (%) ( > 0 ): Mininum negative desviation for range detection Desviations should be both of them a positive number WARNING Despite the name indicator does not identify the entire range. It identifies when you realise you are inside a range. E.g. If a range length is 8 periods length this range indicator will highlight only the last 6 periods of the range. USAGE If your strategy signals you an upwards trend then you might use this range detector to know when to exit your long position Why? Because most of the times the price is found to be in a range it goes down FEEDBACK 1 My former attempt on calculating ranges felt too much over complex that is why I decided to implement it with medians. It should be easier to modify if I want to desviation inputs to be calculated automatically in the future. I'm interested on different approaches on how to detect ranges. FEEDBACK 2 I have only used this identifier in BTCUSDT 4h timeframe. Feel free to comment down below with your suggested settings for your favourite pair and timeframe PINE SCRIPT TRICK This script simulates looping an string char by char in pine script. Pine Script® indicatorby ruckard94
Range identifier by angleThis study tries to highlight ranges as they are defined by TradingLatino TradingView user. A range according to its definition would consist of periods when the price does not move a lot. It's aimed at BTCUSDT pair and 4h timeframe. HOW IT WORKS Price source is the middle between open and close values. For each of the bars a '5' periods regression line is calculated The regression line has an angle with the 0-axis line which might be between 0 and 90. 0 angle would mean price is always the same 90 angle would mean price going to infinity When '2' of those periods in a row have their angles between a maximum angle and a minimum angle then you have the range SETTINGS Price range bar periods : How many previous periods are used to calculate the bar regression line Price range range periods : How many periods in a row should be used to say that there is a range Price range maximum angle ( < 90.0 !!! ): Maximum angle for range detection Price range minimum angle ( > -90.0 !!! ): Mininum angle for range detection Angles should be set from -89.99 for the minimum angle to +89.99 for the maximum angle WARNING Despite the name indicator does not identify the entire range. It identifies when you realise you are inside a range. E.g. If a range length is 8 periods length this range indicator will highlight only the last 6 periods of the range. USAGE If your strategy signals you an upwards trend then you might use this range detector to know when to exit your long position Why? Because most of the times the price is found to be in a range it goes down FEEDBACK 1 I'm quite sure this range approach by comparing angles is a novel one. I have checked Range Identifier script from TradingView LazyBear user and it uses another approach. I'm interested on different approaches on how to detect ranges. FEEDBACK 2 I have only used this identifier in BTCUSDT 4h timeframe. I'm interested to know if applying it more traditional stocks the degrees need to be adjusted to something more smaller. PINE SCRIPT TRICK This script simulates looping an string char by char in pine script. CREDITS I have reused and adapted some code from 'TF Segmented Linear Regression' script which it's from TradingView alexgrover user.Pine Script® indicatorby ruckard11166