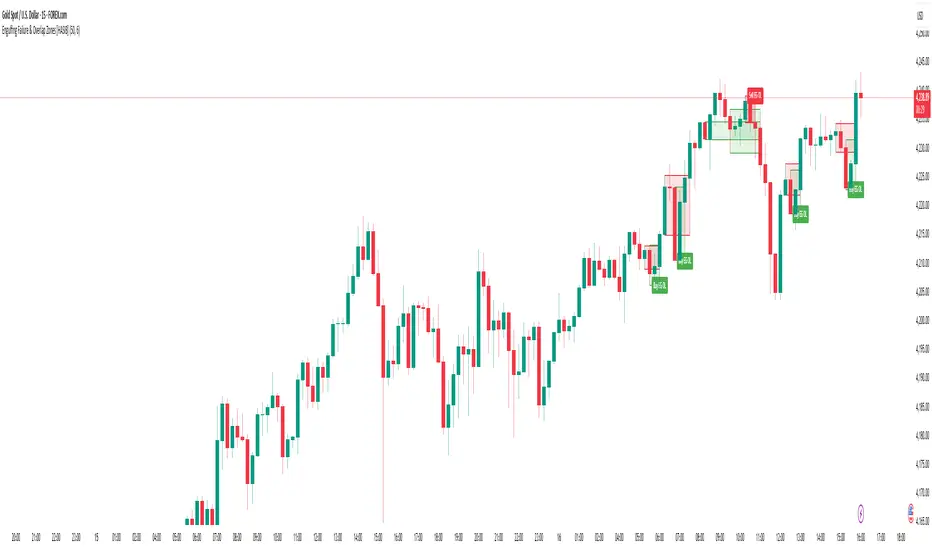
Engulfing Failure & Overlap Zones [HASIB]🧭 Overview
Engulfing Failure & Overlap Zones is a smart price action–based indicator that detects failed engulfing patterns and overlapping zones where potential liquidity traps or reversal setups often occur.
It’s designed to visually highlight both bullish and bearish failed engulfing areas with clean labels and zone markings, making it ideal for traders who follow Smart Money Concepts (SMC) or price action–driven trading.
⚙️ Core Concept
Engulfing patterns are powerful reversal signals — but not all of them succeed.
This indicator identifies:
When a Buy Engulfing setup fails and overlaps with a Sell Engulfing zone, and
When a Sell Engulfing setup fails and overlaps with a Buy Engulfing zone.
These overlapping areas often represent liquidity grab zones, reversal points, or Smart Money manipulation levels.
🎯 Key Features
✅ Detects both Buy and Sell Engulfing Failures
✅ Highlights Overlapping (OL) zones with colored rectangles
✅ Marks Buy EG OL / Sell EG OL labels automatically
✅ Fully customizable visuals — colors, padding, and zone styles
✅ Optimized for both scalping and swing trading
✅ Works on any timeframe and any instrument
⚡ How It Helps
Identify liquidity traps before reversals happen
Visually see Smart Money overlap zones between opposing engulfing structures
Strengthen your entry timing and confirmation zones
Combine with your own SMC or ICT-based trading setups for higher accuracy
📊 Recommended Use
Use on higher timeframes (e.g., M15, H1, H4) to confirm major liquidity zones.
Use on lower timeframes (e.g., M1–M5) for precision entries inside the detected zones.
Combine with tools like Order Blocks, Break of Structure (BOS), or Fair Value Gaps (FVG).
🧠 Pro Tip
When a failed engulfing overlaps with an opposite engulfing zone, it often signals market maker intent to reverse price direction after liquidity has been taken. Watch these zones closely for strong reaction candles.
TRAP
Friday & Monday HighlighterFriday & Monday Institutional Range Marker — Know Where Big Firms Set the Trap!
🧠 Description
This indicator automatically highlights Friday and Monday sessions on your chart — days when institutional players and algorithmic firms (like Citadel, Jane Street, or Tower Research) quietly shape the upcoming week’s price structure.
🔍 Why Friday & Monday matter
Friday : Large institutions often book profits or hedge into the weekend. Their final-hour moves reveal the next week’s bias.
Monday : Big players rebuild positions, absorbing liquidity left behind by retail traders.
Together, these two days define the range traps and breakout zones that often control price action until midweek.
> In short, the Friday–Monday high and low often act as invisible walls — guiding scalpers, option sellers, and swing traders alike.
🧩 What this tool does
✅ Highlights Friday (red) and Monday (green) sessions
✅ Adds optional day labels above bars
✅ Works across all timeframes (best on 15min to 1hr charts)
✅ Helps you visually identify where institutions likely built their positions
Use it to quickly spot:
* Range boundaries that trap traders
* Gap zones likely to get filled
* High–low sweeps before reversals
⚙️ Recommended Use
1. Mark Friday’s high–low → Watch for liquidity sweeps on Monday.
2. When Monday holds above Friday’s high , breakout continuation is likely.
3. When Monday fails below Friday’s low , expect a reversal or trap.
4. Combine this with OI shifts, IV crush, and FII–DII flow data for confirmation.
⚠️ Disclaimer
This indicator is for **educational and analytical purposes only**.
It does **not constitute financial advice** or a trading signal.
Markets are dynamic — always perform your own research before trading or investing.

Smart Money Trap Scanner [TradingFinder]🔵 Introduction
In many market conditions, what initially seems to be a decisive breakout often turns out to be nothing more than a false breakout or fake move. Price breaks through a significant structural level, such as a swing high or low or a key support and resistance zone, only to quickly return to its previous range. These moves, often driven by liquidity traps or market manipulation, typically signal structural weakness rather than the start of a new trend.
This screener is specifically designed to detect such situations. It focuses on identifying false breakouts and price returns to broken levels within a defined time window, and then looks for retracements into the Fibonacci zone. If price reenters the 0.618 to 1.0 retracement area and aligns with the time-based filters, the system flags a low-risk, high-probability entry opportunity.
To enhance the precision of signal detection, the screener categorizes setups into two distinct types based on the speed of the price reaction after a breakout. Type A signals occur when the price breaks a level and immediately returns to break-even within the very next candle indicating a sharp rejection and rapid invalidation of the breakout. In contrast, Type B signals involve a more gradual return to the broken level, typically taking between two to five candles. This differentiation allows traders to better assess the context and urgency of each trap, providing a clearer understanding of momentum and liquidity behavior behind the move.
Additionally, the screener includes a Signal Age feature, which displays how much time has passed since the last valid signal was generated. This allows traders to quickly assess signal freshness and avoid acting on outdated setups, especially in fast-moving market environments.
One of the key advantages of this tool is its ability to simultaneously scan multiple symbols and timeframes. It only triggers an alert when all conditions false breakout, structural return, and Fibonacci alignment are met. This allows traders to bypass the need for manually reviewing dozens of charts and instead concentrate on clean, valid, and structure-based setups with greater precision.
🔵 How to Use
This tool operates as a structure-based screener that continuously scans various symbols and timeframes. By combining price behavior analysis, structural breakout detection, and Fibonacci retracement zones, it only signals entries when the probability of reversal is significantly supported by liquidity logic and price correction depth.
The system doesn’t just monitor price movements beyond key levels like swing highs or lows. It also evaluates whether the move quickly reverses and absorbs liquidity. If so, Fibonacci is applied to measure the depth of the pullback and identify the most favorable entry zones.
🟣 Long Signal
A long setup is triggered when price temporarily breaks below a valid structural support or swing low. This initial move is typically designed to trigger stop losses and collect sell-side liquidity. If price returns to the broken level within five candles, it is considered a false breakout.
At this point, Fibonacci is drawn from the recent swing high to the new low. If price enters the 0.618 to 1.0 retracement zone within the next ten candles, a potential long entry aligned with Smart Money logic is activated. This deep retracement zone often offers the best low-risk entry, as it typically marks the area where liquidity has been absorbed and the breakout structure has failed.
The stop loss is placed slightly below the 1.0 level to account for minor fluctuations, while the target is set based on trend structure or risk-reward preferences.
🟣 Short Signal
A short setup begins with price temporarily breaking above a valid resistance or swing high. This breakout is often driven by buy-side liquidity collection or stop hunting. If price returns to the broken level within five candles, the move is marked as a breakout failure.
Fibonacci is then drawn from the recent swing low to the new high. If price enters the 0.618 to 1.0 zone within ten candles after the return, a short opportunity is confirmed. This area usually represents the maximum acceptable retracement before a continuation move to the downside and often triggers strong reactions.
The stop loss is placed just above the 1.0 level, and the target is defined based on the expected structure of the move or a predetermined reward ratio.
🟡 Advantages of the Screener
Unlike manual approaches that require constant monitoring of multiple charts, this tool functions as a fully automated screener across multiple symbols and timeframes. It continuously evaluates key levels, liquidity reactions, structural returns, and Fibonacci zones. An alert is only generated when all necessary conditions are met with high accuracy.
This ensures that traders avoid risky or misleading entries and stay focused on precise, verified, and logic-based setups — saving time, reducing noise, and improving consistency in decision-making.
🔵 Settings
🟣 Logical settings
Swing period : You can set the swing detection period.
Valid After Trigger Bars : Limits how many candles after a fake breakout the entry zone remains valid.
Max Swing Back Method : It is in two modes "All" and "Custom". If it is in "All" mode, it will check all swings, and if it is in "Custom" mode, it will check the swings to the extent you determine.
Max Swing Back : You can set the number of swings that will go back for checking.
🟣 Display Settings
Table on Chart : Allows users to choose the position of the signal dashboard either directly on the chart or below it, depending on their layout preference.
Number of Symbols : Enables users to control how many symbols are displayed in the screener table, from 10 to 20, adjustable in increments of 2 symbols for flexible screening depth.
Table Mode : This setting offers two layout styles for the signal table :
Basic : Mode displays symbols in a single column, using more vertical space.
Extended : Mode arranges symbols in pairs side-by-side, optimizing screen space with a more compact view.
Table Size : Lets you adjust the table’s visual size with options such as: auto, tiny, small, normal, large, huge.
Table Position : Sets the screen location of the table. Choose from 9 possible positions, combining vertical (top, middle, bottom) and horizontal (left, center, right) alignments.
🟣 Symbol Settings
Each of the 10 symbol slots comes with a full set of customizable parameters :
Symbol : Define or select the asset (e.g., XAUUSD, BTCUSD, EURUSD, etc.).
Timeframe : Set your desired timeframe for each symbol (e.g., 15, 60, 240, 1D).
🟣 Alert Settings
Alert : Enables alerts for SMT Screener.
Message Frequency : Determines the frequency of alerts. Options include 'All' (every function call), 'Once Per Bar' (first call within the bar), and 'Once Per Bar Close' (final script execution of the real-time bar). Default is 'Once per Bar'.
Show Alert Time by Time Zone : Configures the time zone for alert messages. Default is 'UTC'.
🔵 Conclusion
Many trading mistakes stem from misinterpreting price breaks and entering too early into deceptive moves. In a market environment where false breakouts, liquidity traps, and engineered movements are increasingly common, having a tool that accurately filters these events and frames them within a Fibonacci-based and time-filtered structure provides a real strategic edge.
This indicator merges market structure logic, false breakout detection, and precise retracement analysis to ensure trades are only taken when multiple technical factors are aligned. It not only enhances trade success rates but also helps avoid emotional or impulsive entries.
Moreover, with the ability to scan across several symbols and timeframes simultaneously, the tool goes beyond being just an indicator it becomes a semi-automated structural analysis system. For traders who base their decisions on price behavior, Smart Money logic, and structural retracements, this screener can become a key component of a disciplined and effective trading approach.
Paid script

True Breakout Pattern [TradingFinder] Breakout Signal Indicator🔵 Introduction
In many market conditions, what initially appears to be a decisive breakout often turns out to be nothing more than a false breakout or fake breakout. Price breaks through a key swing level or an important support and resistance zone, only to quickly return to its previous range.
These failed breakouts, which are often the result of liquidity traps or market manipulation, serve more as a warning sign of structural weakness than confirmation of a new trend.
This indicator is designed around the concept of the fake breakout.
The logic is simple but precise : when price breaks a swing level and returns to that level within a maximum of five candles, the move is considered a false breakout. At this point, a Fibonacci retracement is applied to the recent price swing to evaluate the pullback area.
If price, within ten candles after the return to the breakout level, enters the Fibonacci zone between 0.618 and 1.0, the setup becomes valid for a potential entry. This area is identified as a long entry zone, with the stop loss placed just beyond the 1.0 level and the take profit defined based on the desired risk-to-reward ratio.
By combining accurate detection of false breakouts, analysis of price reaction to swing levels, and alignment with Fibonacci retracement logic, this framework allows traders to identify opportunities often missed by others. In a market where failed breakouts are a common and recurring phenomenon, this indicator aims to transform these traps into measurable trading opportunities.
Long Setup :
Short Setup :
🔵 How to Use
This indicator operates based on the recognition of false breakouts from structural levels in the market, specifically swing levels, and combines that with Fibonacci retracement analysis.
In this strategy, trades are only considered when price returns to the broken level within a defined time window and reacts appropriately inside a predefined Fibonacci range. Depending on the direction of the initial breakout, the system outlines two scenarios for long and short setups.
🟣 Long Setup
In the long setup, price initially breaks below a support level or swing low. If the price returns to the broken level within a maximum of five candles, the move is identified as a fake breakout.
At this stage, a Fibonacci retracement is drawn from the recent high to the low. If price, within ten candles of returning to the level, moves into the 0.618 to 1.0 Fibonacci zone, the conditions for a long entry are met.
The stop loss is placed slightly below the 1.0 level, while the take profit is set based on the trader’s preferred risk-reward ratio. This setup aims to capture deeply discounted entries at low risk, aligned with smart money reversals.
🟣 Short Setup
In the short setup, the price breaks above a resistance level or swing high. If the price returns to that level within five candles, the move is again treated as a false breakout. Fibonacci is then drawn from the recent low to the high to observe the retracement area.
Should price enter the 0.618 to 1.0 Fibonacci range within ten candles of returning, a short entry is considered valid. In this case, the stop loss is placed just above the 1.0 level, and the take profit is adjusted based on the intended risk-reward target. This method allows traders to identify high-probability short setups by focusing on failed breakouts and deep pullbacks.
🔵 Settings
🟣 Logical settings
Swing period : You can set the swing detection period.
Valid After Trigger Bars : Limits how many candles after a fake breakout the entry zone remains valid.
Max Swing Back Method : It is in two modes "All" and "Custom". If it is in "All" mode, it will check all swings, and if it is in "Custom" mode, it will check the swings to the extent you determine.
Max Swing Back : You can set the number of swings that will go back for checking.
🟣 Display settings
Displaying or not displaying swings and setting the color of labels and lines.
🟣 Alert Settings
Alert False Breakout : Enables alerts for Breakout.
Message Frequency : Determines the frequency of alerts. Options include 'All' (every function call), 'Once Per Bar' (first call within the bar), and 'Once Per Bar Close' (final script execution of the real-time bar). Default is 'Once per Bar'.
Show Alert Time by Time Zone : Configures the time zone for alert messages. Default is 'UTC'.
🔵 Conclusion
A sound understanding of the false breakout phenomenon and its relationship to structural price behavior is essential for technical traders aiming to improve precision and consistency. Many poor trading decisions stem from misinterpreting failed breakouts and entering too early into weak signals.
A structured approach, grounded in the analysis of swing levels and validated through specific price action and timing rules, can turn these misleading moves into valuable trade opportunities.
This indicator, by combining fake breakout detection with time filters and Fibonacci-based retracement zones, helps traders only engage with the market when multiple confirming factors are in alignment. The result is a strategy that emphasizes probability, risk control, and clarity in decision-making, offering a solid edge in navigating today’s volatile markets.

Liquidity Trap Reversal Pro (Radar v2)Liquidity Trap Reversal Pro (Radar v2) is a non-repainting indicator designed to detect hidden liquidity traps at key swing highs and lows. It combines wick analysis, volume spike detection, and optional trend and exhaustion filters to identify high-probability reversal setups.
🔷 Features:
Non-Repainting: Pivots confirmed after lookback period, no future leaking.
Volume Spike Detection: Filters traps that occur during major liquidity events.
EMA Trend Filter (Optional): Focus on traps aligned with the prevailing trend.
Higher Timeframe Trend Filter (Optional): Confirm traps using a higher timeframe EMA bias.
Exhaustion Guard (Optional): Prevents traps after overextended moves based on ATR stretch.
Clean Visuals: Distinct plots for raw trap points vs confirmed traps.
Alerts Included: Set alerts for confirmed high/low liquidity traps.
📚 How to Use:
Watch for Trap Signals:
A Trap High signal suggests a potential bearish reversal.
A Trap Low signal suggests a potential bullish reversal.
Use Confirmed Signals for Best Entries:
Confirmed traps fire only after price moves opposite to the trap direction, adding reliability.
Use Trend Filters to Improve Accuracy:
In an uptrend (price above EMA), prefer Trap Lows (buy setups).
In a downtrend (price below EMA), prefer Trap Highs (sell setups).
Use the Exhaustion Guard to Avoid Bad Trades:
This filter blocks signals when price has moved too far from trend, helping avoid late entries.
Recommended Settings:
Best used on 15-minute, 1-hour, or 4-hour charts.
Trend filter ON for trending markets.
Exhaustion guard ON for volatile or stretched markets.
📈 Important Notes:
This script does not repaint once a pivot is confirmed.
Alerts trigger only on confirmed trap signals.
Always combine signals with sound risk management and trading strategy.
Disclaimer:
This script is for educational purposes only. It is not investment advice or a guarantee of results. Always do your own research before trading.

Globex Trap ZoneGlobex Trap Indicator
A powerful tool designed to identify potential trading opportunities by analyzing the relationship between Globex session ranges and Supply & Demand zones during regular trading hours.
Key Features
Tracks and visualizes Globex session price ranges
Identifies key Supply & Demand zones during regular trading hours
Highlights potential trap areas where price might experience significant reactions
Fully customizable time ranges and visual settings
Clear labeling of Globex highs and lows
How It Works
The indicator tracks two key periods:
Globex Session (Default: 6:00 PM - 9:30 AM)
Monitors overnight price action
Marks session high and low
Helps identify potential range breakouts
Supply & Demand Zone (Default: 8:00 AM - 11:00 AM)
Tracks price action during key market hours
Identifies potential reaction zones
Helps spot institutional trading areas
Best Practices for Using This Indicator
Use on 1-hour timeframe or lower for optimal visualization
Best suited for futures and other instruments traded during Globex sessions
Pay attention to areas where Globex range and Supply/Demand zones overlap
Use in conjunction with your existing trading strategy for confirmation
Recommended minimum of 10 days of historical data for context
Settings Explanation
Globex Session: Customizable time range for overnight trading session
Supply & Demand Zone: Adjustable time range for regular trading hours
Days to Look Back: Number of historical days to display (default: 10)
Visual Settings: Customizable colors and transparency for both zones
Important Notes
All times are based on exchange timezone
The indicator respects overnight sessions and properly handles timezone transitions
Historical data requirements: Minimum 10 days recommended
Performance impact: Optimized for smooth operation with minimal resource usage
Disclaimer
Past performance is not indicative of future results. This indicator is designed to be used as part of a comprehensive trading strategy and should not be relied upon as the sole basis for trading decisions.
Updates and Support
I actively maintain this indicator and welcome feedback from the trading community. Please feel free to leave comments or suggestions for improvements.

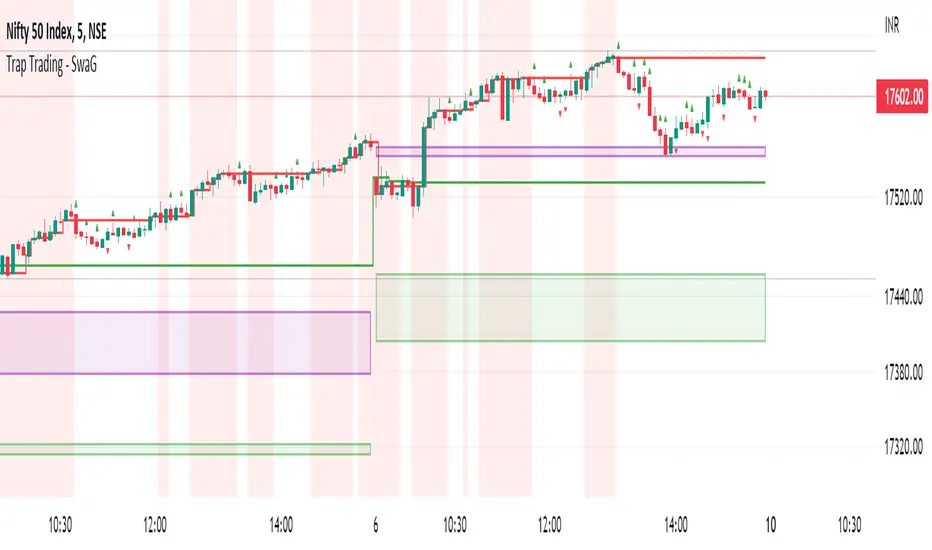
Trap Trading - SwaGThis is an intraday indicator
Set timeframe to 5 min
Take long entry on the high brakes of selling traps
Take short entry on the low brakes of buying traps
ignore traps left to red zones
Use the nearest trap
take profit/loss on a 1:2 risk-to-reward basis.
Trap Trading
Trap trading is a trading strategy that seeks to profit from false breakouts in financial markets. This strategy is based on the idea that when the market breaks through a key level of support or resistance, many traders will take that as a signal to enter or exit trades, causing the price to move further in the breakout direction.
However, in some cases, the market will quickly reverse course and move in the opposite direction, trapping those traders who entered the trade based on the breakout. This can create a trading opportunity for those who are able to identify the false breakout and trade in the opposite direction.
The trap trading strategy typically involves identifying a key level of support or resistance on a price chart and then waiting for the market to break through that level. If the price continues to move in the breakout direction, the trader may enter a trade in that direction with a stop loss set just below the breakout level.
However, if the market quickly reverses and moves back below the breakout level, the trader may enter a trade in the opposite direction with a stop loss set just above the breakout level. The idea is to take advantage of the trapped traders who entered the trade based on the false breakout, and profit from the market's reversal.
As with any trading strategy, there are risks and potential drawbacks to trap trading. False breakouts can be difficult to identify, and there is always the risk that the market will continue to move in the breakout direction, resulting in losses for the trader. Additionally, trap trading requires a solid understanding of technical analysis and market trends, which may take time and experience to develop.
Money Heist• This strategy is based off of Matthew Thayers Cashtrap Strategy.
• Market Timing markers based off of Evan Cabrals Market Timing Strategy.
• Psychological Support and Resistance Levels as well as 4 Hour High and Low Support and Resistance Levels.
• The Bollinger Bands will turn Red for Resistance and Green for Support when the Market is Consolidating. The bands will turn Red at the Bottom and Green at the Top when the Market is in a Heavy Trend.
• There is a 50 ema and 200 ema used to determine the trend of price and can also be used as support and resistance
• Two types of arrows can be used by heading to the settings and choosing one or the other. Either Conditional arrows based on a point system (3 being the highest) can be used or Regular CashTrap Arrows. Arrows should be used to confirm trade not as a the only reason to take a trade
PUT
Price should be below 50 EMA and 200EMA touching Top Red Bollinger Band at a Resistance level
CALL
Price should be above 50 EMA and 200EMA touching Bottom Green Bollinger Band at a Support Level
**This Strategy Is To Be Used With The Momentum RSI, Stochastic+, and RSI+**

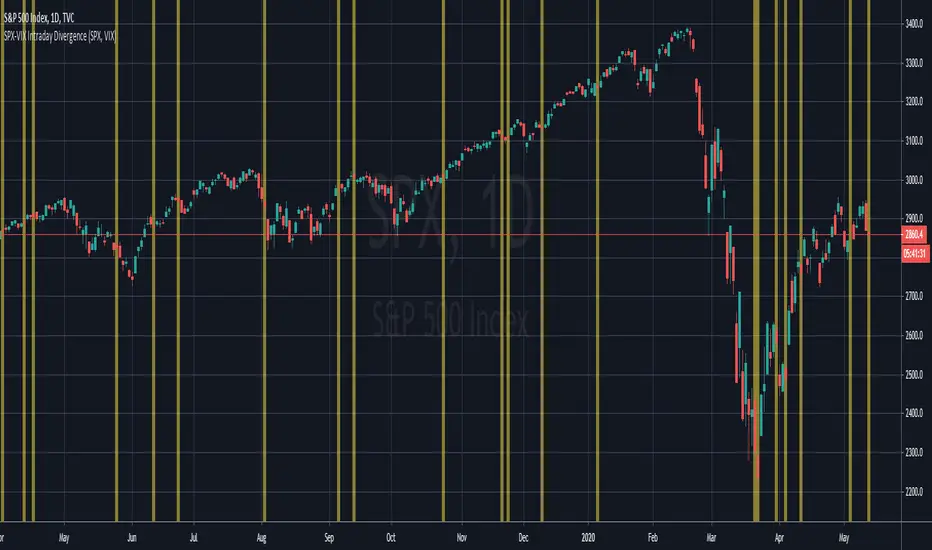
SPX-VIX Intraday DivergenceAs a long-term buyer/short-seller, you will always find different ways to enter the market , moving average crossovers, breakouts , overbought/oversold conditions being some of the classy methods. However, they are decreasingly effective... 😢
Recently I have realized that analysis beyond the technical indicators will bring trading to the next level because I will be able to confirm my trading signals without relying too much on basic price actions and patterns which are easily manipulated by big banks and institutions. 👍
Today I will introduce you to my divergence indicator making use of SPX and VIX. Unlike MacD or RSI divegence , which would involve normative judgement , it will take account of the unusual move by SPX alongwith the VIX , to the exploit chances that options market, where most experienced investors participated in has a preceding insight into the equity market about the upcoming moves.
I have divided signals into two groups.
Bullish divergence - SPX Down , VIX also Down 👇
Bearish divergence - SPX Up , VIX also Up 👆
I hope this script will enable us to take advantage of the options market activities , to provide a REAL divergence signal, and be used coupled with our own chart patterns or other price signals, and more importantly to score more and more winning trades!!!
If you want more useful scripts from me, please like and share my posts. And don't forget to follow my account to grab the latest ideas and tools! 😘