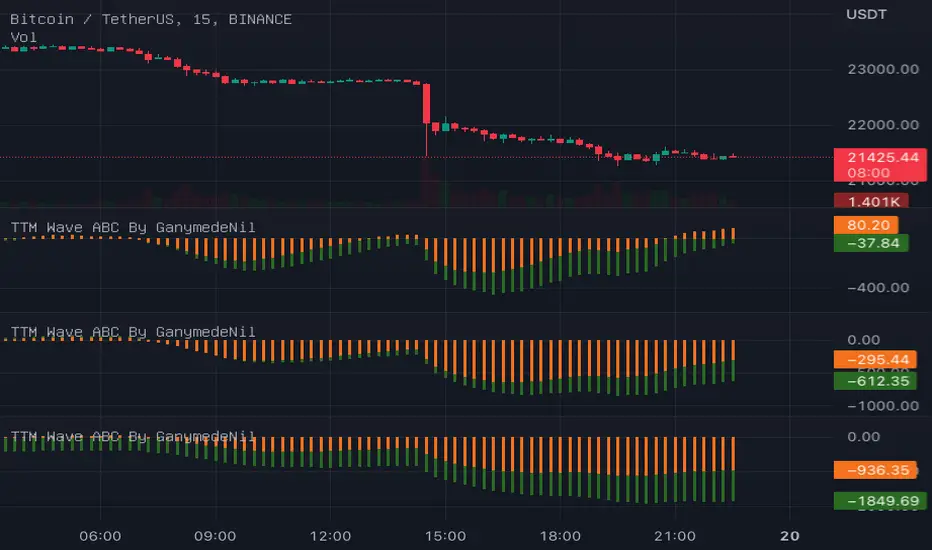
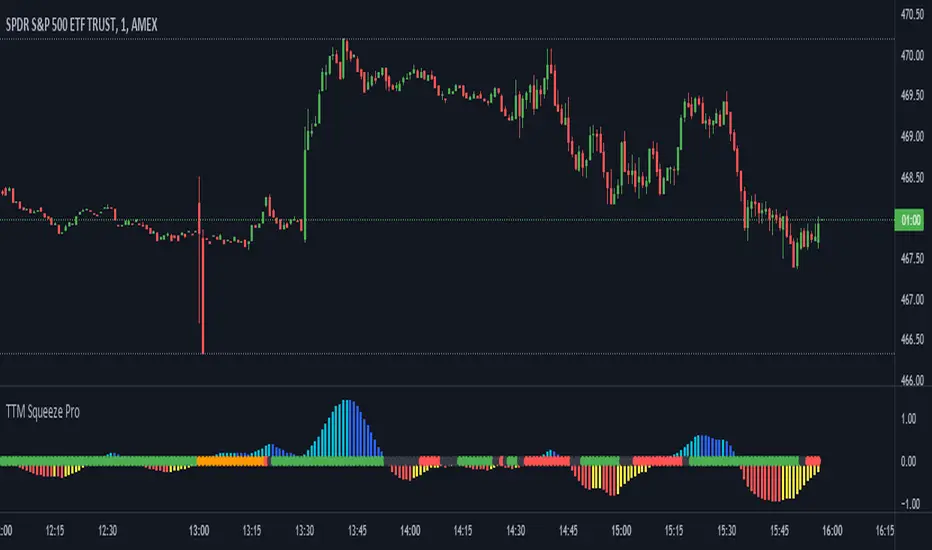
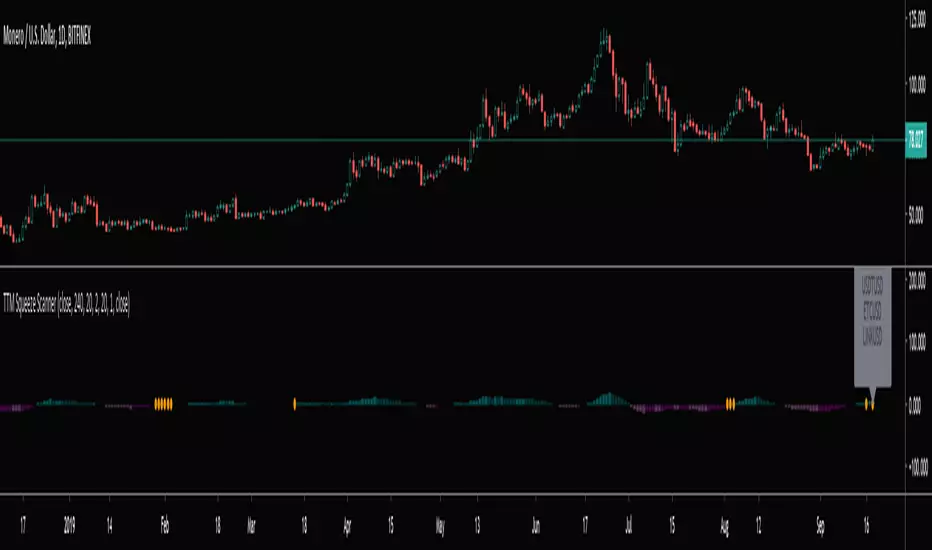
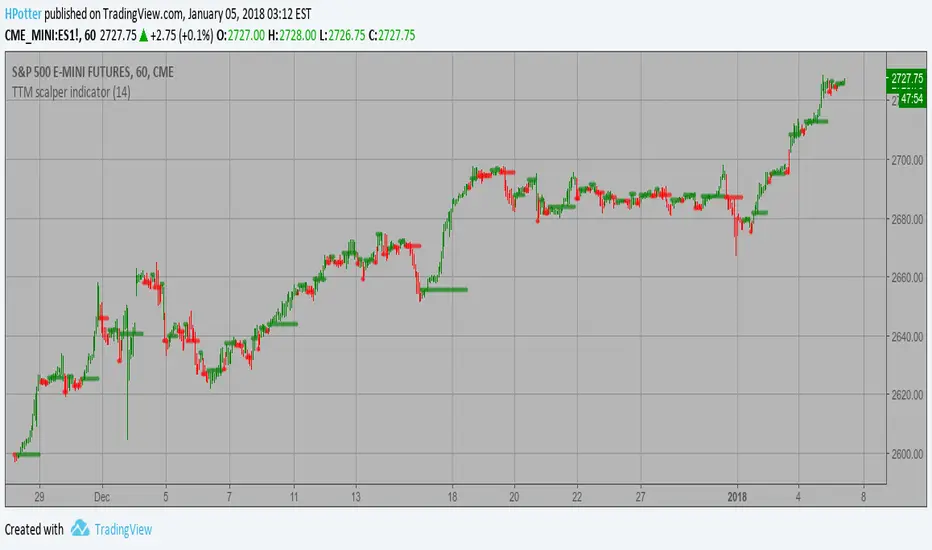
TTM Squeeze [ST]**TTM Squeeze ** is a streamlined volatility indicator designed to identify periods of consolidation before potential price breakouts.
This version focuses exclusively on the "Squeeze Dots" component, making it a lightweight and minimalist tool for traders who want to filter low-volatility environments without the clutter of a momentum histogram.
### 🛠 Key Concepts
The indicator compares **Bollinger Bands** (Standard Deviation) with **Keltner Channels** (Average True Range):
1. **🔴 Red Dots (Squeeze ON):**
* Occurs when Bollinger Bands contract *inside* the Keltner Channels.
* **Meaning:** Volatility is extremely low. The market is "coiling" or building up energy.
* **Action:** Prepare for a potential breakout. Do not trade the chop; wait for expansion.
2. **⚫ Dark Gray Dots (Squeeze OFF):**
* Occurs when Bollinger Bands expand *outside* the Keltner Channels.
* **Meaning:** The squeeze has "fired." Volatility is expanding.
* **Action:** The move has likely started.
### ⚙️ Standardization
* **Part of the Suite:** Standardized inputs and optimized performance.
* **English Native:** Codebase and settings translated to English.
* **Version Control:** Internal version tracking included.
### 📋 How to Use
Use this tool as a "Go / No-Go" filter for your trades.
* If the dot is **Red**, avoid entering new trend-following positions, as the price is likely chopping sideways.
* Wait for the first **Gray** dot after a series of Red dots to signal the start of a new volatility expansion phase.
---
*Disclaimer: This tool is for educational purposes and technical analysis assistance only. Always manage your risk.*
Pine Script® indicator