Dynamic Strike Selection Indicator [ARJO]Dynamic Strike Selection Indicator
OVERVIEW
The Dynamic Strike Selection Indicator is a visual analysis tool designed for traders observing NSE (National Stock Exchange of India) instruments, particularly those interested in options. It displays a trend-based oscillator in the lower chart pane and automatically calculates option strike prices , presenting them in an easy-to-read table. The indicator helps users observe trend changes and understand how option strikes might be selected based on current market conditions.
IT has a dashboard that shows you:
Where the trend might be heading (through the oscillator)
What option strikes align with the current price level
When trend transitions occurred
CONCEPTS
This indicator combines several technical analysis concepts in a beginner-friendly format:
1. Trend Observation (Chandelier Exit)
The indicator uses a method called "Chandelier Exit" which observes price volatility to identify potential trend directions. When the indicator shows green, it suggests an upward trend pattern; red suggests a downward pattern. These are reference points, not predictions.
2. Smoothed Price Movement
Raw price data can be noisy. This indicator applies mathematical smoothing (called "Ehlers 2-Pole filter") to reduce short-term fluctuations, making it easier to observe the underlying trend direction.
3. Momentum Oscillator
The oscillator (displayed as bars and lines in the lower pane) shows the difference between smoothed price and its moving average. Positive values suggest upward momentum; negative values suggest downward momentum . This is similar to how MACD or LBR works.
4. Strike Price Calculation
For option traders , the indicator automatically calculates:
ATM (At-The-Money): The strike price closest to the current underlying price
OTM (Out-of-The-Money): Strike prices at a distance from ATM, based on your settings
These calculations use standard rounding methods based on each instrument's official strike interval.
FEATURES
Visual Components:
Color-Coded Oscillator: Green/teal for potential uptrend, purple/red for potential downtrend
Histogram Display: Visual bars showing momentum strength
Chandelier Exit Lines: Plotted on the main price chart as reference levels
Information Table: Displays calculated strikes, timestamps, and optional tracking data
Supported Instruments:
Major indices: NIFTY, BANKNIFTY
Popular stocks: RELIANCE, HDFCBANK, ICICIBANK, INFY, TCS, SBIN, and more
Any NSE instrument (using manual strike interval setting)
Flexible Configuration:
Choose between "Sell Mode" and "Buy Mode" perspectives
Customize strike interval for any instrument
Adjust sensitivity of trend detection
Modify visual appearance (colors, table position, text size)
Track entry prices and observe P&L calculations (for reference only)
Features:
Automatic strike interval detection for predefined instruments
Manual override option for custom requirements
Real-time option premium fetching (where available)
Timestamp recording of trend transitions
Active trade highlighting based on current trend
HOW TO USE
Step 1: Adding the Indicator
Open your TradingView chart with an NSE instrument (e.g., NIFTY, BANKNIFTY, or any stock)
Search for " Dynamic Strike Selection Indicator " in the Indicators menu
Click to add it to your chart
You'll see an oscillator appear in a pane below your price chart and a table in the corner
Step 2: Basic Settings
Click the settings (gear icon) on the indicator. Here are the key settings to understand:
Symbol Settings:
Symbol Source: Keep it on " Use Chart Symbol " to analyze whatever instrument is on your chart
Custom Symbol: Only change if you want to analyze a different instrument while viewing another chart
Expiry Date:
Set the expiry date of the option contracts you're observing
Use the dropdown menus for Day, Month, and Year
Example: For 30th January 2025, select Day: 30, Month: 01, Year: 25
Trade Entry (Optional):
Trade Mode: Choose "Sell" or "Buy" based on your observation perspective
Lot Size: Enter your intended lot size for P&L calculation reference
PUT/CALL Entry Price: Manually enter prices if you want to track reference P&L
OTM Strike Distance:
Default is 4 (means 4 strikes away from ATM)
Increase for further OTM strikes, decrease for closer strikes
Step 3: Understanding the Display
The Oscillator (Lower Pane):
Green/Teal Bars: Suggest bullish momentum characteristics
Purple/Red Bars: Suggest bearish momentum characteristics
Zero Line: The reference point - above suggests strength, below suggests weakness
Color Change: When the oscillator changes from red to green (or vice versa), it indicates a potential trend transition
Active Row Highlighting:
In Sell Mode: Green background on PUT row during uptrend, Red background on CALL row during downtrend
In Buy Mode: Green background on PUT row during downtrend, Red background on CALL row during uptrend
This helps you observe which strike aligns with the current trend direction
Visual Customization:
Change oscillator colors under "Color Settings"
Adjust table position, size, and transparency under "Table Settings"
Modify table colors to match your chart theme
NOTES FOR BEGINNERS
Start Simple: Use default settings first. Don't change too many parameters initially.
Paper Trade First: Observe the indicator for several days before considering any real trades. Note how often trend transitions occur and how strikes align.
Understand Your Instrument: Know the strike interval for your chosen stock/index. NIFTY/BANKNIFTY use 100, most stocks use 10, 20, or 50.
Timeframe Matters: The indicator behaves differently on different timeframes. A 5-minute chart will show more transitions than a 1-hour chart.
Use with Other Analysis: This indicator is one tool among many. Combine with price action, support/resistance, and volume analysis.
Don't Chase: Just because a transition occurs doesn't mean you must act. Observe the quality of the move.
Backtest Observations: Use TradingView's replay feature to observe how the indicator performed historically.
CONCLUSION
The Dynamic Strike Selection Indicator serves as an educational tool for observing trend-based oscillator patterns and understanding how option strikes might be mathematically selected based on current market conditions. It combines visual trend analysis with structured strike price calculations, helping users study the relationship between momentum patterns and option strike references.
The indicator is designed to enhance chart interpretation skills and provide transparency into strike selection methodologies. It does not predict future price movements or guarantee any outcomes. Users are encouraged to use it as one component of a broader analytical approach, always conducting independent research and maintaining realistic expectations about market analysis tools.
DISCLAIMER
This indicator is strictly for educational and analytical observation purposes. It is NOT a trading system, signal generator, or financial advisory service.
What This Indicator Does NOT Do:
Does not predict future price movements with certainty
Does not guarantee profitable trades or outcomes
Does not constitute financial, investment, or trading advice
Does not replace the need for independent research and analysis
Does not eliminate trading risks or ensure success
What You Must Understand:
All calculated strikes, P&L values, and trend observations are informational references only
Option trading involves substantial risk and can result in complete loss of invested capital
Past indicator performance does not predict future results
Trend transitions shown are historical observations, not predictions
The "active" highlighting is a visual reference tool, not a trade recommendation
Conduct thorough independent research before taking any trading decision. and consult qualified, licensed financial professionals for personalized advice.
The creator of this indicator is not a registered investment advisor, broker, or financial planner. This tool is provided "as is" without warranties of any kind. By using this indicator, you acknowledge that you understand these risks and limitations, and you agree that all trading decisions and their consequences are solely your responsibility. If you do not fully understand these risks or are unsure about options trading, do not use this indicator for live trading .
Volatility Stop

Profit Punch: Risk & Target Planner (ATR + Fixed R)Profit Punch: Risk & Target Planner (ATR + Fixed R)
This indicator is a complete trade planning tool designed to visualize your Risk (R) and Reward levels instantly. Whether you use a volatility-based strategy (ATR) or precise manual levels, this tool draws your roadmap directly on the chart.
It solves the problem of calculating "R-Multiples" manually and ensures every trade plan is consistent.
Key Features
1. Smart Risk Calculation
Auto Mode (ATR): Uses the stock's daily volatility (ATR) to automatically suggest a logical Stop Loss.
Manual Mode: Lets you type in your exact Stop Loss price (e.g., below a recent low), and the tool automatically adjusts your Profit Targets to match that specific risk.
2. Hybrid Targeting (The "Nuance")
You can set a tight manual stop but keep your profit targets based on daily volatility (ATR). This allows for "Hybrid" setups where you risk a small amount (tight stop) but aim for a standard volatility move (ATR targets).
3. Backtesting Friendly
Use the "Target Date" feature to apply the tool to any past candle. It will calculate the targets based on what the volatility was on that specific day , allowing you to accurately review past trades.
4. Clean & Customizable
Editable Labels: Rename "1R" to "Goal 1" or "Take Profit".
Clean Look: Toggle any line on/off to keep your chart simple.
Timeframe Independent: Calculations are always anchored to Daily data for consistency, even if you are viewing a 5-minute chart.
How to Use
Step 1: Add to Chart. The lines will appear on the latest bar by default.
Step 2: Set Entry. In Settings, check "Use Manual Entry" to type your exact buy price, or leave unchecked to use the closing price.
Step 3: Set Stop. Choose "Auto (ATR)" for a volatility-based stop, or "Manual Price" to type in your specific stop level.
Step 4: Visualize. The tool draws your 1R, 3R, 5R, and 7R targets instantly.
Settings Guide
Risk Factor: Multiplier for the ATR calculation (Default is 1.5).
Target Base: Choose whether profit targets are multiples of your Stop Distance (Classic) or Fixed ATR (Volatility).
Custom Labels: Change the text displayed on the chart (e.g., "Safe Exit" instead of "1R").
Who is this for?
This tool is built for swing traders, educators, and anyone who uses "R-Multiples" (Risk Units) to manage their portfolio. It is especially useful for creating consistent trade plan screenshots.

Luminous Volatility Flux [Pineify]```
Luminous Volatility Flux - Dynamic ATR Bands with Hull Moving Average Baseline
The Luminous Volatility Flux indicator is a sophisticated trend-following and volatility analysis tool that combines the responsiveness of the Hull Moving Average (HMA) with adaptive ATR-based bands that expand and contract based on real-time market volatility conditions. This indicator helps traders identify trend direction, volatility regimes, and potential breakout opportunities with high-probability entry signals.
Key Features
Hull Moving Average baseline for low-lag trend detection
Dynamic volatility bands that breathe with market conditions
Flux Factor system comparing short-term vs long-term ATR
Volatility-filtered breakout signals to reduce false entries
Gradient-filled zones for intuitive visual analysis
Real-time bar coloring based on trend direction
How It Works
The indicator operates on three core calculation layers:
1. Hull Moving Average Baseline
The foundation of this indicator is the Hull Moving Average, calculated using the formula: WMA(2*WMA(n/2) - WMA(n), sqrt(n)). Unlike traditional moving averages, the HMA dramatically reduces lag while maintaining smoothness. This makes it ideal for identifying trend changes earlier than conventional EMAs or SMAs. When the HMA is rising, the baseline turns green indicating bullish momentum; when falling, it turns red for bearish conditions.
2. Volatility Flux Factor
The unique aspect of this indicator is the Flux Factor calculation. It compares short-term ATR (default 14 periods) against long-term ATR (default 100 periods) to determine the current volatility regime:
Flux Factor > 1.0 = Volatility Expansion (market is more volatile than usual)
Flux Factor < 1.0 = Volatility Compression (market is in a squeeze)
This ratio creates a dynamic multiplier that causes the bands to expand during high volatility periods and contract during consolidation phases.
3. Dynamic Band Calculation
The upper and lower bands are calculated as: Baseline ± (Short ATR × Multiplier × Flux Factor). This means the bands automatically widen when volatility increases and tighten during quiet market conditions, providing context-aware support and resistance levels.
Trading Ideas and Insights
Trend Following: Trade in the direction of the baseline color. Green baseline suggests looking for long opportunities; red baseline suggests short opportunities.
Volatility Breakouts: The indicator plots "Flux" signals when price breaks above the upper band (bullish) or below the lower band (bearish) during volatility expansion phases. These signals indicate potential momentum continuation.
Mean Reversion: During compression phases (tight bands), prices often revert to the baseline. Consider taking profits near the bands and re-entering near the baseline.
Squeeze Detection: When bands are unusually tight (Flux Factor < 1), the market is coiling for a potential explosive move. Prepare for breakout trades.
How Multiple Indicators Work Together
This indicator integrates three distinct technical analysis concepts into a cohesive system:
The Hull Moving Average provides the trend direction foundation with minimal lag. The dual ATR comparison (short vs long) creates the Flux Factor that measures relative volatility. The dynamic bands combine both elements, using the HMA as the center and ATR-based deviations that scale with the Flux Factor.
The synergy works as follows: The HMA identifies the trend, the Flux Factor determines market regime (expansion vs compression), and the bands provide dynamic support/resistance levels. Breakout signals only trigger when all components align - price breaks the band AND volatility is expanding. This multi-layered approach filters out many false signals that would occur with static bands or simple moving average crossovers.
Unique Aspects
Unlike Bollinger Bands that use standard deviation, this indicator uses ATR ratio-based dynamic bands that better capture directional volatility
The Flux Factor concept is original - comparing two ATR timeframes to create a volatility regime indicator
Breakout signals are filtered by volatility expansion, reducing false signals during choppy, low-volatility conditions
Gradient fills provide instant visual feedback on the strength of the bullish or bearish zones
How to Use
Add the indicator to your chart. It works on all timeframes and instruments.
Observe the baseline color for overall trend direction (green = bullish, red = bearish).
Watch for band expansion/contraction to gauge volatility regime.
Look for "Flux" signals for potential breakout entries - these appear only during volatility expansion.
Use the gradient zones to identify potential support (lower green zone) and resistance (upper red zone) areas.
Customization
Baseline Length (default: 24) - Controls the HMA period. Lower values = more responsive but noisier; higher values = smoother but more lag.
ATR Length (default: 14) - Short-term ATR period for band calculation. Standard setting works well for most markets.
Flux Multiplier (default: 2.0) - Controls band width. Increase for wider bands (fewer signals), decrease for tighter bands (more signals).
Flux Sensitivity (default: 100) - Long-term ATR period for Flux Factor calculation. Higher values create a more stable volatility reference.
Conclusion
The Luminous Volatility Flux indicator offers traders a comprehensive view of market conditions by combining trend detection, volatility analysis, and signal generation into one elegant tool. Its adaptive nature makes it suitable for various market conditions - from trending markets where it identifies direction and momentum, to ranging markets where it highlights compression and potential breakout zones. The volatility-filtered signals help traders focus on high-probability setups while the visual gradient fills make chart analysis intuitive and efficient.
Note: This indicator is designed as a technical analysis tool. Always use proper risk management and consider multiple factors before making trading decisions. Past performance does not guarantee future results.
```

ATR Stop LinesATR Stop Lines
Plots dynamic stop-loss levels on the price chart based on ATR (Average True Range). Optionally adjusts stop distance based on volatility regime.
━━━━━━━━━━━━━━━━━━━━━━━━━━━━━━
🎯 WHAT IT DOES
Green line — Long stop (Close − ATR × multiplier)
Red line — Short stop (Close + ATR × multiplier)
Lines move with price and volatility. When regime-adjust is enabled, stop distance widens in high volatility and tightens in low volatility.
━━━━━━━━━━━━━━━━━━━━━━━━━━━━━━
📐 REGIME-ADJUSTED MULTIPLIERS
When enabled, the multiplier auto-adjusts based on the ATR percentile:
LOW (< 25th pctl) — 1.0× ATR — Tight stops, small moves expected
NORMAL (25–50th pctl) — 1.5× ATR — Standard distance
HIGH (50–75th pctl) — 2.0× ATR — Wider to avoid noise
EXTREME (> 75th pctl) — 2.5× ATR — Widest, or skip the trade
Disable regime-adjust to use a fixed multiplier for all conditions.
━━━━━━━━━━━━━━━━━━━━━━━━━━━━━━
📈 HOW TO USE
Entry: Note stop line level when entering a trade. Set stop-loss at or beyond that level.
Trailing: Move stop to new line level as price advances in your favor.
Sizing: Wider stop = smaller position to maintain constant risk.
Example:
BTC Daily, ATR = \$2,000, Regime = HIGH (2.0×)
Entry: \$50,000 → Long stop: \$46,000 / Short stop: \$54,000
━━━━━━━━━━━━━━━━━━━━━━━━━━━━━━
📊 STATUS LABEL
VOL — Current regime (LOW / NORMAL / HIGH / EXTREME)
ATR — Raw ATR value in price units
Mult — Active multiplier
Stop Dist — Current stop distance in price units
━━━━━━━━━━━━━━━━━━━━━━━━━━━━━━
⚙️ SETTINGS
ATR Settings:
ATR Length (default: 14)
Percentile Lookback (default: 100)
Timeframe:
Use Fixed Timeframe — Lock to specific TF
Fixed Timeframe (default: D)
Stop Settings:
Regime-Adjusted Multiplier — Toggle auto-adjust on/off
Base ATR Multiplier — Used when regime-adjust is off
LOW/NORMAL/HIGH/EXTREME Multipliers — Customize per regime
Display:
Show Long Stop / Show Short Stop
Show Status Label
Long/Short Stop Colors
━━━━━━━━━━━━━━━━━━━━━━━━━━━━━━
🔔 ALERTS
Vol → EXTREME
Vol → LOW
━━━━━━━━━━━━━━━━━━━━━━━━━━━━━━
💡 COMPANION INDICATOR
Use with ATR Volatility Regime (separate pane) for full context:
Pane indicator → percentile visualization, zone backgrounds
This indicator → actionable stop levels on price chart
Both use identical ATR/percentile logic and stay in sync.
━━━━━━━━━━━━━━━━━━━━━━━━━━━━━━
📝 NOTES
Works on any timeframe
Stops are dynamic — recalculate each bar
Not a signal generator — use with your own entry logic
━━━━━━━━━━━━━━━━━━━━━━━━━━━━━━
🏷️ TAGS
ATR, stop-loss, volatility, risk-management, position-sizing, trailing-stop, swing-trading

Yang-Zhang Stop Lines Yang-Zhang Stop Lines - Advanced Volatility Indicator
📊 Description
The Yang-Zhang Stop Lines is an advanced technical indicator that uses the Yang-Zhang volatility estimator to calculate dynamic stop loss and take profit levels. Unlike traditional methods such as ATR or Bollinger Bands, Yang-Zhang considers multiple components of market volatility, offering a more accurate and robust measurement.
🎯 Key Features
Superior Volatility Calculation:
Implements the complete Yang-Zhang estimator, considering overnight volatility, open-close, and Rogers-Satchell components
More accurate than traditional ATR for markets with gaps and distinct sessions
Automatically adapts to market conditions
Intelligent Levels:
Buy Stop (Green): Lower level calculated for long position protection
Sell Stop (Red): Upper level calculated for short position protection
Mirrored Levels: Additional projections based on daily amplitude
Continuous Bands: Real-time visualization of intraday volatility
Daily Anchoring:
Fixed levels calculated at the beginning of each day
Facilitates trade planning with stable references
Horizontal lines extending throughout the trading session
⚙️ Configurable Parameters
Calculation Timeframe: Defines the period for volatility analysis (default: 60min)
Period: Lookback window for statistical calculations (default: 20)
Multiplier: Adjusts level sensitivity (default: 1.0)
Base Price: Reference for stop calculations (default: close)
Visual Options: Bands, fixed lines, labels, fill, and customizable colors
💡 How to Use
For Day Traders:
Use daily fixed levels as reference for stop loss and targets
Watch for price crossovers at levels for reversal signals
Mirrored levels serve as extended targets
For Swing Traders:
Configure higher timeframes (4h, daily) for medium-term analysis
Use the multiplier to adjust to your risk/reward objectives
Combine with trend analysis and support/resistance
Risk Management:
Position stops just below/above calculated levels
Adjust position size based on amplitude
Monitor the info table to check current volatility
📈 Information Table
The indicator displays in the top-right corner:
Current Yang-Zhang Volatility (in %)
Buy Stop Level
Sell Stop Level
Calculated Amplitude
🔔 Included Alerts
Alert when price crosses Buy Stop
Alert when price crosses Sell Stop
🎨 Visual Customization
Independent colors for each element
Adjustable line width
Optional fill between bands
Optional informative labels
📝 Technical Notes
This indicator correctly implements the complete Yang-Zhang estimator formula, including:
Overnight variance
Open-close variance
Rogers-Satchell component
Optimized k weighting
Ideal for traders seeking a scientific and statistically robust approach to stop definition and volatility analysis.
Compatible with all assets and timeframes. Recommended for liquid markets.

ATR Trailing StopATR Trailing Stop (Dynamic Volatility Regimes)
==============================================
This indicator implements an adaptive ATR-based trailing stop for long positions. The stop automatically adjusts based on stock volatility, tightening during fast movements and widening during calm periods. It is designed as a trade management tool to help protect profits while staying aligned with strong trends.
How It Works
------------
* Tracks the highest high over a configurable lookback window and ensures this “top” never moves downward.
* Computes the trailing stop as:**Top – ATR × Dynamic Multiplier**
* The ATR multiplier changes depending on volatility:
* Low volatility → Wide stop (slower trailing)
* Medium volatility → Standard trailing
* High volatility → Tight stop (faster trailing)
* The trailing stop only moves upward; it never decreases.
* If price falls significantly below the stop (default: 5%), the system resets and begins trailing from a new top.
* An optional price-scale label displays:
* Current stop value
* Volatility regime (LOW / MID / HIGH)
* ATR percentage and active multiplier
Alerts
------
Two alert conditions are included:
### Trailing Stop – Near
Triggers when price moves within a user-defined percentage above the stop.
### Trailing Stop – Hit
Triggers when price touches or closes below the stop.
How to Use
----------
1. Add the indicator to any chart (daily timeframe recommended).
2. Configure:
* ATR length
* Lookback bars
* Volatility thresholds
* ATR multipliers
3. Set alerts for early warnings or stop-hit events.
4. Use the stop line as a dynamic risk-management tool to guide exit decisions and protect profits.
Notes
-----
* Designed for long-only trailing logic.
* This indicator does not generate entry signals; it is intended for stop management.

Adaptive Volatility Stop by Pedro Paulo de MeloStop ATR is a clean and reliable volatility-based trailing stop system, built to adapt dynamically to market conditions using the Average True Range (ATR).
It identifies trend direction, adjusts the stop level using stair-step logic, and automatically flips the stop when price reversals occur.
How it works
Uses ATR × Multiplier to calculate an adaptive volatility buffer
Tracks trend direction internally
Recomputes and repositions the stop when a trend flip is detected
Plots separate lines for bullish and bearish stop states
Works on any market and timeframe (crypto, forex, commodities, indices, stocks)
Why it’s useful
This Stop ATR implementation is extremely stable and visually clean.
It is particularly effective for:
Trend following
Position management
Swing and position trading
Systematic stop placement
Unlike many ATR-based stop versions, this script uses a corrected flip-handling method that prevents stop misalignment and ensures consistent trend state tracking.
Inputs
Period — ATR length
Multiplier — ATR factor that defines stop distance
Author
Developed by Pedro Paulo de Melo, open-source version.

XAUUSD Multi-Timeframe Supertrend Alert v2**Indicator Overview: XAUUSD Multi-Timeframe Supertrend Alert v2**
**Core Components:**
1. **Multi-Timeframe Supertrend System**
- Two Supertrend indicators (ST1 & ST2) with customizable timeframes
- ST1 typically set to Daily, ST2 to Weekly as main trend
- Visualized with distinct colors and background fills
2. **Customizable SMA**
- Adjustable period and timeframe
- Plotted as blue line for additional trend reference
3. **Neutral Zone System**
- Creates a neutral line offset from ST1 by customizable tick distance
- Yellow dashed line that adjusts based on ST1 trend direction
- **Alert Conditions:**
- **Test Buy Zone**: Both ST1 & ST2 in uptrend AND price enters neutral zone above ST1
- **Test Sell Zone**: Both ST1 & ST2 in downtrend AND price enters neutral zone below ST1
4. **Distance Lines from ST2**
- Upper/lower lines at customizable tick distance from ST2
- Purple dashed lines with touch alerts
**Trading Signals:**
- **Bullish Signal**: Price above ST2 but below ST1 (potential buy)
- **Bearish Signal**: Price below ST2 but above ST1 (potential sell)
- **Neutral Zone Alerts**: Price enters defined zone when both trends align
- **Line Touch Alerts**: Price touches distance lines from ST2
**Alert System:**
- Limited to 3 consecutive alerts per signal type
- Visual markers (triangles, diamonds, circles)
- Background coloring for signal zones
- Separate alert conditions for each signal type
**Visual Features:**
- Candles colored green/red based on signals
- Clear trend visualization with colored backgrounds
- Real-time alert markers without information table clutter
This indicator provides multi-timeframe trend analysis with precise entry zone detection and comprehensive alert system for XAUUSD trading. SAM89 M15, ST1 (5:10) M5, ST2 ( 1,5:20) H1, Test Buy Sell 7000, Line 15000

ATR Trailing Stop with Entry Date & First-Day MultiplierATR based trailing stop based on a X post of Aksel Kibar.

Risk ModuleThis indicator provides a visual reference for position sizing and approximate stop and target placement. It supports trade planning by calculating equalized risk per trade and maintaining consistent exposure across different markets.
For more information about the concept, see the post Position Sizing and Risk Management .
Fixed Fractional Risk
The indicator calculates the number of shares that can be traded to maintain consistent monetary risk. The formula is based on the distance between the current price and stop reference, adjusting position size proportionally. A closer stop results in a larger position size, while a wider stop results in a smaller one.
Position Size = (Account Size × Risk %) ÷ (Entry Price – Stop Price)
Stop and Target
Stop placement is derived from volatility using the Average True Range (ATR). The target is plotted as a multiple of the stop distance, defining the risk-to-reward relationship in R units.
Stop = Price ± ATR × Multiplier
Target = Price ± (R × Risk Distance)
Chart Elements
The stop and target levels are plotted above and below the current price, with the stop marked by a red dot and the target by a green dot. The information table displayed on the chart shows the number of shares to trade, stop level, and target level.
Setup and Configuration
This configuration only needs to be set once, but can be adjusted later if preferred.
1. Start by setting the account size and risk percentage per trade to define the monetary amount risked on each trade. These values form the basis for position size calculation.
2. Set the ATR multiplier to determine stop distance, common values range between 1 and 3 ATR. Lower values place stops closer to price, increasing sensitivity but risking short-term noise. Higher values widen the stop, which reduces noise impact but extends time in risk.
3. Set the R-multiple to determine target distance relative to the stop. A value of 1 represents a 1:1 risk-to-reward relationship. Lower values reduce potential reward but tend to increase win rate, whereas higher values increase potential reward but tend to reduce win rate. The selection depends on system characteristics and trade expectancy.
When the parameters are defined, the indicator displays the stop, target, and calculated position size on the chart. All that remains is to enter the trade with the number of shares shown in the table and place bracket orders at the plotted stop and target levels.
Settings Overview
Account Size / Risk %: Defines account capital and per-trade exposure.
ATR Multiplier: Adjusts stop distance relative to volatility.
R Multiple: Sets target distance relative to stop (risk-reward ratio).
Position: Choose Long or Short direction.
Table Position: Controls information table placement and scale.

Multi-Timeframe Trend ImprovedMulti-Timeframe Trend Improved — Volatility Stop & Trend Change Alerts
This script tracks trend direction across four customizable timeframes using a Volatility Stop method based on ATR. It displays:
VolStop levels and trend direction (Uptrend/Downtrend) per timeframe.
Bars since the last trend change in each timeframe.
A customizable table showing all data with color-coded trends.
Visual alerts via triangle shapes on the chart when a trend change occurs.
🔧 Fully configurable:
Timeframes (e.g., 65min, 4H, Daily, Weekly)
ATR length, multiplier, and smoothing
Table location, font size, border width, and label color
Ideal for traders who want a clear multi-timeframe overview of market trends and volatility-based support/resistance levels.

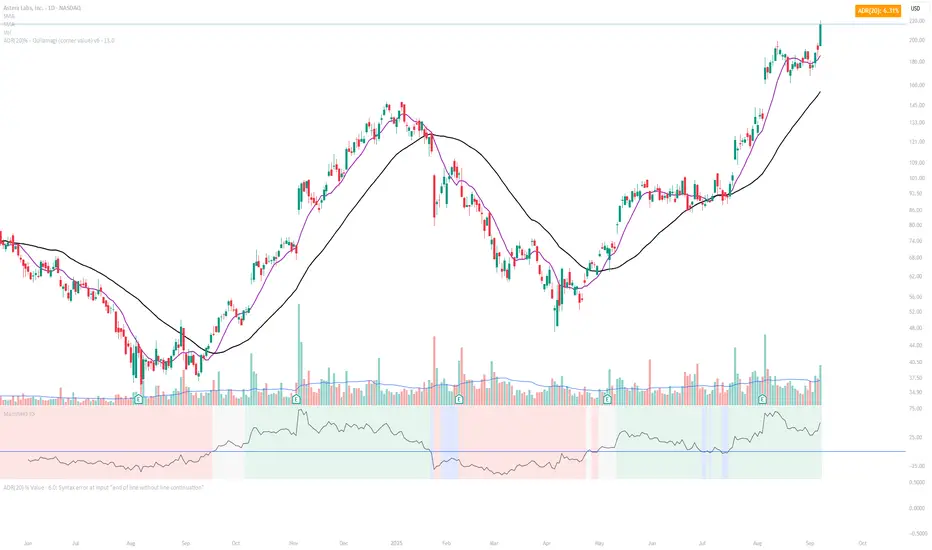
ADR(20)% - Qullamagi (corner value) v6This indicator displays the 20-bar Average Daily Range (ADR) either as a percentage of price or in raw dollar terms, shown in a clean corner box on the chart.
Switch between % ADR and $ ADR with a single checkbox.
Place the output box in any chart corner.
Useful for volatility assessment, stop-loss sizing, and stock selection.
Inspired by the trading approach of Kristjan Qullamägi (Qullamaggie), who uses ADR(20) both to filter high-momentum stocks and to size risk (stops should generally be ≤ 1×ADR).

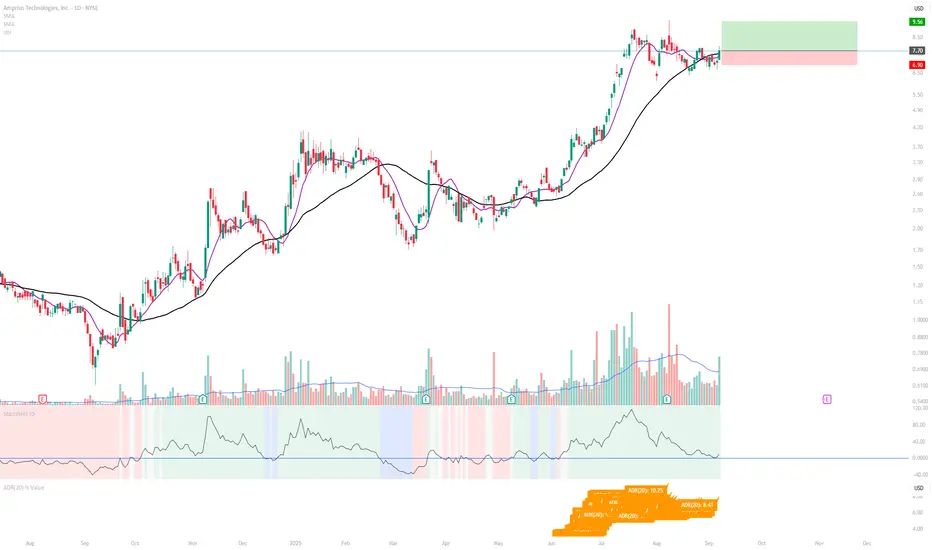
ADR(20)% - Qullamagi (corner value) v6Description:
This indicator calculates the 20-day Average Daily Range (ADR) as a percentage (or in raw $) and displays it in a clean corner table on the chart.
Formula: average of (High ÷ Low – 1) over the last 20 bars.
Use % or $ mode via settings.
Position the box in any chart corner.
Inspired by Kristjan Qullamägi (Qullamaggie), who uses ADR to filter strong movers and size stop-losses (stops should generally be ≤ 1×ADR).
ADR(20) % ValueDisplays the 20-day Average Daily Range (ADR) as a % of price, following the method popularized by Kristjan Qullamägi (Qullamaggie). The ADR value updates dynamically and is printed directly on the chart for quick reference.
ATR Dynamic Stop (Table + Plot + ATR %)📊 This script displays dynamic stop levels based on ATR, designed for active traders.
Features:
- Shows long and short stop levels (price ± ATR × multiplier).
- Displays values as a floating table on the top-right corner.
- Optional plot lines directly on the chart.
- Option to calculate based on realtime price or last close.
- Displays the ATR value both in price units and as a percentage of the selected price.
- Fully customizable table: text size, text color, background color.
Inputs:
- ATR Multiplier and Length.
- Show/hide stop lines on the chart.
- Select price source (realtime or last close).
- Table appearance options.
Ideal for:
- Traders who want a clear visual stop guide.
- Combining volatility with risk management.

Capital Risk OptimizerCapital Risk Optimizer 🛡️
The Capital Risk Optimizer is an educational tool designed to help traders study capital efficiency, risk management, and scaling strategies when using leverage.
This script calculates and visualizes essential metrics for managing leveraged positions, including:
Entry Price – The current market price.
Stop Loss Level – Automatically derived using the 30-bar lowest low minus 1 ATR (default: 14-period ATR), an approach designed to create a dynamic, volatility-adjusted stop loss.
Stop Loss Distance (%) – The percentage distance between entry and stop.
Maximum Safe Leverage – The highest leverage allowable without risking liquidation before your stop is reached.
Margin Required – The amount of collateral necessary to support the desired position size at the calculated leverage.
Position Size – The configurable notional value of your trade.
These outputs are presented in a clean, customizable table overlay so you can quickly understand how position sizing, volatility, and leverage interact.
By default, the script uses a 14-period ATR combined with the lowest low of the past 30 bars, providing an optimal balance between sensitivity and noise for defining stop placement. This methodology helps traders account for market volatility in a systematic way.
The Capital Risk Optimizer is particularly useful as a portfolio management tool, supporting traders who want to study how to scale into positions using risk-adjusted sizing and capital efficiency principles. It pairs best with backtested strategies, and does not directly produce signals of any kind.
How to Use:
Set your desired position size.
Adjust the ATR and lookback settings to fine-tune stop loss placement.
Study the resulting leverage and margin requirements in real time.
Use this information to simulate and visualize potential trade scenarios and capital allocation models.
Disclaimer:
This script is provided for educational and informational purposes only. It does not constitute financial advice and should not be relied upon for live trading decisions. Always do your own research and consult with a qualified professional before making any trading or investment decisions.

ATR Buy, Target, Stop + OverlayATR Buy, Target, Stop + Overlay
This tool is to assist traders with precise trade planning using the Average True Range (ATR) as a volatility-based reference.
This script plots buy, target, and stop-loss levels on the chart based on a user-defined buy price and ATR-based multipliers, allowing for objective and adaptive trade management.
*NOTE* In order for the indicator to initiate plotted lines and table values a non-zero number must be entered into the settings.
What It Does:
Buy Price Input: Users enter a manual buy price (e.g., an executed or planned trade entry).
ATR-Based Target and Stop: The script calculates:
Target Price = Buy + (ATR × Target Multiplier)
Stop Price = Buy − (ATR × Stop Multiplier)
Customizable Timeframe: Optionally override the ATR timeframe (e.g., use daily ATR on a 1-hour chart).
Visual Overlay: Lines are drawn directly on the price chart for the Buy, Target, and Stop levels.
Interactive Table: A table is displayed with relevant levels and ATR info.
Customization Options:
Line Settings:
Adjust color, style (solid/dashed/dotted), and width for Buy, Target, and Stop lines.
Choose whether to extend lines rightward only or in both directions.
Table Settings:
Choose position (top/bottom, left/right).
Toggle individual rows for Buy, Target, Stop, ATR Timeframe, and ATR Value.
Customize text color and background transparency.
How to Use It for Trading:
Plan Your Trade: Enter your intended buy price when planning a trade.
Assess Risk/Reward: The script immediately visualizes the potential stop-loss and target level, helping assess R:R ratios.
Adapt to Volatility: Use ATR-based levels to scale stop and target dynamically depending on current market volatility.
Higher Timeframe ATR: Select a different timeframe for the ATR calculation to smooth noise on lower timeframe charts.
On-the-Chart Reference: Visually track trade zones directly on the price chart—ideal for live trading or strategy backtesting.
Ideal For:
Swing traders and intraday traders
Risk management and trade planning
Traders using ATR-based exits or scaling
Visualizing asymmetric risk/reward setups
How I Use This:
After entering a trade, adding an entry price will plot desired ATR target and stop level for visualization.
Adjusting ATR multiplier values assists in evaluating and planning trades.
Visualization assists in comparing ATR multiples to recent support and resistance levels.

ATR Screener with Labels and ShapesWeekly Daily ATR Pine Scanner
To find out tightness or contraction in a stock we needs to check if volatality is decreasing as well as compared to previous 14 or 10 bars volatility . we check this for weekly and then for Daily , so that we can enter in a stock which is tightest in recent times.
Condition is :
1. Weekly Candle ATR x 0.8 < 10 Week ATR
2. Daily Candle ATR x 0.6 < 14 Day ATR
When both of the conditions are met then they signifies that the stock has tightened in weekly and daily aswell . so now we can find ways to enter during max squeeze.
How to scan in Pine Scanner ?
FIrst add indicator as favourite and Go to pine scanner page in trading view and then scan your watchlist and there you will see 3 columns 1 with only Weekly conditions met , 2 with only Daily and 3rd with Both conditions met .
Select stocks and move to new watchlist and now you have those stocks which has contracted the most in recent times .

AsturRiskPanelIndicator Summary
ATR Engine
Length & Smoothing: Choose how many bars to use (default 14) and the smoothing method (RMA/SMA/EMA/WMA).
Median ATR: Computes a rolling median of ATR over a user-defined look-back (default 14) to derive a “scalp” target.
Scalp Target
Automatically set at ½ × median ATR, snapped to the nearest tick.
Optional rounding to whole points for simplicity.
Stop Calculation
ATR Multiplier: Scales current ATR by a user input (default 1.5) to produce your stop distance in points (and ticks when appropriate).
Distortion Handling: Switches between point-only and point + tick displays based on contract specifications.
Risk & Sizing
Risk % of account per trade (default 2 %).
Calculates dollar risk per contract and optimal contract count.
Displays all metrics (scalp, stop, risk/contract, max contracts, max risk, account size) in a customizable on-chart table.
ATR-Based Stop Placement Guidelines
Trade Context ATR Multiplier Notes
Tight Range Entry 1.0 × ATR High-conviction, precise entries. Expect more shake-outs.
Standard Trend Entry 1.5 × ATR Balanced for H2/L2, MTR, DT/DB entries.
Breakouts/Microchannels 2.0 × ATR Wide stops through chop—Brooks-style breathing room.
How to Use
Select ATR Settings
Pick an ATR length (e.g. 14) and smoothing (RMA for stability).
Adjust the median length if you want a faster/slower scalp line.
Align Multiplier with Your Setup
For tight-range entries, set ATR Multiplier ≈ 1.0.
For standard trend trades, leave at 1.5.
For breakout/pullback setups, increase to 2.0 or more.
Customize Risk Parameters
Enter your account size and desired risk % per trade (e.g. 2 %).
The table auto-calculates how many contracts you can take.
Read the On-Chart Table
Scalp shows your intraday target.
Stop gives Brooks-style stop distance in points (and ticks).
Risk/Contract is the dollar risk per contract.
Max Contracts tells you maximum position size.
Max Risk confirms total dollar exposure.
Visual Confirmation
Place your entry, then eyeball the scalp and stop levels against chart structure (e.g. swing highs/lows).
Adjust the ATR multiplier if market context shifts (e.g. volatility spikes).
By blending this sizing panel with contextual ATR multipliers, you’ll consistently give your trades the right amount of “breathing room” while keeping risk in check.

Realtime ATR-Based Stop Loss Numerical OverlayRealtime ATR-Based Stop Loss Numerical Overlay
A simple, effective tool for dynamic risk management based on ATR (Average True Range) without adding cluttered and distracting lines all over your chart.
📌 Description
This script plots a real-time stop loss level using the Average True Range (ATR) on your chart, helping you set consistent, volatility-based stops. It supports both:
✅ Current chart timeframe
✅ Custom fixed timeframe inputs (1m, 5m, 15m, 1h, etc.)
The stop level is calculated as:
Stop = ATR × Multiplier
and updates in real-time. An overlay table displays on the bottom-right of your chart with the calculated stop value in a clean, simple way.
⚙️ Settings
ATR Timeframe Source:
Choose between using the current chart's timeframe or a fixed one (e.g. 5, 15, 60, D, etc).
ATR Length:
Period used to calculate the ATR (default is 14).
Stop Loss Multiplier:
Multiplies the ATR value to define your stop (e.g., 1.5 × ATR).
Wait for Timeframe Closes:
If enabled, the ATR value waits for the selected timeframe’s candle to close before updating. If unselected, it will update in real time.
🛠️ How to Use
Add this script to your chart from your indicators list.
Configure your desired timeframe, ATR length, and multiplier in the settings panel.
Use the value shown in the table overlay as your suggested stop loss distance from entry.
Adjust your position sizing accordingly to fit your risk tolerance.
This tool is especially useful for traders looking for adaptive risk management that evolves with market volatility — whether scalping intraday or swing trading.
💡 Pro Tip
The ATR stop can also be used to dynamically trail your stop behind price movement.

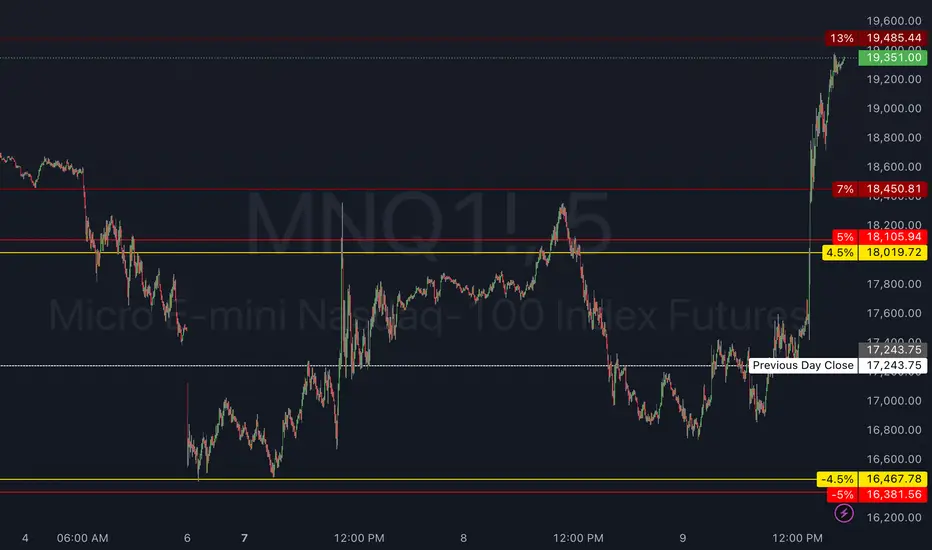
Circuit Breaker LevelsThis indicator will show the Previous Day's Close and +/- 4.5% (Warning Level for Prop Firms), 5% (Prop Firm Trading Halted), 7% (First CME Circuit Breaker), 13% (Second CME Circuit Breaker), and 20% (Final CME Circuit Breaker All Trading Halted for the Day).
SUPeR TReND 2.718An evolved version of the classic Supertrend, SUPeR TReND 2.718 is built to deliver elegant, high-precision trend detection using Euler's constant (e = 2.718) as its default multiplier. Designed for clarity and visual flow, this indicator brings together smooth line work, intelligent color logic, and a minimalistic tally system that tracks trend persistence — all in a highly customizable, overlay-ready format.
Unlike traditional implementations, this version maintains line visibility regardless of fill opacity, ensuring crisp tracking even in complex environments. Ideal for traders who value both aesthetics and actionable structure.
__________________________________________________________
🔑 Key Features:
- 📐 ATR-based Supertrend with default multiplier = e (2.718)
- 📉 Dynamic trend line with optional fill beneath price
- ⏳ Trend duration tally label (count-only or full format)
- ⬆️ Higher-timeframe Supertrend overlay (optional)
- 🟢 Directional candle coloring for clarity
- 🟡 Subtle anchor line to guide perception without clutter
- ⚙️ PineScript v6 compliant, efficient and modular
__________________________________________________________
🧠 Interpretation Guide:
- The Supertrend line tracks trend support or resistance — beneath price in uptrends, above in downtrends.
- The shaded fill reflects direction with 70% transparency.
- The trend tally label counts how long the current trend has lasted.
- Candle colors confirm direction without overtaking price action.
- The optional HTF line shows higher-timeframe context.
- A soft yellow anchor line stabilizes the fill relationship without distraction.
__________________________________________________________
⚙️ Inputs & Controls:
- ✏️ ATR Length – Volatility lookback
- 🧮 Multiplier – Default = 2.718 (Euler's number)
- 🕰️ Higher Timeframe – Choose your bias frame
- 👁️ Show HTF / Main – Toggle each trend layer
- 🧾 Show Label / Simplify – Show trend duration, with or without arrows
- 🎨 Color Candles – Turn directional bar coloring on or off
- 🪄 Show Fill – Toggle the shaded visual rhythm
- 🎛️ All visuals use tuned colors and transparencies for clarity
__________________________________________________________
🚀 Best Practices:
- ✅ Works on any time frame; shines on 1h v. 1D
- 🔁 Use the HTF line for macro bias filtering
- 📊 Combine with volume or liquidity overlays for edge
- 🧱 Use as a structural base layer with minimalist stacks
__________________________________________________________
📈 Strategy Tips:
- 🧭 MTF Trend Alignment: Enable the HTF line to filter trades. If the HTF trend is up, only take longs on the lower frame, and vice versa.
- 🔁 Pullback Entries: During a strong trend, consider short-term dips below the Supertrend line as possible re-entry zones — only if HTF remains aligned.
- ⏳ Tally for Exhaustion: When the bar count exceeds 15+, look for confluence (volume divergence, key levels, reversal signals).
- ⚠️ HTF Flip + Extended Trend: When the HTF trend reverses while the main trend is extended, that may be a macro exit or fade signal.
- 🚫 Solo Mode: Disable HTF and use the main trend + tally as a standalone signal layer.
- 🧠 Swing Setup Friendly: Especially powerful on 1D or 1h in swing systems or trend-based grid strategies.
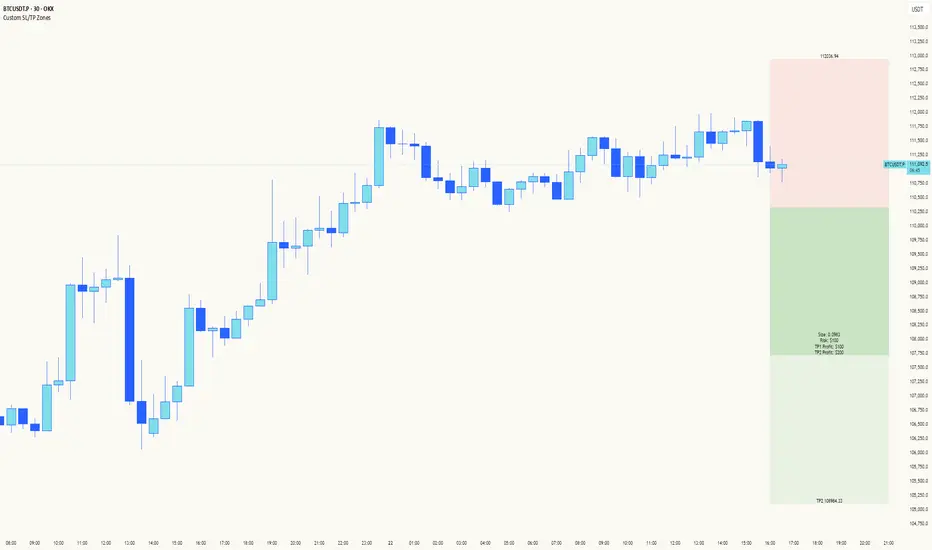
Custom SL/TP ZonesThe "Please Don't Stop Me Now" Indicator 📊
Ever found yourself staring at a chart, thinking "This is DEFINITELY the bottom!" only to watch your stop loss get hit faster than your ex replacing you? Well, this indicator won't stop that from happening, but at least you'll know exactly where you're going to be wrong! 🎯
How it works:
See a setup you like? Pick your candle of choice (make sure it's closed - we're not fortune tellers here)
Hit either Bull or Bear (choose wisely, or don't - we all know it's 50/50 anyway)
3. Marvel at the beautiful boxes showing your:
Take Profit Zone (where you'll exit too early)
Stop Loss Zone (where you'll probably exit, let's be honest)
Features:
Uses ATR for dynamic zones because "one size fits all" only works in disappointing Halloween costumes
Extends 10 bars into the future, giving you plenty of time to watch your prediction go wrong
Price labels included so you know exactly where to set your alerts (and subsequently ignore them)
Customizable multipliers for when you're feeling extra brave (or foolish)
Clean interface that won't distract you from your bad decisions
Remember: The market can stay irrational longer than you can stay solvent, but at least with this indicator, you'll know exactly where your rationality ends and your "This time it's different" begins!
Happy Trading! (Results may vary, tears not included)
Settings:
TP Multiplier: How far to your dreams (Default: 4.0)
SL Multiplier: How far to your nightmares (Default: 2.0)
Bar Offset: Pick your poison (1 = last closed bar)
Colors: Because trading isn't painful enough in grayscale